Learn / Guides / Qualitative data analysis guide
4 qualitative data analysis challenges & how to solve them
Qualitative data analysis unlocks your understanding of why users behave the way they do on your site and in your product, and how they feel about the user experience. It gets to the core of why customers buy—or don’t buy—and can help your team generate user-centric ideas for creating customer delight.
But qualitative data analysis challenges can make the process seem like more trouble than it’s worth. QDA can be subjective, nuanced, open to interpretation, and overwhelming at scale.

This guide looks at the four biggest challenges in qualitative data analysis—and solutions to overcome them with confidence and clarity.
Turn qualitative data analysis challenges into opportunities
Use Hotjar's tools to collect, organize, and analyze product experience insights—and collaborate with your team.

The 4 toughest qualitative data analysis challenges (and how to overcome them)
Many people start with quantitative data—the facts and figures. These are often easier to grasp and simpler to obtain: just connect to Google Analytics or a similar platform, and you’re ready to roll.
But quantitative data only tells half the story. It can tell you 'what', but you need qualitative insights to fill in the gaps about 'why'. For example, Google Analytics might show you that your checkout page has a high bounce rate—but why are users leaving the site at checkout? What’s stopping them from buying?
Qualitative data can answer the questions that quantitative data can't. But, then the problem becomes interpreting that qualitative data to find patterns and trends among volumes of feedback.
Here are four of the most common qualitative data analysis challenges—along with tips to conquer them so you can improve the user and product experience.
1. Choosing a method—and getting started
Qualitative data analysis can seem overwhelming due to the many choices you have for exploring customer and user feedback.
First, you need to decide what data streams you'll analyze: on-page surveys, interviews, customer service emails, reviews, live chat, etc.
Then, there are at least five QDA methods to choose from: content analysis, thematic analysis, narrative analysis, grounded theory analysis, and discourse analysis.
With all the possibilities in front of you, it’s easy to freeze—and QDA becomes a non-starter.
The keys to overcoming analysis paralysis are examining your priorities and determining a process that fits your team's unique needs:
Clarify your purpose
One of the best ways to fight overwhelm—and save time—is to clarify your objectives. It’s not enough to be curious about what users think. You need to head into the analytical process with a clear sense of why you're doing this work.
Try this:
Consider your company’s goals. If you know your organization is striving for customer or user delight, your purpose for qualitative data analysis might be to isolate the top three drivers of positive sentiment.
Start with quantitative data. Sometimes you can find your purpose by starting with a question based on quantitative data findings. For example, if sales of a specific product are down, your goal may be to uncover the reason for the drop.
Customize your process
For some people, qualitative data analysis is a manual process; for others, it’s automated with software. Either way, remember that the approach you take can always change. And, a bonus: you’ll improve your team's understanding and buy-in by communicating the iterative nature of developing a QDA process.
“Many people resist new processes because they fear permanence. In our case, when we try a new tool or process, we always frame it in terms that communicate the trial-like nature of it,” says Agustin Soler, Co-Founder and Head of Product at MURAL. “We say if it works, we’ll continue with it and improve it. If it doesn’t, we’ll find out what went wrong and go from there. That approach seems to find a lot of success in my company.”
If you don’t know where to start, try thematic analysis. This method works with many types of qualitative data, but is particularly useful for customer feedback. With thematic analysis, you read through data, code it by identifying key phrases that relate to a similar topic, and then look for themes—overarching ideas for grouping.
A glimpse into a product manager’s qualitative data analysis process
Anna Eaglin, Senior Product Manager at Grow Therapy, a tech platform that connects licensed mental health practitioners with clients, shared her process for approaching thematic qualitative data analysis. Here’s how she analyzes feedback from customer interviews:
Summarize high-level findings at the end of each interview, identifying key positives, pains, opportunities, etc.
Identify emerging themes to help with coding.
Put data into a table using Excel, Airtable, or Coda. Make each row an independent idea, coding it appropriately.
Then, theme the feedback and look for patterns.
By the end of this process, Anna can identify the highest priority pain points for customers, which she shares with the product management, design, and engineering teams. Together, they triage these pain points based on their importance to users and the company’s business goals—and determine next steps for implementing changes.
2. Avoiding bias
Qualitative data analysis isn’t as cut and dry as quantitative, and it can be tough to leave your opinion out. But to better understand the user or customer, it’s important to check any preconceived notions at the door.
One common challenge is confirmation bias—looking for evidence to confirm an existing opinion or hypothesis. In qualitative data analysis, confirmation bias can cause tunnel vision: we get so focused on what we think we’ll see that we don’t see the actual problem.
Another challenge is observation bias, also known as the Hawthorne effect. Essentially, this is when people change how they behave when they know someone is observing them.
Avoiding bias in qualitative data analysis requires self-reflection—and often the help of a team.
💡 Pro tip: use a tool like Hotjar's Recordings to avoid the Hawthorne effect. Recordings show you playbacks of real users scrolling, clicking, and experiencing your site and product.
Brett Orr, Lead Product Owner at Reed, says: “Previously we got all our qualitative feedback through surveys or sitting down with customers. However, naturally when you observe someone their behavior changes, with Hotjar that's not the case.”
Hotjar recordings show you how users interact with your site.
Use reflexivity
Reflexivity means considering how your background and experiences affect the way you perceive the world—and how that point of view might influence your research and analysis.
Personal reflexivity involves reflecting on your unique personal identity, including socioeconomic, racial, gender, and values-based perspectives. Functional reflexivity is about reflecting on your role and analytical methods.
Keeping a reflexive journal brings awareness, accountability, and clarity to your work with qualitative data. Ask yourself:
What are your values, attitudes, and beliefs about life, and how might they affect your research and analysis?
What preconceived ideas might you have about the topic you're examining?
What decisions have you struggled to make in your research and analysis? Why do you think they were hard for you?
By answering questions like these in a reflexive journal, you’ll better understand the lens you view information through—which can help you take a more objective stance in your study.
Get input from teammates
One of the best ways to avoid bias is to get feedback from others. For example, when conducting thematic analysis, you can ask a co-worker to evaluate your codes and themes.
Even better: you can make qualitative data analysis fun! by hosting a Hotjar Recordings watch party, like home-rental company Spotahome does.
“If I watch these videos by myself, I might miss something that a developer would notice. What I look for is different from what others look for,” notes Sara Parcero, Spotahome’s Customer Knowledge Manager. “When I have people from different backgrounds look at the same recordings, I know that we’ll have a complete analysis from everyone.”
💡 Pro tip: when you log in to Hotjar, navigate to your Highlights from the Dashboard. Then, start a collection called “Hotjar Watch Party.” You can save any interesting clips you want to share with your team, so they're all neatly organized in one place.
Then, on the day of your meeting (add snacks 🍿to make it a party), team members can add their thoughts to this Miro template. The template lets you drag insights to group them into themes. Then, as a group, you can discuss next steps.
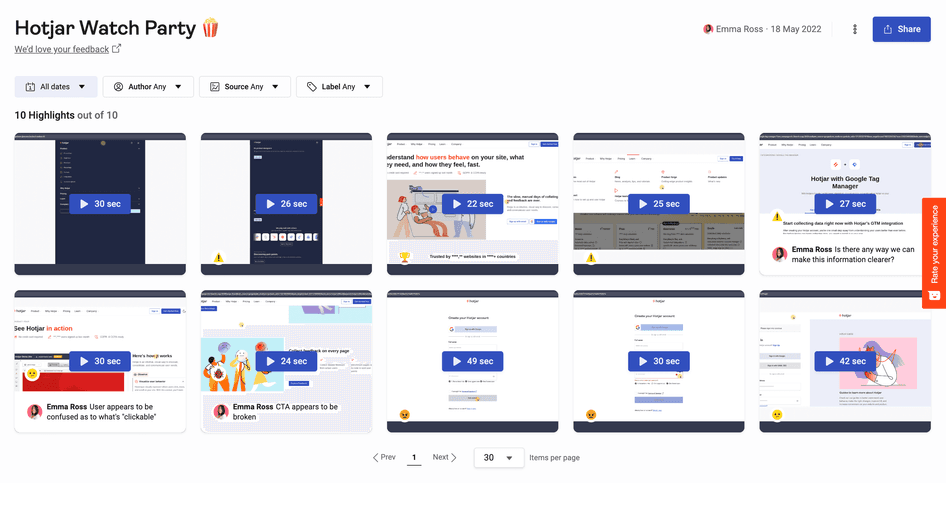
Creating a Hotjar collection lets you organize clips for your watch party ahead of time
3. Ensuring accuracy and consistency
Quantitative data is all about numbers, so accuracy is simpler: you can see that 200 more customers purchased a product this month than last.
But qualitative information is based on interpretation. How do you stay consistent as you work through multiple data sources—and between team members—to produce accurate insights?
Ensuring accuracy and consistency is easier when you automate your processes and create a clear coding system.
Creating a coding system
Thematic analysis requires researchers to develop codes for common ideas in the text. For example, a customer comment could say, “I could’ve found something similar for less money,” and it might be coded as “pain points” or “price.”
To make coding easier:
Decide whether you’ll use inductive coding, deductive coding, or both. With inductive coding, you start assigning descriptive labels as you read through the data. With the deductive approach, you create the codes first, and then find evidence to fit. For those who want the best of both worlds, start with a few potential codes, but leave room to create more as you work.
Create a key with examples and non-examples of evidence for each code. This strategy will ensure consistency when more team members jump in to help with the process.
Automating analysis
Manual qualitative data analysis can take weeks—and still produce inconsistent results. Instead, try using Hotjar’s Recordings, Feedback, or Surveys to collect qualitative product experience insights, and then follow up with tools like Thematic or Delve to develop codes and themes.
4. Tackling loads of data
While some companies may struggle to collect enough feedback for a meaningful study, many organizations have the opposite problem—the sheer amount of data to analyze can be stressful and time-consuming.
For me, the biggest challenge is the undertaking of dealing with it all. I generally try to make sure I do a summary or roll-up of each interview, but when I inevitably get behind, I find myself with a lot of information to comb through; it can feel really daunting.
When faced with mountains of transcripts or the results of 10,000 surveys—like RyanAir had—you need a solid strategy for analysis.
With that much data, manual analysis isn’t an option. You need the right tools for the job—and plenty of time to get the job done.
Select the right software
Choose tools tailored to your exact analysis method. With many qualitative data analysis tools on the market, your team has plenty of options. For example, if you’re conducting sentiment analysis—a type of thematic analysis focusing on inferring customers’ feelings—you’ll want to choose a tool like Dovetail that offers that feature.
Choose software that keeps you focused and makes it easy to collaborate. Hotjar's Workspaces let you home in on specific customer voices to save time in the data collection and analysis processes. Create a dedicated workspace for the task at hand, and customize the settings to show only the most relevant recordings. This type of organization means you and your team can get right to analysis.
A Hotjar workspace keeps your team focused on the most relevant recordings.
Budget your time from the start
It’s easy to underestimate the time it takes to organize, sort, code, theme, and analyze data. A good rule of thumb: set aside at least the same amount of time for analysis as you did for data collection. For example, if you spent 10 hours conducting customer interviews, plan on spending at least 10 hours analyzing the recordings or transcripts.
Clearing qualitative data analysis hurdles to uncover product experience insights
When analyzing qualitative data, you’ll likely encounter one of the challenges listed above (or—let’s face it—all four of them).
But when you fine-tune your methods, use the appropriate tools, and collaborate with teammates, qualitative data analysis becomes smoother and yields more insights.
Take the time to tackle your challenges head-on to experience growth as a team—and uncover opportunities to minimize friction for users and increase customer delight.
Turn qualitative data analysis challenges into opportunities
Use Hotjar's tools to collect, organize, and analyze product experience insights—and collaborate with your team.