Learn / Guides / UX design
UX metrics: why you need both qualitative and quantitative data to be successful
As a product team, metrics impact everything you make. But, 'how can we measure that?' sometimes sounds like a trick question.
Ideally, you’d choose a few key metrics to track and try to turn that raw data into actionable insights. But what if there’s just too much data to make sense of? Or what if your team hasn’t started tracking anything specific yet?

To be truly strategic (and successful!), user experience and product metrics should connect the dots between user needs and business objectives. When you know what your customers are doing and why they’re doing it, your team can repeat successes and learn where and how to improve.
With metrics that make sense for your product and business, your team can confidently transition from working reactively and in isolation to making cross-functional collaboration a reality. Together, you can flag pesky bugs, highlight improvements, and identify positive use cases to help your product evolve.
What is a UX metric?
A user experience (UX) metric—also known as a usability or product experience (PX) metric—lets you measure, compare, and track the user experience of a website or app.
There are two main types of UX metrics you can track:
Quantitative behavioral metrics focus on how users interact with your product or service (e.g. abandonment rate, churn and retention rates, and task success)
Qualitative attitudinal metrics focus on how users feel about your product or service, based mainly on user feedback (e.g. loyalty, satisfaction, usability, and credibility)
Over time, these metrics help you compare and track the quality of the user experience.
A note from Julia: the magic is in your mindset, not your metric ✨
Product designer Julia Feld says it’s a rite of passage for most designers to work on teams that are focused on business metrics.
The long-term goal to keep in mind? “Slowly but surely support your organization in evolving into a more user-centric approach while demonstrating the positive business impact of this shift.”
Once you’ve found the right UX tools to support the development process—from ideation, through prototyping and design, up to the testing and iterating stage—you’ll end up with valuable data to measure against goals and metrics.
But just like there is no universal UX or product workflow that works for every team, there is no single fail-safe or 'magic' UX metric that can help you measure the benefit of investing in UX. Instead, focus on starting small and being consistent with what you measure.
Improve UX with product experience insights from Hotjar
Use Hotjar to understand how real users are experiencing your website or app—then improve it for them!

5 UX metrics that product teams should pay attention to (and why)
Instead of measuring everything (just because you can), keep in mind what makes a metric most useful. The best UX metrics should:
Have a timeframe
Have a benchmark
Have a clear reason for being collected and reported
Tie back to an action you want your customers to take
Your team might rely on metrics to track changes over time, benchmark how your website or app performs against competitors, or set targets like quarterly objectives and key results (OKRs). Metrics can also be a way to lobby for change within your organization if approached with the right mindset.
A note from Julia: the right team is as important as the right metrics 🙌
Julia believes choosing the right metrics comes from team chemistry and collaboration:
“No external metric is going to change how you work as a team. Working on team trust and communication will likely be a better investment for the long term, and naturally will surface metrics for evaluation together.”
Here’s a 'UX metrics starter pack' for your team, as you start to get serious about how to track and measure the user experience:
1. Customer Satisfaction Score (CSAT)
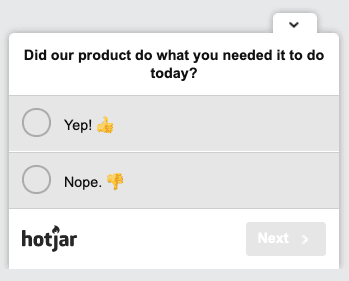
Customer Satisfaction Score (CSAT) measures how happy your customer is (or isn’t) about a specific product or feature, the user experience, or your business as a whole.
CSAT surveys typically ask a question like “Did our product do what you needed it to do today,” and offer a binary response (yes or no, happy or sad face). Scores are usually pretty high (~98%), so a sudden drop can indicate there's an issue or blocker that needs immediate attention.
CSAT helps tie customer satisfaction to key moments in the user experience. Picking the right moment matters, so try using an on-site CSAT survey to help you learn about customer satisfaction:
After important customer lifecycle moments (like onboarding or upgrading their account)
Before a membership or subscription renewal
After customer support or education moments
How to fill the emotional gap left by CSAT
CSAT survey results can tell you what might satisfy potential customers, but you still need to find out why that is.
Hotjar’s Incoming Feedback widget lets customers offer input beyond ratings-based feedback, so you can collect voice of the customer (VoC) data to help your product team address customer pain points and blockers.
For example, maybe your company has an average CSAT score of 85% after a new product launch—but your team knows the pre-launch CSAT score was 95%. To investigate the drop, place an Incoming Feedback widget on the new product page and encourage customers to:
Offer visual feedback on their first impression of the new product
Explain why they felt a certain way about it
Take screenshots of specific elements or features that prompted their feedback
A note from Julia: how to introduce voice of customer data to your organization 🗣️
Julia suggests starting with a tool like Hotjar’s Incoming Feedback widget or the comments from NPS surveys (a metric that is readily adopted by most businesses as a benchmark for improvement) to introduce VoC data into your product and UX decisions.
If you’re still building a business case for customer data, find customer quotes from user research and interviews.
Julia says, “Even if what you end up finding isn’t a major customer pain-point, at least you’re now pulling up a chair to the metaphorical table where the customer can sit. Little by little, the voice can grow. The next step might be to pull quotes at the end of a project to highlight pain points or successes the customers have had.”
Metrics and data on their own won’t guarantee a fast-track to success—but by collecting feedback on every webpage or app screen, watching session recordings of real users, seeing where user attention drops, and asking visitors what they want, it becomes easier to empower your team to take action and tie metrics to product revenue.
2. Customer Effort Score (CES)
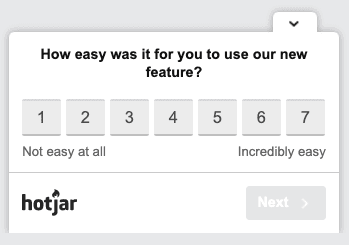
Customer Effort Score (CES) is a customer experience survey metric that helps product teams understand how easy it was for a customer to interact, accomplish a goal, or resolve an issue within a product.
CES is measured by asking a question about your product's or website's ease of use. The customer answers on a scale—typically from 1-7, 1 representing the lowest level of ease and 7 representing the highest level of ease.
Product teams can use CES surveys to uncover high-effort pain points in the product experience alongside operational metrics like repeat request transfers and channel switching.
How to fill the emotional gap left by CES
Hotjar’s on- and off-site Surveys help your team collect VoC feedback to learn what the customer thinks, how they're experiencing your product, and why they’re leaving your website.
Use Hotjar's Survey Logic feature to optimize engagement with your survey questions by removing irrelevant steps from the user journey. Reduce friction and keep respondents engaged in providing your team with actionable feedback.
3. Net Promoter Score®
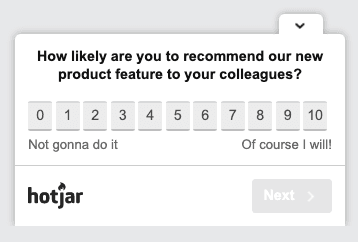
Net Promoter Score® (NPS) is used to help predict business growth, making sure you have a healthy relationship with customers who are likely to recommend your product to others.
NPS is calculated by subtracting the percentage of customers who respond to your NPS survey with a 6 or lower (aka Detractors) from the percentage of customers who answer with a 9 or 10 (aka Promoters).
When you run an NPS survey, you can:
Run an on-site survey that shows up directly on your website
Create a standalone NPS survey to share with your customers via email
Hotjar can help you with both and makes it easy to collect responses, store the results, calculate your final score, and share insights with your team.
How to fill the emotional gap left by NPS
Use Survey Logic to ask follow-up questions as part of your standard NPS survey. By asking customers why they've given a specific score, you can understand what you're doing well and where you can improve.
Track NPS and follow-up responses over time to create internal benchmarks and rally your team around one mission-critical objective: earning more enthusiastic customers.
4. Single Ease Question (SEQ)
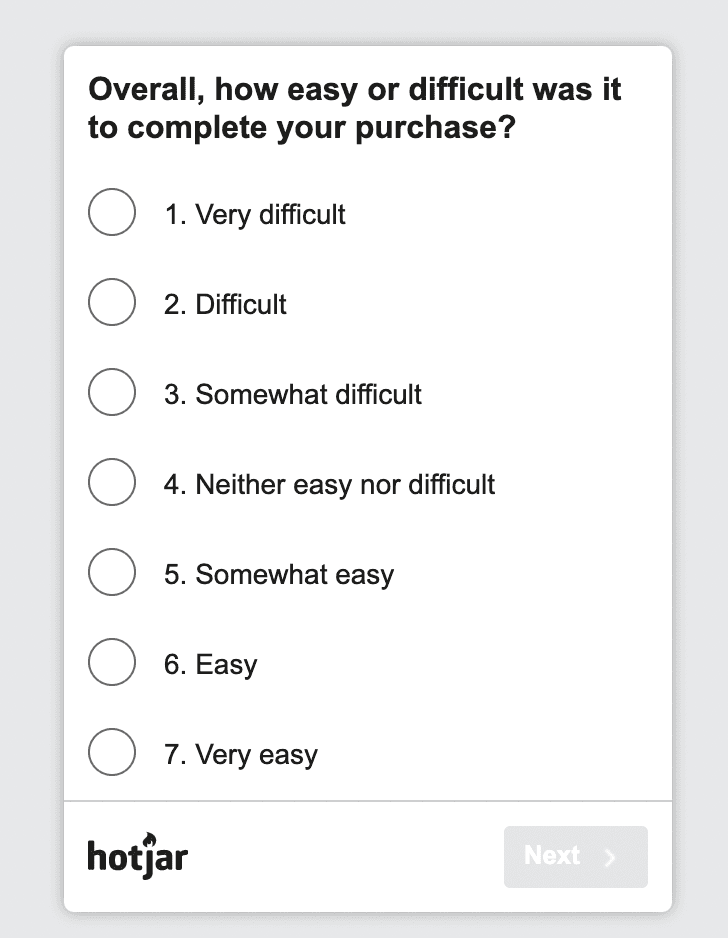
A Single Ease Question (SEQ) survey gives users a seven-point rating scale to rate the level of difficulty to complete a task on your site—for example, upgrading their account, subscribing to your service, or purchasing your product.
SEQ doesn't replace task completion or goal conversion rates, but if your product team finds it difficult (or impossible) to collect task completion data directly, you can estimate completion rates from SEQ scores.
How to fill the emotional gap left by SEQ
Hotjar's Incoming Feedback widget and on-site Surveys let you ask your users why.
Beyond a number-based rating, ask them why they found a particular task difficult (or easy) to get a full understanding of the user experience—and identify ways to improve it.
Build customer empathy within your teams
Use Hotjar's product experience insights and feedback tools to understand and learn from the people who matter most: your customers
5. Time spent on task
Time spent on task—aka task time or time on task—measures how efficient or productive a customer is when using your product. If your customers spend too much time on tasks in your product, it could mean an interaction or function isn’t properly designed.
Measuring time spent on task helps you:
Identify usability issues on your website or app interface
Define the difference between customer lag time and system lag time, especially when a customer sees time subjectively during task completion
Define granular metrics like average task completion time (focusing on measuring only successful completion) or mean time to failure (average time spent before giving up or finishing tasks the wrong way)
How to fill the emotional gap left by time spent on task
Session recordings can add context to time on task by showing you individual users’ journeys from page to page. See how they experience your site and how they behave on task—where they get stuck, distracted, confused, or frustrated.
💡 Pro tip
If you're using Hotjar, filter recordings by sessions that include rage clicks and u-turns, which can help you pinpoint the moment when a user gets stuck or frustrated.
How is a product experience metric different from a marketing metric?
Most marketing metrics—like MQLs, CAC, and CLV—tend to focus on customer acquisition: getting a customer’s attention, serving them throughout the funnel, then closing the deal.
Marketing funnels and optimized landing pages can tell us a lot about what leads a customer to a certain product or service, but it typically ends there: marketing metrics don't help you understand the subtleties of the user experience.
UX metrics add context to other business and marketing metrics, and connect them to human behavior and emotions.
Your product and UX team can work with your marketing team to connect your business’s Key Performance Indicators (KPIs) with data collection and metrics to help each team make better, more collaborative decisions.
Improve UX with product experience insights from Hotjar
Use Hotjar to understand how real users are experiencing your website or app—then improve it for them!