Learn / Blog / Article
How to spot and analyze rage clicks to understand customer behavior and improve UX
If you’ve ever been frustrated by an element on a website that doesn’t respond to your clicks (no matter how many times you try), you’re probably already familiar with the concept of rage-clicking—which is a good thing! Understanding your website visitors’ frustration means you can empathize with them.

When your visitors encounter usability issues, bugs, or broken elements on your site, you can use rage clicks as a tool to quickly identify what to change to give them a better experience. We show you how in this piece by covering:
What are rage clicks?
Rage clicks are when users repeatedly click (and click and click…) in a certain area or on a specific element of your website over a short period of time.
Knowing what causes them can help you optimize your page for conversions by removing pain points.Rage clicks typically signal user frustration with your website due to:
Poor page speed,
Confusion
Broken elements (broken links or buttons, as well as JavaScript errors)
Rage clicks can be detected during in-person usability testing or with behavior analytics tools like heatmaps and session recordings.
The bottom line is: mouse slamming from your customers is a likely sign that something is going wrong. Sometimes people click repeatedly out of habit, and we’ll talk more on this later. But usually, rage clicks indicate user frustration and are a symptom of something problematic on your site—like dead links, interactive elements that are broken, website bugs, or slowly loading pages—which can help you identify opportunities to improve the user experience (UX).
Rage clicks as a sign of poor UI and customer experience
Sometimes repeated clicks are about poor UX, and sometimes they’re not—which is why it’s important to understand what you’re looking for.
Like we mentioned above, some people ‘rage click’ out of habit as they read or scan a web page, and they’re not necessarily clicking out of anger or frustration. These clicks are what we call false positives.
Someone rage clicking on the title of a blog post about rage clicks: so meta.
But if your customer is having a bad user experience on your site—maybe because of poor design or a confusing user interface (UI)—rage clicks can reveal actionable insights on what the issue is, or invite you to dig deeper into the digital experience.
Putting rage clicks into context helps you see a broader picture and understand what’s really happening on your website. The easiest way to do it is by using a platform like Hotjar, as we show you below.
How to spot rage clicks at a glance with Hotjar Heatmaps
You can now easily pinpoint where users get frustrated on any page with rage click maps. Identify points of frustration, then reduce friction in your key flows to improve your UX design and boost conversion rates.
How to use rage click maps?
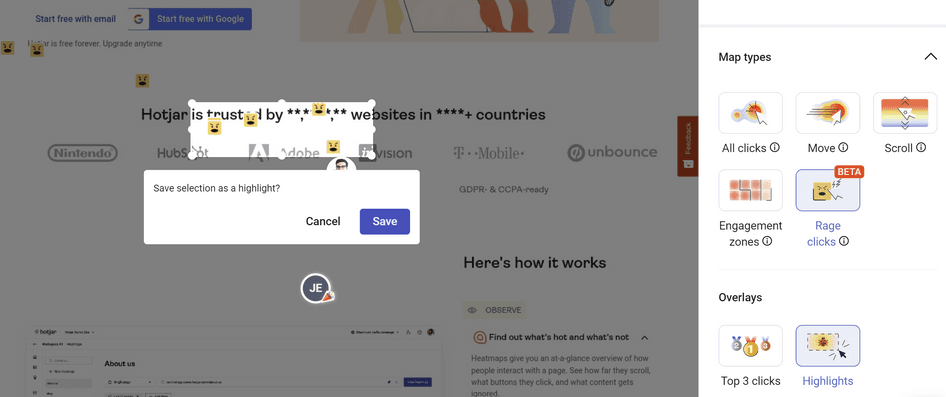
1. Toggle on the rage click map via the side panel in Heatmaps
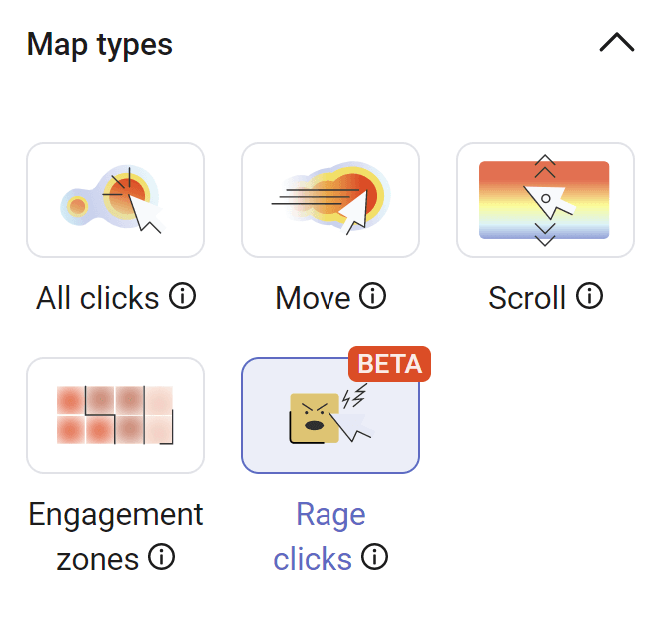
2. View the number of rage clicks and where they occur on the page.
3. Save Highlights to share with your team (optional)
4. Make changes to the user interface of the page to improve UX
How to use session recordings to investigate rage clicks
Session recordings (also known as session replays and user session recordings) are recordings of the actions taken by real visitors as they browse your site. They capture your users’ mouse movements, clicks, taps, and scrolls across multiple pages, giving you insight into how visitors react to, and interact with, elements and features of your website.
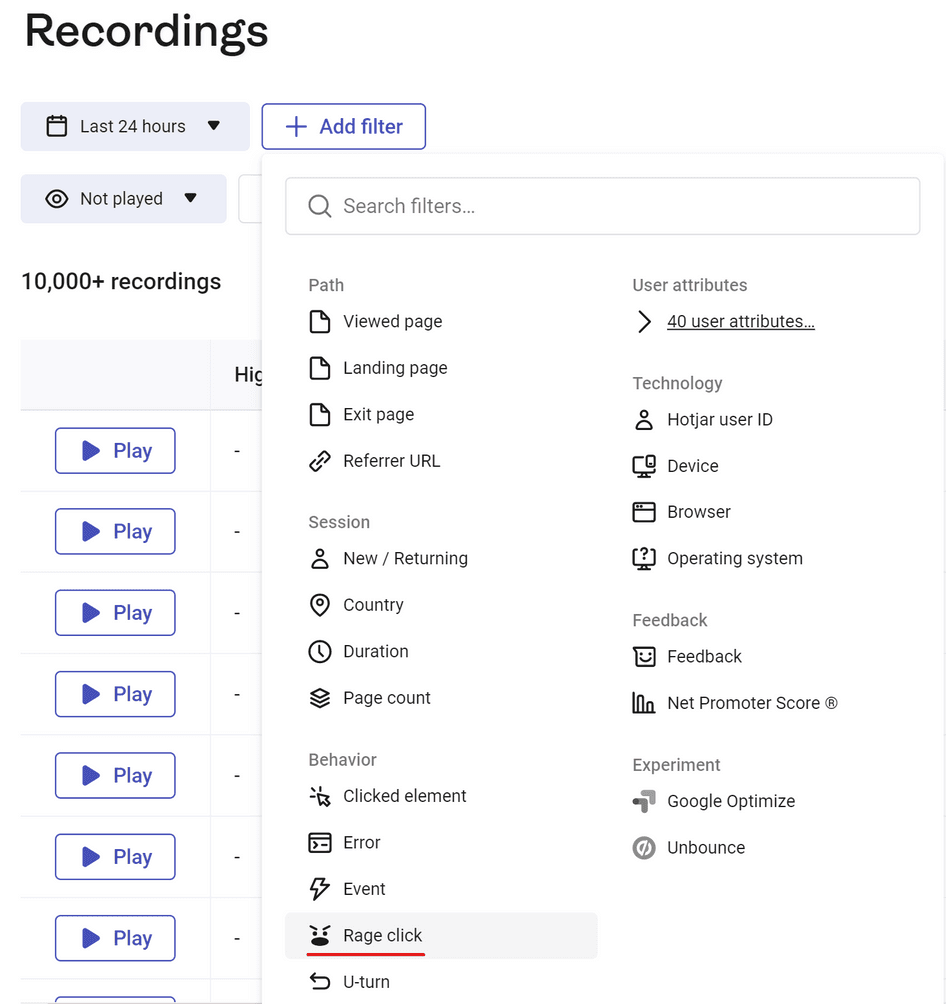
Using the rage click filter
When you use rage clicks as a filter in Hotjar Recordings, you can pinpoint the moment a user was repeatedly clicking on an element or area of your site (rage click events)—which will help you identify which areas to optimize and improve the customer experience.
Using rage clicks to improve UX: an ecommerce example in 2 steps
Let’s say you’re noticing an increase in abandoned carts and exit rates on your ecommerce checkout page thanks to Google Analytics or Hotjar Funnels, and want to see what’s happening so you can figure out why people aren’t completing their purchases.
You turn to session recordings so you can see how people are using your site, and more specifically, what they’re experiencing on the checkout page:
1. Filter your recordings by URL to view only those visitors who went to the checkout page
After doing some user recordings analysis (defining goals and metrics, dedicating focused time to watch and take notes, and tagging or highlighting your recordings to share with your team), you’re ready to get even more specific:
2. Filter your recordings even further to view only those visitors who rage clicked on the checkout page
When you watch and analyze recordings of people rage-clicking on your checkout page, you gain visibility into your users’ pain points—maybe a key element is broken, they can’t choose their payment method, or can’t update their billing or shipping details.
Sharing your findings with your team puts you in a good position to collectively decide what action to take to reduce those rage click events: fix dead links, broken or missing elements, and other bugs or issues on your site to improve the checkout experience for your users.
Note: we recommend that you experiment with different recordings filters to help you pinpoint issues that need to be fixed for your users.
As we mentioned before, rage clicks help you identify problems right away—but they alone often won’t reveal the whole issue, and are just one of many tools that’ll help you dig deeper into the customer experience.
Using the error filter and console tracking
You can also combine rage clicks with other filters.
The error filter lets you watch recordings of user sessions that displayed a JavaScript error. With the console tracking functionality enabled, you can start tracking those errors—which are often the source of rage clicks—directly in the console as you watch the recordings.
Using the error filter and console tracking to spot rage clicks resulting from errors
Going back to the example of our underperforming ecommerce site, you can also check whether JavaScript errors occur on your precious checkout page, preventing (some) users from finalizing their purchase:
1. Filter recordings by ‘Viewed page’ to include only recordings where the user visited the checkout page
2. In addition to the rage click filter or not, filter by ‘error’ > Occurred
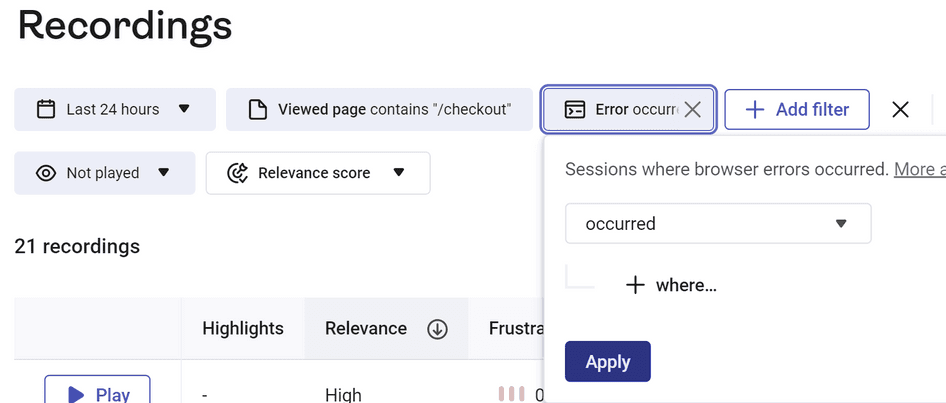
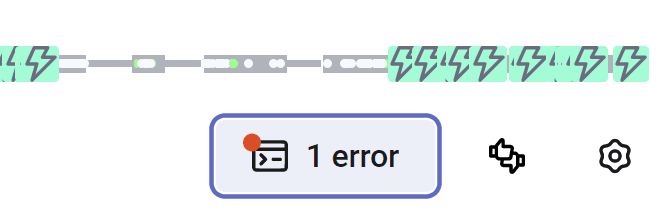
3. Watch the recordings and open the console (on the right, at the bottom)
4. Share the recording with your tech team with the Slack or Microsoft team integration
Using the feedback filter
You can use recordings together with Feedback to find users who rage clicked and left feedback, which usually indicates user frustration due to broken or confusing elements on your site.
Digging deeper into the customer experience
If you’ve got thousands of Hotjar Recordings, it’s rare that rage clicks alone will show you all of the issues your users may be experiencing. Rage clicks are signals of what may be aggressive or frustrated user behavior, but to get the full picture it’s better to focus on patterns, and treat them as part of a larger effort to understand and improve the customer experience.
Once rage click maps and session recordings have given you an understanding of your users’ traffic patterns so you can identify where they’re getting stuck, filter recordings by page (or a set of pages), and add frustration filters like rage clicks and u-turns.
What are your website visitors’ clicks trying to tell you?
Sign up for a free Hotjar account and start learning from your customers today.

Related articles

UX design and analysis
Design a homepage that delights your users in 9 easy steps (with tips and examples)
While product, UX, and marketing teams help shape a website or app’s homepage, a more powerful group holds the reins: the users. Their needs and preferences are key deciding factors in locking in an effective homepage design.

Shadz Loresco

UX design and analysis
The anatomy of a stellar website: the dos and don’ts of design
Over the past five years, buyers have largely shifted their shopping habits to be primarily online. For brands wishing to remain competitive in the digital marketplace, this means an accessible and attention-grabbing website has become more important than ever before.
Consumers agree: respondents to Hotjar’s Coming in Hot report told us that they have higher expectations for brands’ websites than they did five years ago.

Hotjar team

UX design and analysis
Coming in hot: the power of first impressions
Consumers have more than their fair share of vendors to choose from when shopping online. When attention is split between different brands and devices, ensuring your online presence stands out from the crowd hinges on first impressions.
But catering to the ever-changing habits and preferences of digital buyers is no small feat. That’s why Hotjar surveyed hundreds of US-based consumers—to reveal the insights you need to guarantee your website exceeds user expectations.
Hotjar team