Learn / Guides / Web analytics guide
How to audit and improve any web analytics setup in 3 steps
Web analytics data helps you report on your success and spot ways to improve website performance and experience—but you need to be able to trust it.
Luckily, you can verify your existing setup's relevance, accuracy, and compliance (and identify areas for improvement) with a web analytics audit.

A web analytics audit is a comprehensive review of your web analytics strategy and the data collected on a website. You can audit a single tool, multiple tools together to ensure data flows between them, or your whole analytics stack at once. Ultimately, these audits help you improve data quality to build a better website experience and attract and retain more customers.
This guide takes you through the steps you need to take to run a web analytics audit.
We’ll help you make sure you’re tracking what you need, collecting data accurately, and complying with relevant privacy regulations. Plus, we’ll throw in a handy checklist to keep you on track.
Go beyond traditional analytics with Hotjar
Hotjar helps you measure the ‘what’ and the ‘why’ of your product’s performance so you can grow by putting customers first.

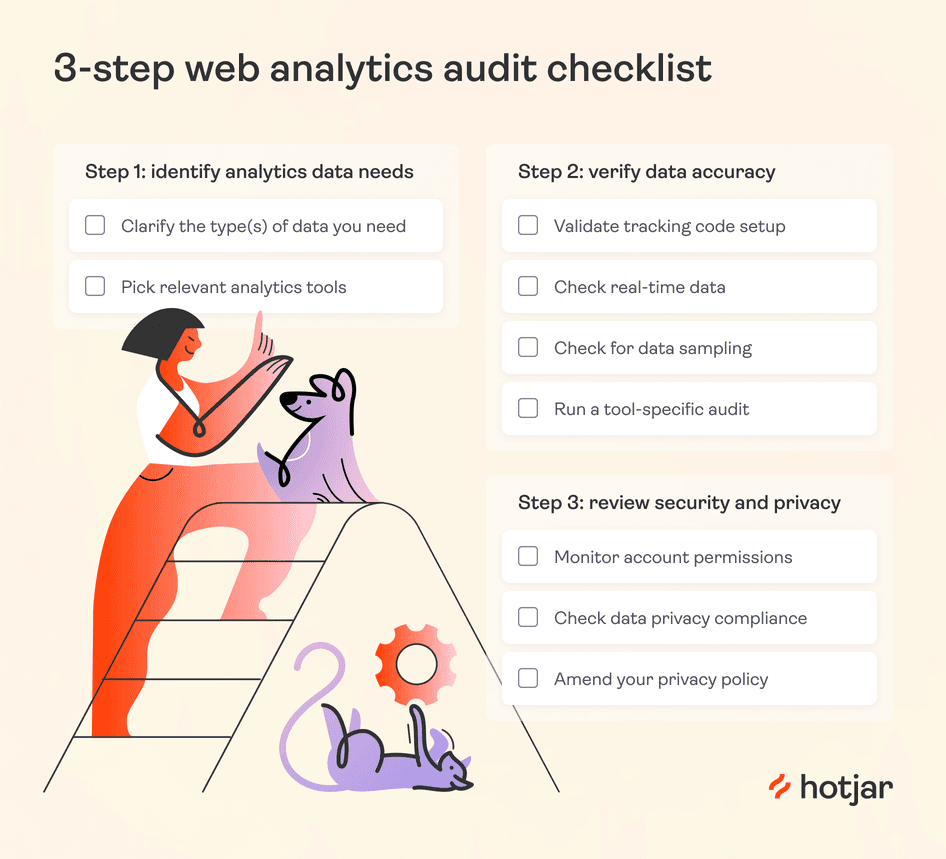
Web analytics audit checklist
Running a web analytics audit helps you
Make sure the right data is being collected
Identify and fix tracking and reporting errors
Collect data securely and in compliance with current privacy regulations
Make stronger data-driven business decisions
Improve product experience (PX), user experience (UX), and conversion rate optimization (CRO)
Download the checklist below as a framework for your next web analytics audit, and keep reading for more detailed instructions and tips.
How to run an analytics audit on your website
Whether you’re auditing an existing website or launching something new, this three-step guide will help you clarify what analytics data to collect, verify data is being tracked accurately, and comply with security and privacy regulations.
Step 1: identify analytics data needs
You can track almost anything on your website—but that doesn’t mean you should! Unlimited data collection is costly, overwhelms your team, and makes it hard to find relevant signals among the noise. It could potentially even slow your website down and affect user experience.
On the other hand, not collecting enough data (or collecting none at all) results in missing out on important insights that could help you improve UX, increase conversions, and make business-critical decisions. The Goldilocks answer is to collect whatever’s just right for your business. Here are some ways to achieve that.
Clarify the type(s) of data you need
Most teams and companies have key performance indicators (KPIs) and metrics they influence. For example, a marketing team might want to increase social media referrals by a specific percentage, a support team might try to cut its first-response time in half, and a product team might actively work toward reducing churn.
Whatever your KPIs, make sure your analytics tools help you collect the right mix of data to diagnose the situation, inform experiments and improvements, and measure progress over time. To do this, you need two types of data:
Quantitative or numerical data that helps you track and compare website performance over time (e.g. conversion rate, CTA clicks, and pageviews)
Qualitative data that helps you understand why customers behave in a specific way (e.g. session recordings and customer feedback responses)
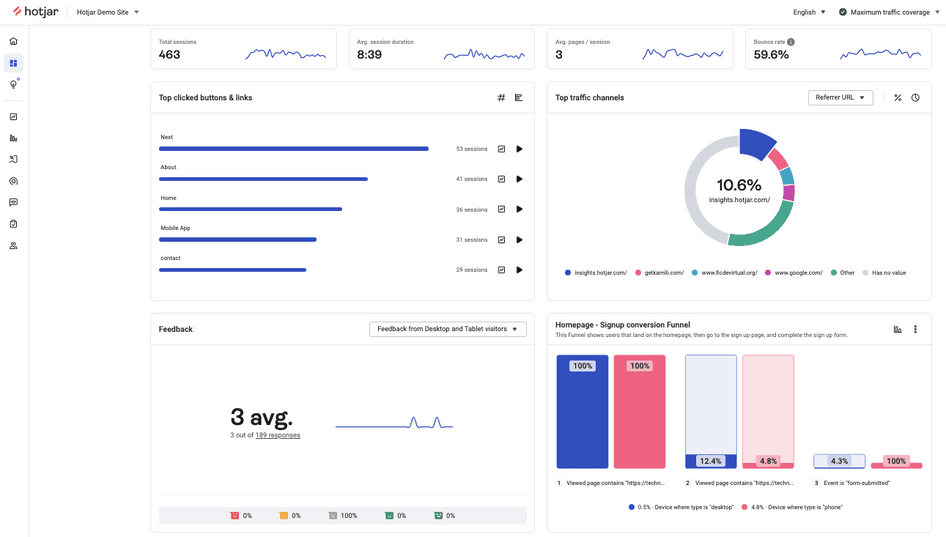
Combining qualitative and quantitative analytics data in the Hotjar Dashboard
Back to the churn example: to influence this KPI, you obviously need to measure churn rate in the first place and compare its evolution over time. But you won’t know why users churn unless you ask them, which is where qualitative data from a user survey can help.
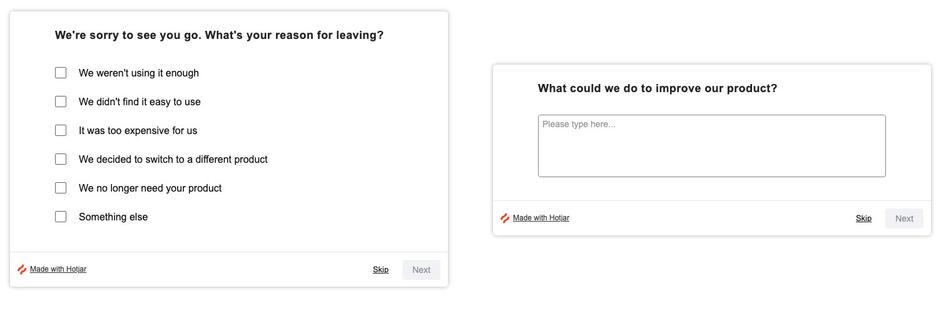
A Hotjar churn survey to find out why users unsubscribe
Similarly, bounce rate in Google Analytics 4 shows the percentage of visitors who aren’t engaging with a page (defined as a session lasting fewer than ten seconds, with one pageview, and no conversion events). But you can only guess why people bounce—unless you investigate the situation qualitatively. You could do this by triggering an exit survey, looking at heatmap patterns, or watching session recordings to see what visitors did before leaving.
Pick relevant analytics tools
There are thousands of web analytics tools you could use, but you'll probably find a combination of two or three enough to report on the KPIs and metrics you need to track.
For example, you can choose
A traditional web analytics tool like Google Analytics, Matomo, or Adobe Analytics to track cross-domain performance such as landing page traffic, Google ad conversions, traffic attribution, and demographic data
A behavior analytics platform like Hotjar (that’s us, hello! 👋) to measure user behavior and feedback with tools like Heatmaps, Recordings, and Surveys
A subscription analytics tool like Baremetrics or ChartMogul to track product metrics such as annual run rate (ARR) and user churn
An ecommerce tracking tool like Shopify Analytics to monitor online sales, top digital marketing channels, and checkout conversions
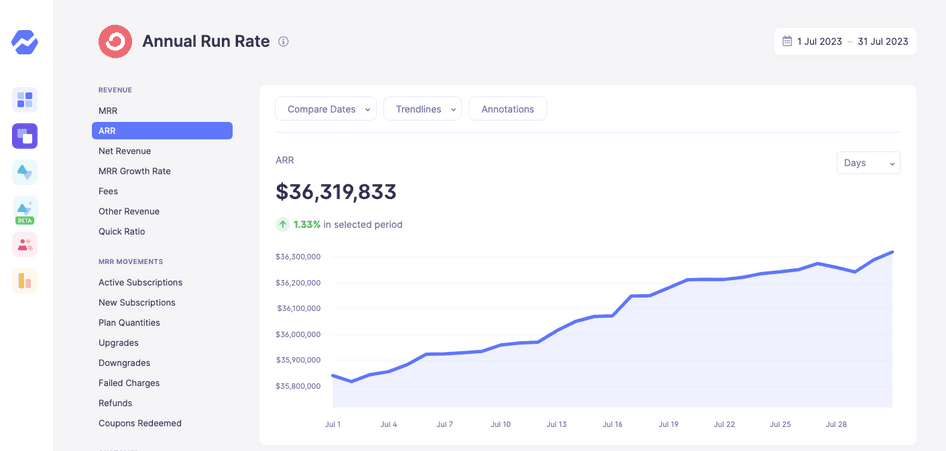
ConvertKit’s ARR tracked in Baremetrics
Step 2: verify data accuracy
Now that you know what data you need and you’ve picked the analytics tools to collect it, it’s time to check if everything’s working as intended.
Validate tracking code setup
All digital analytics tools have tracking code (usually JavaScript) that must load on every page you want to track. If your code isn’t added or triggered where you need it, your data will have holes that could skew reports.
Poor implementation and incorrect use of tracking codes can create all sorts of bugs that skew your data. Being aware of this and regularly testing your setup is really important.
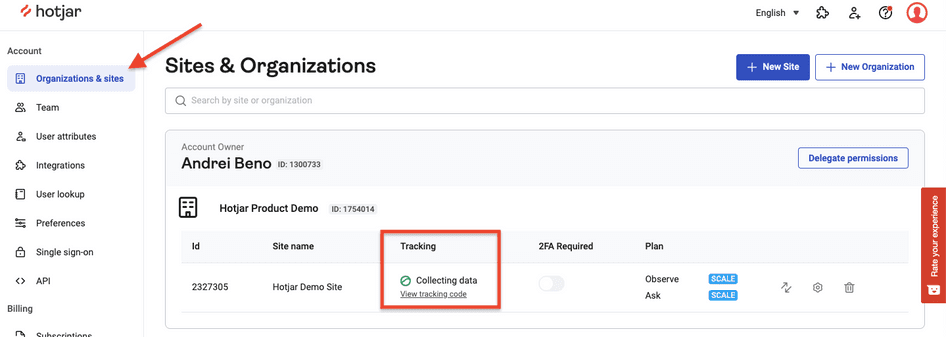
Most analytics tools will help you verify that your domain is being tracked. If you’re using Hotjar, you’ll see if your tracking code is collecting data in your Account settings under Sites & Organizations.
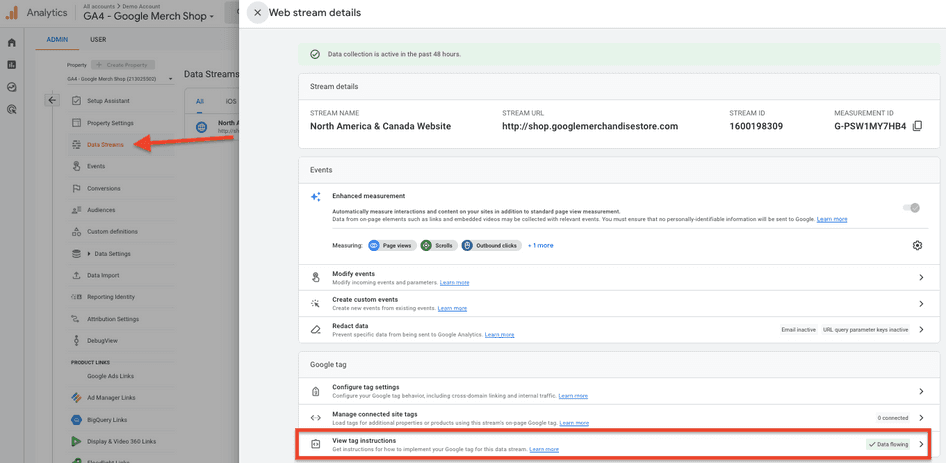
In GA4, you’ll find a similar setting in the Data Streams section of your property: a ‘Data flowing’ tag appears under ‘View tag instructions’ if you’ve added the Google tag correctly.
💡 Pro tip: sometimes, people working on your website will accidentally remove code (we’ve all been there!), and tool updates may change how data is reported. It’s important to double-check your tracking setup as soon as you notice any anomalies in your reports.
“Think deeply about whether any big jumps or drops in performance are genuine. If something seems too good—or bad—to be true, the cause can often be found in the tracking setup for the analytics tools you’re using.”
- Sean Potter, Senior Content & SEO Strategist, Hotjar
Check real-time data
A quick way to check if an analytics tool is working is to load your website in a private window (without blocking cookies or scripts) and see if your visit gets recorded.
In Google Analytics 4, go to Reports > ‘Realtime’ to see a map of recent users.
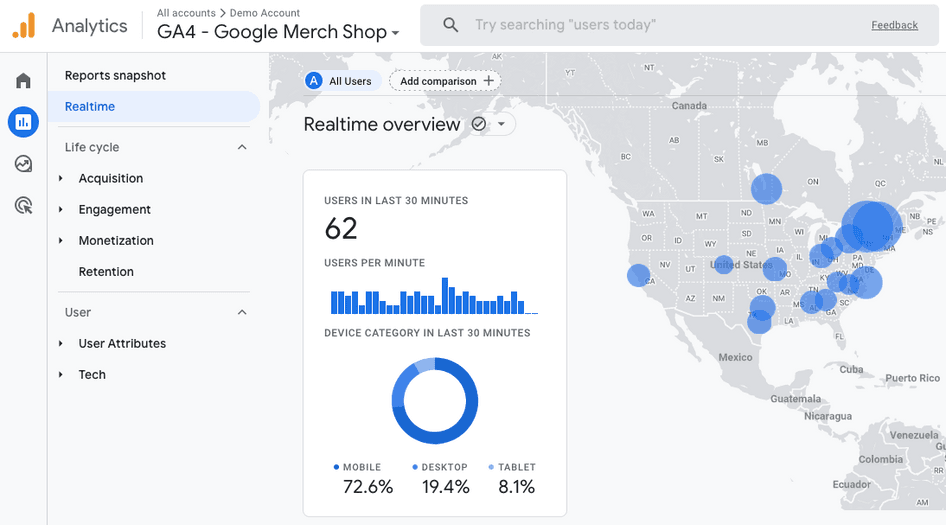
Real-time visitors on the Google merchandise store homepage
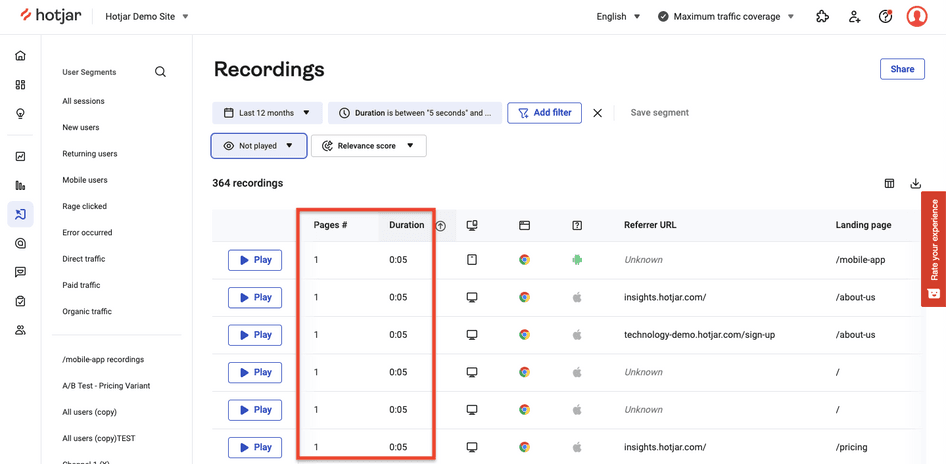
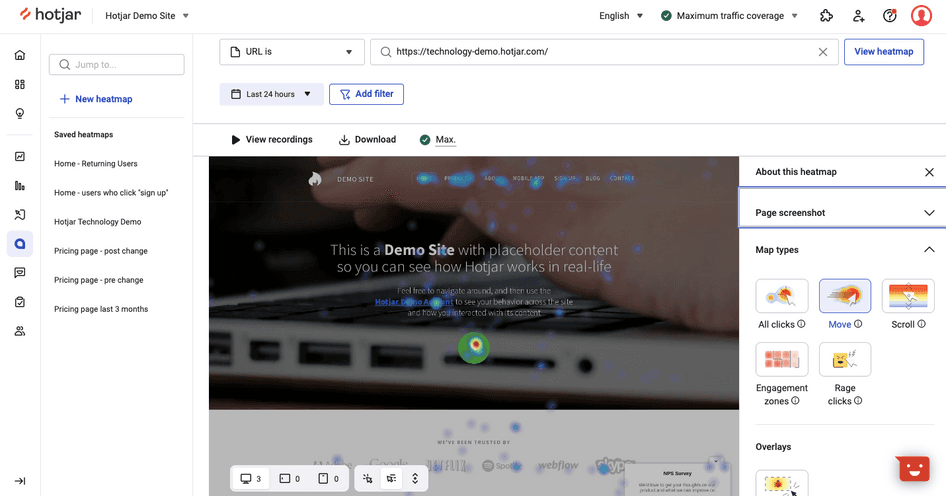
In Hotjar, you can’t view real-time visitors, but heatmaps and session recordings get populated as soon as people visit your website. If you have lots of traffic and things are working correctly, you’ll start seeing clicks within a few minutes.
Check for data sampling
Many web analytics tools have a sampling limit. This means that after a certain threshold, your reports will not include all traffic you received, potentially misrepresenting site performance.
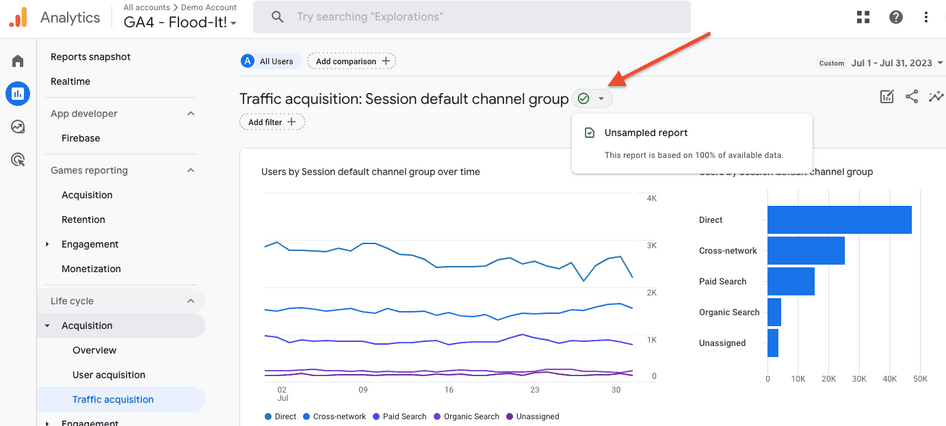
For example, in Google Analytics 4, there’s a quota limit of 10 million events/month for free users. Every report you generate is tagged with a sampling icon—a green check mark means you’re viewing an unsampled report.
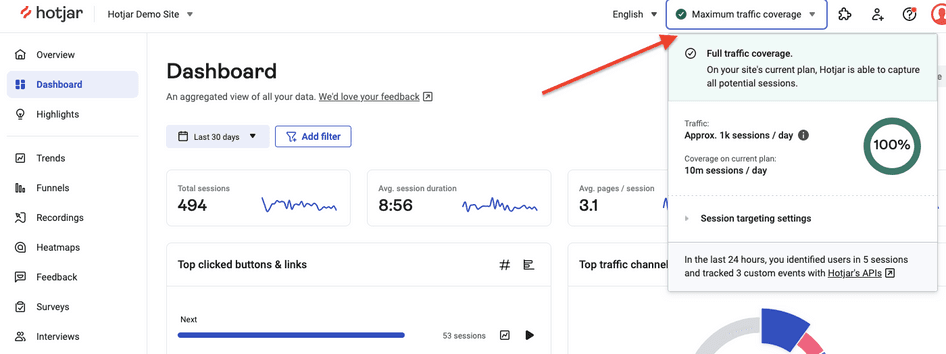
In Hotjar, you’ll see a traffic coverage alert in the top menu bar—‘maximum traffic coverage’ means you’re capturing all possible sessions. If you do need to rely on sampled data, Hotjar samples traffic evenly throughout the day to provide a more accurate picture of user behavior.
💡 Pro tip: no analytics tool can track 100% of visitors because some opt out of tracking entirely or block cookies and JavaScript, so their behavior can’t be recorded. That’s why it’s important to collect qualitative insights (e.g. via a post-purchase email survey) that can rebalance the missing numerical data.
Run a tool-specific audit (e.g. a Google Analytics audit)
If you’re using complex tools to track and report on your progress, you will likely need to run a tool-specific audit to ensure your settings aren’t skewing data.
For example, if you’re using Google Analytics, use a third-party service or tool like Verified Data to run an audit or follow a GA4 checklist like the one below to check that Google Analytics and Google Tag Manager are set up correctly.
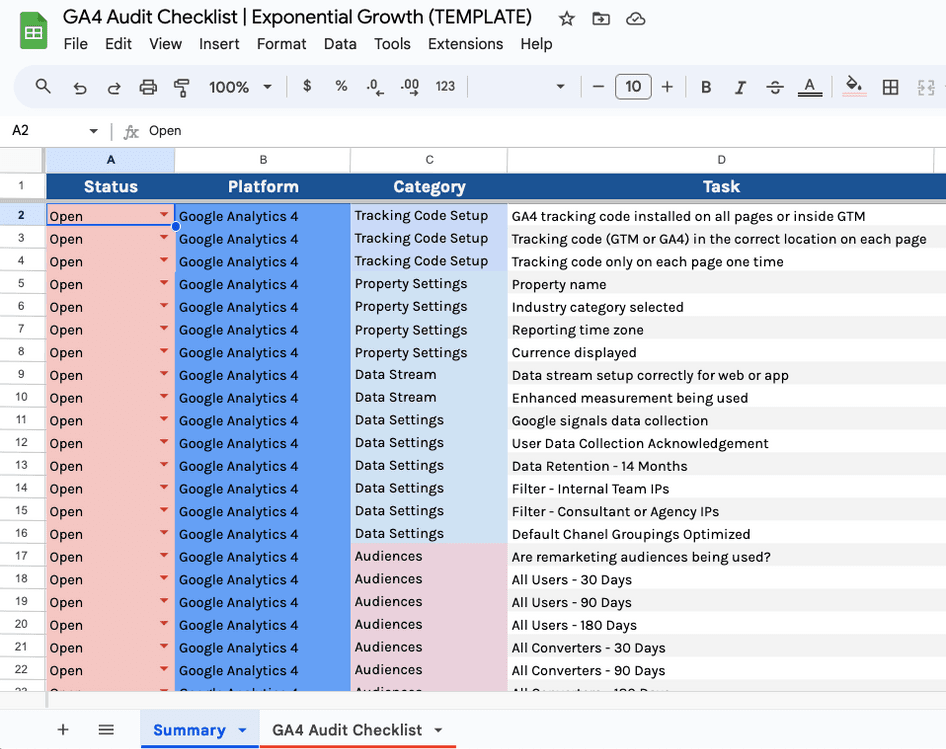
A free GA4 audit template created by John Reinesch
💡 Pro tip: if you use Google Analytics for ecommerce, check that your ecommerce events are set up correctly and use Google’s sample ecommerce store to see how your products should be tagged.
Step 3: review security and privacy
Reviewing security and privacy during a web analytics audit helps you protect user data and ensure compliance with applicable laws and regulations. Here are some things to keep in mind.
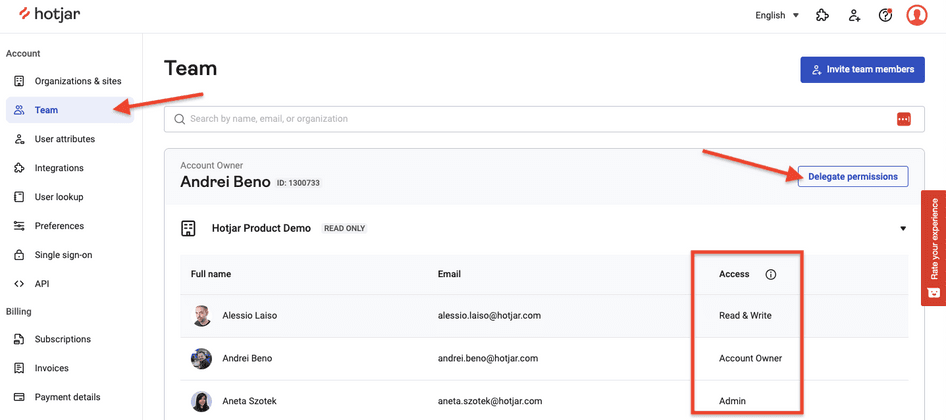
Monitor account permissions
Check the account permissions in all your analytics accounts and ensure only necessary users have access to the data they need—look out for former teammates, agencies, or freelancers that need removing.
In Hotjar, you can add unlimited team members to any account and assign different permissions to each: Account Owner, Admin, Read & Write, or Read Only access.
Check data privacy compliance
Many analytics tools collect and store some form of personally identifiable information (PII) such as IP addresses, email addresses, and customer names or use tracking technologies like third-party cookies. Check you’re managing data in compliance with applicable regulations, including
GDPR (General Data Protection Regulation), which regulates how you manage personal data from all EU (European Union) users
CCPA (California Consumer Privacy Act), which regulates how the personal information of residents of California, USA, is collected, stored, and used
LGPD (Lei Geral de Proteção de Dados), which regulates how you process the personal data of residents of Brazil
Check your analytics tools for compliance controls. For example, Hotjar has compliance features like User Lookup to view and delete any data associated with a user, and obtain opt-in consent before connecting behavior data with survey responses. Keystroke data is also automatically anonymized on the end-user’s side, so it never reaches our servers (see image below).
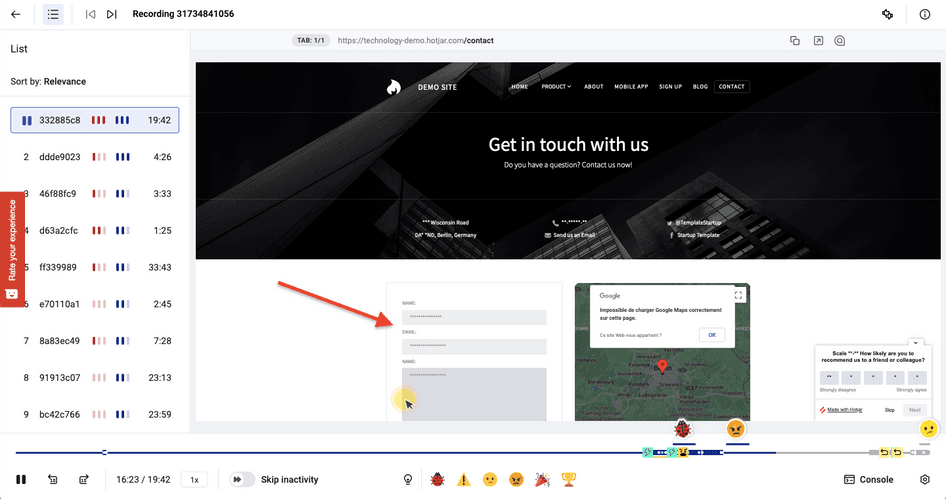
I was happy to see that Hotjar had options for suppressing things like credit card numbers, so I reassured the client that in addition to suppressing keystroke data with a single click, we could apply this same treatment to specific elements of their webpage as needed.
In Google Analytics 4, IP addresses are no longer collected, and you have the option to disable certain data collection features using Google’s privacy controls.
Amend your privacy policy
Whenever you make changes to your analytics setup, review the language and content of your privacy policy to ensure it accurately reflects how user data is collected, stored, and used. Take a look at our Privacy Policy and cookie list as an example.
When to run a web analytics audit
As a general rule, run an analytics audit every time you or your team
Launch a new website or subdomain
Roll out major changes or a redesign
Change your business objectives
Add or remove analytics tools
Since website technologies and server software are updated frequently, it’s a good idea to make analytics audits a regular activity to ensure your data remains accurate.
One common mistake I’ve seen during my career is companies don’t look regularly enough at their existing web analytics setup. When you’re trying to identify ways to add your existing setup, you should also be checking the accuracy of what you already have.
Put your analytics data to work
Regularly auditing your web analytics setup using the above steps will give you reliable data about what’s happening on your website and, if you’re using a platform like Hotjar, why.
But data alone won’t help your business grow—you need to put it into action to make improvements. Use your reliable, audited data to identify what users love and improvements they might need, and you’ll have a clear roadmap for growth that pleases both your customers and your business.
Go beyond traditional analytics with Hotjar
Hotjar helps you measure the ‘what’ and the ‘why’ of your product’s performance so you can grow by putting customers first.