Learn / Guides / Behavior analytics guide
Master behavior analytics with this simple 7-step checklist
Behavior analytics shows how customers experience and interact with your website or product. It reveals what users care about, what they need, and what they struggle with, forming the foundation of impactful product improvements.
Standard web analytics tools, like Google Analytics, provide valuable information about users but ultimately paint an incomplete picture of them. These tools tell what users do—but not why.

Behavior analytics bridges the knowledge gap standard web analytics tools inevitably create. This method tracks actions traditional tools don’t (or don’t share with you)—things like:
Mouse movements
Clicks and taps
Scrolling
Navigation through your website
We bet you’re itching to get started right this second. But before implementing behavior analytics methodology effectively, there are a few things you need to know. This guide presents you with a step-by-step behavior analytics framework to help you put your customers at the heart of your business and give them a user experience (UX) they’ll love.
Behavior analytics tools that put you inside your users’ heads
Use Hotjar to understand how real users are experiencing your product, website, or app—then improve it for them!

Benefits of behavior analytics
The field of behavior analytics has matured into a robust method for online marketing professionals and product managers whose work is impacted by user behavior. Analyzing user behavior allows them to create better products and market them more effectively.
We could go on and on about behavior analytics advantages—in fact, we already did, in our intro to behavior analytics. But it’s worth revisiting the four main benefits of data-driven behavior analysis:
See what stops users from taking action, so you can make informed decisions about how to remove these obstacles and encourage users to navigate your site or product the way you intended.
Understand what users pay attention to, ignore, and get distracted by, so you can pinpoint which parts of your product or website are the most engaging and where it could use some improvements.
Get in-the-moment feedback, so you can respond to user needs and concerns in real-time, spotting issues as they arise and ensuring your users have a fantastic experience.
Get buy-in for change, using data to support your proposed changes and easily convincing stakeholders to support your ideas. Plus, you can keep employing behavior analytics to show the impact of your changes and get even more support.
Behavior analytics: your 7-step plan of action
Ready to reap the rewards of behavior analytics? Here’s your step-by-step guide to collecting, tracking, and analyzing user behavior.
1. Set your goals
The likelihood of success is always significantly higher when you set goals, so it’s crucial to clearly define what you’re trying to achieve with your user behavior analysis.
Once you’ve set your goals, you’ll be able to choose the key performance indicators (KPIs) that will guarantee the success of your analysis.
For example, if your goal is to improve customer satisfaction, your KPIs might be:
Customer retention rate
Number of customer support tickets
Customer experience (CX) survey scores
If your goal is to increase revenue, one or more of the following KPIs can help you analyze your success:
Conversion rate from visitor to free user
Conversion rate from free user to paid customer
Free user or paid customer churn rate
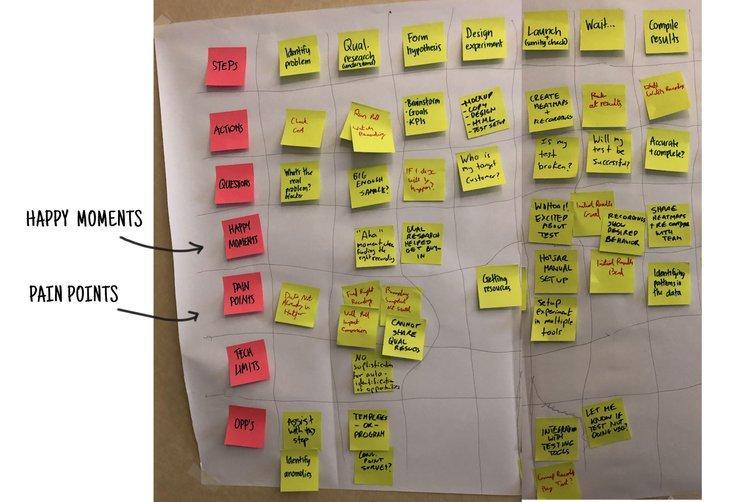
2. Map customer journeys
It often takes a lot of interactions, or touchpoints, with your product before a first-time visitor becomes an actual customer. We call this the customer journey, and during this journey, your users experience all kinds of emotions: happy moments, pain points, and everything in between.
By creating a customer journey map, you put yourself in your users’ shoes, which allows you to empathize with them and visualize their motivations.
Examples of touchpoints could be an online ad, an online form, a video, or a blog post. A point of exit, where a visitor leaves your website or app, is also a touchpoint. Once you’ve established the journeys your users take, you’ll have a deeper understanding of their pain points and your areas for improvement.
3. Collect your data
Now, it’s time to determine which data you want to analyze. You’ll be especially interested in events: actions users take at certain touchpoints in their customer journey. Some of these events could be:
Clicking an online add
Filling out an online form
Watching a video
Subscribing to your newsletter
Leaving your website
You’ll also have to decide which sources to pull these data from. Various tools help you track events: Google Analytics is a common source, but digital experience and behavior analytics tools like Hotjar let you track custom events and set up triggers to see why a user took a specific action.
This way, you’ll understand the cause for the user activity, whether clicking a call-to-action (CTA) button or abandoning your site at checkout.
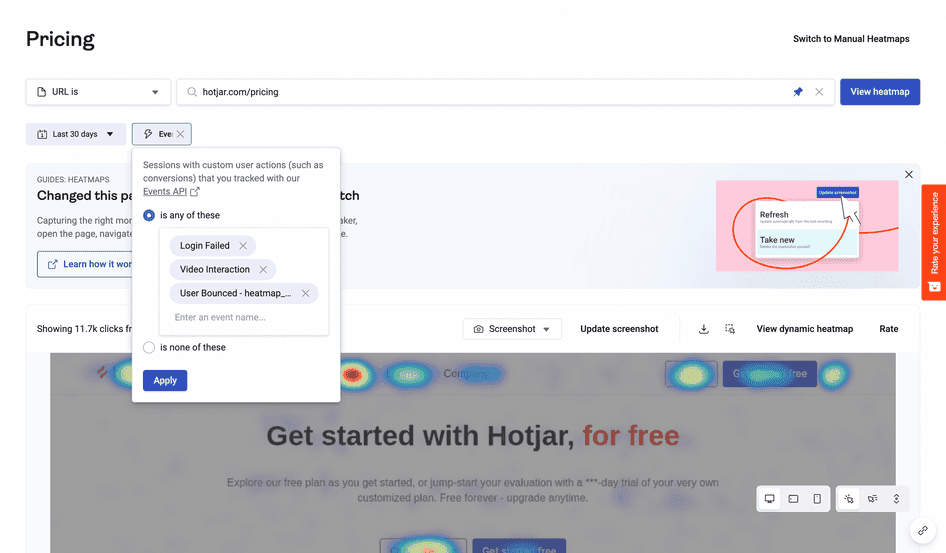
🔥 3 Hotjar tools you can use to track and analyze events
Trigger Hotjar’s tools to start capturing data when a custom event fires or filter your insights based on relevant events.
Heatmaps, which show where users are clicking, scrolling, and hovering on your website: filter your heatmaps based on key user activity
Session recordings, which capture a video of a user's session on your website, including their clicks, scrolls, and mouse movements: trigger a recording when a user takes a specific action
On-site surveys, which allow users to rate their experience on your website or provide feedback on specific pages or features: trigger a survey when a custom event fires
Extra reading: learn more about configuring Hotjar Events
4. Analyze your data
Analytics need some time before they tell you a story. Let one or two weeks pass so you have enough data to track and analyze.
Focus on the questions you asked yourself when setting your goals in step 1: how can your data answer these questions? Then, compare the tracked events with the customer journeys you mapped out. Are there behavioral patterns that indicate friction points? Alternatively, are there successes that can be replicated elsewhere?
🍳 The breakfast routine that decreased checkout abandonment by 86%
Porridge, a smoothie, and Hotjar Recordings make up the remarkable breakfast routine of Andrew Haehn. This Operations Director starts his day with 20 minutes of screen recordings of visitors interacting with the Materials Market website.
One morning, Andrew spotted a problem in their checkout process. “People were obviously getting confused. There were too many steps in the checkout process,” he said. A few simple tweaks to Material Market’s checkout process brought big business gains.
Before: one in four shoppers abandoned their shopping carts.
Now: only one in 25 customers leave their carts.
Curious to see how Andrew did this—and how you can replicate these results? Check out the full case study.
5. Implement changes
This step is all about taking action based on your insights. Once you've gathered data on user behavior, it's time to identify areas where you can make improvements.
For example, you might notice users dropping off on a particular page or struggling to complete a certain task. These insights help you identify concrete areas where changes are needed, from something as trivial as a button text tweak or title rewrite to major changes like a UX design overhaul.
When you’ve established changes you want to implement, test them against the original version by running A/B tests. A/B tests or split tests randomly assign real users one of two versions of your web page. This gives you a direct comparison of new vs. old, so you can determine which one is more effective and have 100% confidence in your data-driven decisions.
🧪 5 tips to enhance your A/B tests with Hotjar
Hotjar is a fantastic complement for A/B testing, integrating with popular tools like Google Optimize, Omniconvert, and Optimizely. Here’s how to get started with A/B testing in Hotjar:
1. Define your hypothesis
Before you start running A/B tests, have a clear hypothesis that outlines what you’re doing and what you’re hoping to achieve. For example, you might want to test UI design tricks like changing the color of a button to see if it will increase click-through rates (CTR).
2. Set up Hotjar as a complementary tool
Combine the power of Hotjar's user behavior analytics with the precision of A/B testing tools. Integrate Hotjar with your A/B testing tool of choice, or set up Hotjar to monitor A/B tests.
3. Monitor your results
As users interact with your A and B versions, monitor your results closely and keep track of metrics like click-through rates, bounce rates, and conversion rates.
4. Analyze your data with Hotjar's tools
Once you've gathered enough behavioral data, examine your results and determine which version is more effective. Hotjar provides a range of tools to help you do this effectively. You can:
Show a feedback widget or survey on a variant
Compare heatmaps on your control or variant
View session recordings of users exposed to a variant
5. Implement your changes
You’ve settled on the most impactful changes, so it’s time to push them live. Whether you're tweaking some text or revamping your design, an effective A/B testing methodology leads to better user experiences and higher conversion rates.
6. Measure the results
Now that you've implemented your changes, it’s time to see whether they're having the desired impact.
You might look at key metrics like CTR, bounce rates, and conversion rates to determine whether your changes result in increased engagement and revenue. For example:
If you've changed the copy on a CTA button, measure the CTR to see if the new copy is more effective
If you've rearranged the layout of a page, measure the bounce rate to see if users are spending more time on the page
📊 Dive deeper into your results with Hotjar
Leverage Hotjar's suite of tools to gain even more insights into user behavior. Set up surveys or conduct user interviews with Hotjar Engage for qualitative feedback from your users, and analyze their experiences to identify areas for further improvement.
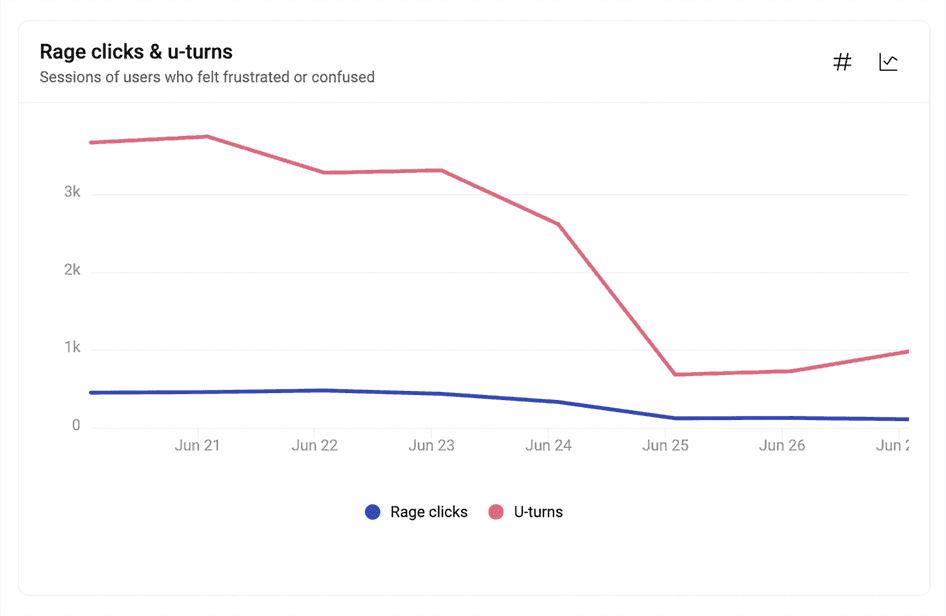
Try Hotjar Trends (available on our Observe Scale plan) to visualize your user behavior insights, track changes in key metrics over time, and identify behavioral patterns or trends in user behavior.
Finally, good ol’ Hotjar Heatmaps and Recordings let you see exactly how users interact with your site or app and identify areas for further optimization. These tools, in conjunction with your own analytics data, give you a more holistic understanding of how your changes impact user behavior and the overall UX.
7. Repeat and iterate
Improving the user experience and giving your users a voice is not a one-time event: the economy changes, demographics shift, and user preferences evolve. That's why behavior analytics—and the actions it inspires—should be an ongoing process, taking you from one iteration to the next.
To keep your marketing and product strategies current, continue analyzing user behavior, running A/B tests, and gathering feedback from your users. This way, you’ll identify new areas for improvement and continue optimizing your user experience over time. Remember:
Using behavior analytics to continuously improve your strategy
There’s a wealth of behavioral data that you can collect from website visitors and users, helping you piece together a puzzle that answers questions like:
What catches users' interest, and what do they ignore?
Where on your website or app do users encounter difficulties or get stuck?
What actions do users take just before leaving your website or app?
What are users searching for or not finding on the pages they visit?
By using the 7-step plan in this chapter, you answer these questions and more. And with this knowledge, you’ll learn how to create customer delight, encouraging more people to interact with your business again and again. Ultimately, improving the user experience is the key to hitting your business goals.
As the online landscape changes, businesses using behavior analytics will be more likely to keep up and thrive. But remember, it’s an ongoing effort, and standing still is going backward.
Use behavior analytics to improve your product or website
Use Hotjar to understand how real users are experiencing your product, website, or app—then give them exactly what they want!