Learn / Guides / Data analysis for marketers
Data analysis: the definitive guide for marketers
Data analysis lets you uncover exactly where, when, and why people interact with your brand—so you can optimize your marketing campaigns and improve the user experience (UX).
But with thousands of data points from dozens of sources, how do you best make sense of everything to inform your marketing plan?

You don’t need a degree in data science or statistical modeling to interpret data. With a little data analysis know-how, you can better understand and relate to your users.
We start this guide with what data analysis is and its role in marketing. You also learn how data analysis helps you build empathy for your target customers, and four data skills every leading marketer needs to give users the experience they expect and deserve.
TL;DR
Data analysis involves inspecting, preparing, evaluating, and organizing information to make sense of it. In marketing, you identify patterns and trends that reveal new insights about your prospects, and highlight ways to improve their experience with your product and brand.
Data analysis helps you empathize with target customers so you can
Understand the buyer’s journey
Create compelling messaging and content
Improve your website’s user experience
Every marketer needs these data analysis skills:
Critical thinking to evaluate information and avoid bias
Basic technological proficiency to get the most out of data analysis tools
Visualization and reporting to decide the most effective way to display data
Communication to share findings with team members
What is data analysis and its role in marketing?
At its core, marketing is about getting to know what customers want and need, and applying these understandings to create the right campaigns and experiences for them.
What’s the best way to determine what prospects want and need? Collecting and analyzing data.
Data analysis is the process of examining, cleaning, interpreting, and modeling raw data to turn it into actionable insights.
And there’s no shortage of raw data to collect and interpret:
Customer demographics, like age, income, and geographic location
Customer feedback from surveys, feedback widgets, and interviews
Behavior analytics, such as on-site user clicks and scrolls from session recordings and heatmaps
Web analytics, like average session duration and bounce rate (which you can find on your Hotjar Dashboard)
Customer analytics, such as blog engagement, email marketing metrics, and purchase history
By analyzing this information with data analysis methods like predictive analysis, you gain a deeper understanding of your prospects and customers and how you can better serve them.
Conduct data analysis effectively with Hotjar
Use Hotjar’s tools to gather the insights you need to empathize with your users—and improve your marketing campaigns.

3 ways data analysis helps you empathize with target customers
When you hear ‘data analysis’, you’re more likely to think of cold, hard facts than warm, fuzzy feelings. But analyzing data effectively helps you understand your customers’ emotions and motivations in a whole new way.
It helps you empathize with your customers, putting yourself in their shoes, so you can build a user-centric experience that solves their problems—and attracts new buyers to your product and brand.
1. Understand the buyer’s journey
A customer’s journey to—and within—your product may be short and sweet, or long and rewarding. Tracing your prospect’s path to purchase, complete with all the touchpoints they have with your company, helps you recognize their disappointments and delight.
Data analysis provides a solid foundation for creating a customer journey map, a visual representation of how customers interact with your brand. You analyze information from sources like website analytics (to see how users arrive at your site) and on-site surveys (to see how they feel once they’re there).
With a customer journey map, you develop a holistic understanding of how your prospect views your company, so you can understand how to market your product or service to them at each stage.
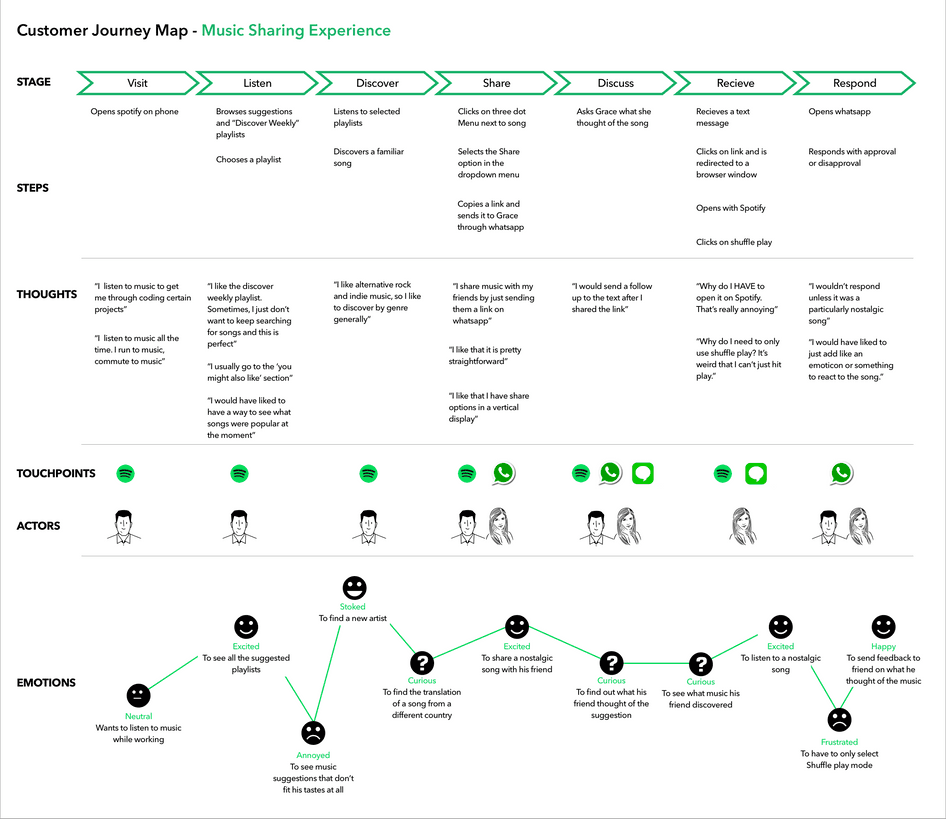
Designer Meghana Bowen’s customer journey map for Spotify aligns users’ touchpoints with how they feel
2. Create clear, compelling messaging and content
Messaging is a huge part of marketing—and one you want to get exactly right. Data analysis lets you create targeted brand messaging, which forms the basis of on-point ad copy and social media posts.
Content runs on data, too. Search engine optimization (SEO) and blogging are popular inbound marketing strategies that drive leads directly to your company’s front door. But for content marketing success, you need to unpack data to discover (and then answer) users’ burning questions.
For example, surveys let you ask your target audience what they want to learn more about, eliminating the guessing game and giving you a wealth of quantitative data (from rating-scale responses) and qualitative data (from open-text answers).
3. Improve your website’s user experience (UX)
Marketing is all about attracting leads to a product or brand, and offering a seamless user experience is one way to do just that. By collecting and analyzing data about how users interact with and feel about your site, you discover ways to better suit their needs.
For example, you might use Hotjar Heatmaps to visualize how far users scroll down a page and which areas of the page they engage with the most. Or, you could add a feedback widget to a landing page to ask how they felt about their experience.
Then, you’d analyze this data to look for trends and patterns. You may find users struggle with your pricing chart, or crave more information about your environmental policies, giving you the insights you need to make tweaks to deliver exactly what they need.
👀 How Essential Concepts uses a data-driven approach to improve UX
Digital performance marketing agency Essential Concepts dives deep into user insights to learn how to enhance visitors’ website experience. Analyzing data helps them stay attentive to users’ needs and proactive with improvements.
Essential Concepts’ process looks like this:
Collect data from Hotjar Heatmaps and Recordings, which show individual users’ clicks, scrolls, and mouse movements on key pages
Analyze data sets by asking themselves critical questions about the site design and ease of conversion to uncover flaws
Create a hypothesis about what could be improved, and run A/B testing with real users before making major changes
With a solid data analysis process and a user-centric mentality, the company empathizes with its users and stays proactive about site improvements.
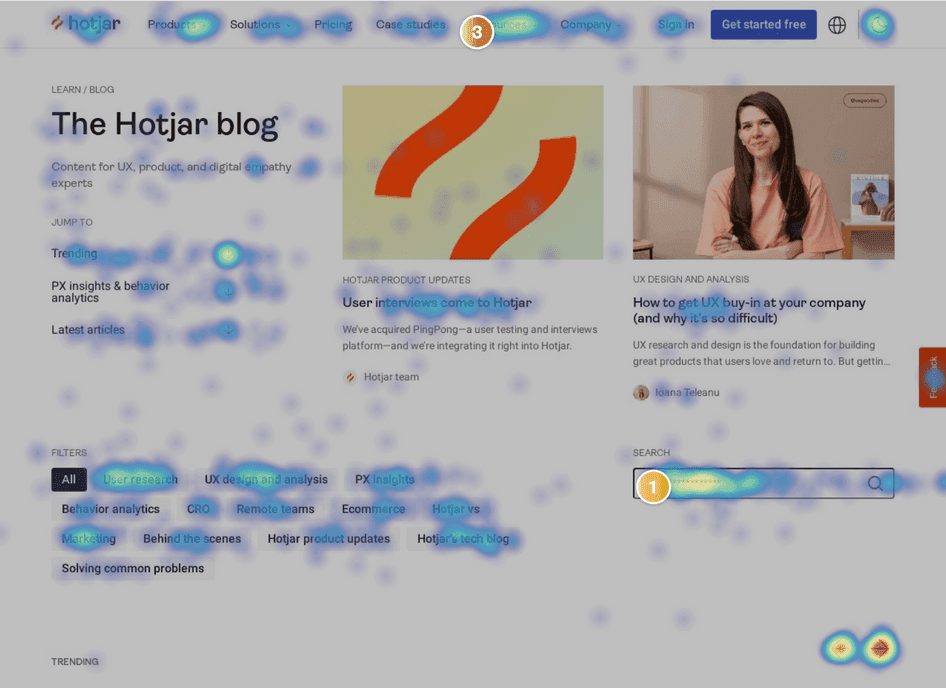
Essential Concepts analyzes click maps, a type of heatmap, to optimize their customers’ websites (and their own!)
4 data analysis skills every marketer needs
Data analysis sounds like a chore—but we promise it’s not. With just four essential skills, any marketer can crunch numbers and get insights from text-based data.
1. Critical thinking
Critical thinking is the key to data analysis. It shows the best way to collect and organize insights, so you get accurate, usable info about your target customers.
It also helps you evaluate what information is important—and what’s not—so you can make inferences about your findings. For example, should you remove those outliers (statistical anomalies) from the data set, or are they clues pointing toward an issue that needs your attention?
In marketing, you rely on your critical thinking skills to
Evaluate whether key performance indicators (KPIs) are progressing toward your campaign goals
Analyze social media metrics to find problems with your paid ads
💡 Pro tip: lean on your critical thinking skills to avoid introducing bias into your analysis.
With each choice you make during the data analysis process, you run the risk of skewing your results. And you can’t afford to use inaccurate insights to drive your marketing decisions.
Two common biases to avoid are
Selection bias, which occurs when you don’t randomize your sample. Say you send a customer satisfaction survey out via email. The people who are most likely to open your emails are your loyal customers. This might skew your results in a favorable direction.
Confirmation bias, which happens when you only pay attention to information that confirms what you already believe. For example, if you suspect your leads aren’t converting due to problematic calls-to-action (CTAs), you might unintentionally look for behavioral data that supports that theory while ignoring other red flags.
Analyze your data with care for the most accurate and balanced results. Examine your pre-existing beliefs, keep an open mind when approaching your analysis, and question your data’s validity at each step.
2. Basic technological proficiency
Today’s analytics tools make gathering and interpreting user information easier than ever, but you still need some technical skills—and a willingness to experiment and learn. With tech skills, you choose the best tools because you understand their features and how they integrate with your other marketing tech platforms, like social media management or customer relationship management (CRM) software.
Note: many data applications provide a free demo or trial. Take advantage of these offers to check out the user interface (UI) in action and determine just how easy it is to navigate. Also, take a peek at the company’s knowledge base—see if they offer videos, tutorials, or tool tips to make adoption a snap.
3. Visualization and reporting
Raw data in and of itself is typically not very user-friendly. Imagine hundreds of rows of numbers (quantitative) or a spreadsheet full of text-based insights (qualitative). Putting this data into a visual, easy-to-read format helps you—and others—understand it.
Tech tools do most of the heavy lifting, but you still need to decide the ideal format for each type of data. The right visualization isn’t just more engaging; it’s more effective for guiding decision-making.
When visualizing your data, consider using
Pie charts to highlight parts of a whole to make relative comparisons (like breakdowns of demographic data)
Bar graphs to make comparisons between groups over time (like average spend per customer type per quarter)
Line graphs to show change over time (like cost per lead per year or average time on page throughout a campaign)
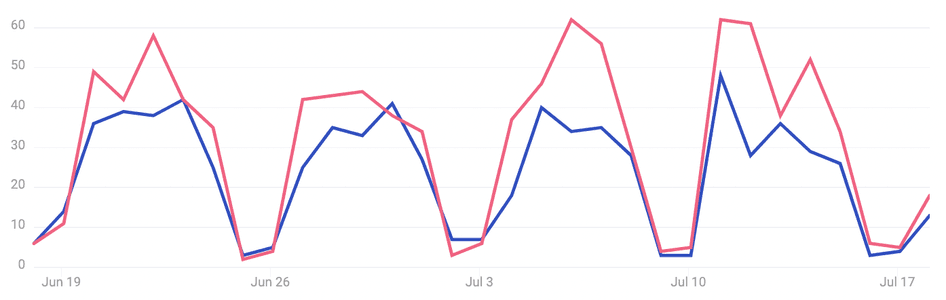
Hotjar Trends lets you effortlessly visualize your data as pie charts, bar charts, or line graphs (like this one)
4. Communication
Data loves to hide out in siloes, but that doesn’t mean you should let it. Strong communication skills allow you to introduce and contextualize your data for others in marketing, sales, or customer service. By clarifying your thinking for others, you drive user-centric discussions and business decisions.
Your technical proficiency comes into play here, too. Understanding how the tools in your tech stack work together lets you automate communication. For example, Hotjar integrates with the messaging platform Slack, so you can get results sent directly to a dedicated channel to spark discussion across teams.
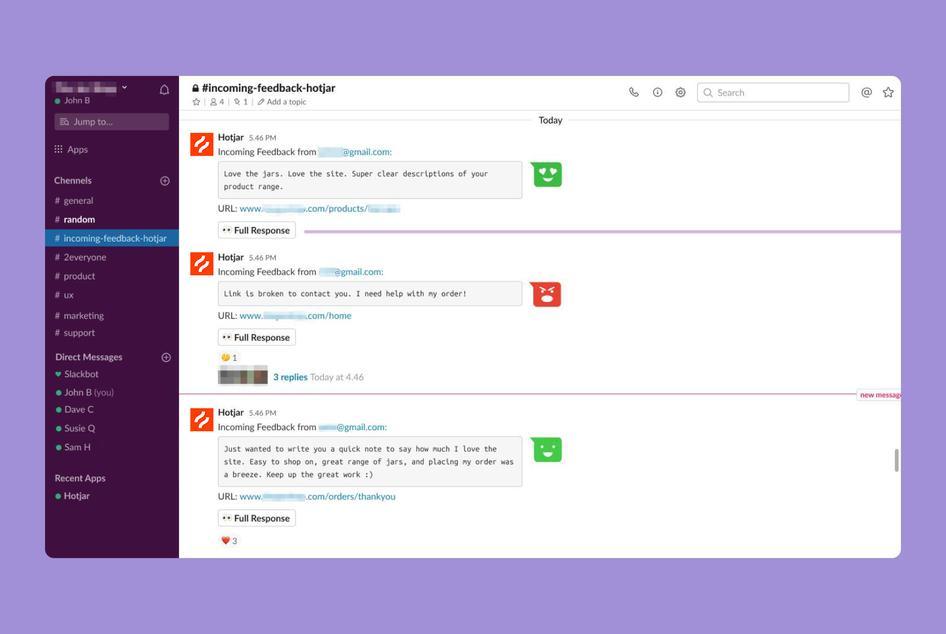
Get user feedback sent straight from your website to a Slack channel with the Hotjar-Slack integration
Get in-depth insights to drive user-centric marketing decisions
Everyone’s talking about data in digital marketing—and for good reason. With data analysis, and some basic critical thinking and communication skills, you gain a deeper understanding and appreciation of your buyer’s journey.
These insights empower you to optimize your messaging while removing friction from your UX. The end result? You create satisfying experiences and drive customers to your site.
Conduct data analysis effectively with Hotjar
Use Hotjar’s tools to gather the insights you need to empathize with your users—and improve your marketing campaigns.