Learn / Blog / Article
Get insights, fix things, repeat: a checklist to help you focus on your customers right now
There are things that never change—not even during this very (insert your preferred adjective here) time. If you have a business selling online, the best way to grow it has always been to really understand your customers: what is driving them to your website, what’s convincing them to stay on it, what’s stopping them from finding what they need.

Some things, however, do change. For one, your customers’ mindset (like yours and mine) is probably different than it was just a few weeks ago; the speed at which you are having to make website changes has likely gone up, too. At the moment, we don’t quite have the luxury of time when it comes to optimization: it’s more of a case of get insights, fix things, repeat.
...which is where I come in to help. I looked through all the website optimization processes I have previously written about and stripped them down into a 4-step checklist to help you stay laser-focused on your customers’ needs and use the insight you have to give them the best experience possible, right now.
Because I’d never done a ‘pandemic edition’ before—then again: who has?—I looped in two conversion experts, Karl Gilis (‘the 3rd most influential CRO-expert in the world’) and Joey Kant from AGConsult to act as my sounding boards through the process, in case I missed something obvious.
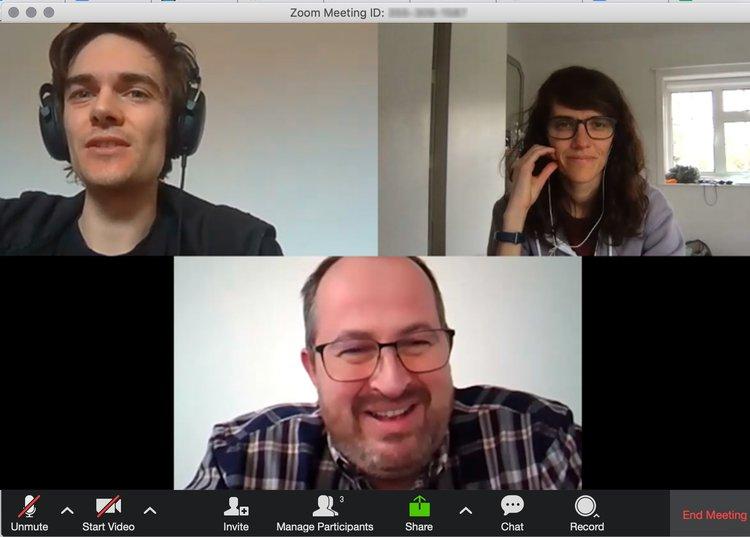
ME, JOEY, AND KARL ON MARCH 30TH
And here is the checklist (click on it for a downloadable version):

Alright, let’s do this.
Why it’s important to pay attention to traffic and user behavior right now
The best way to grow your business is to understand what people came to your website for and figure out the smoothest way(s) to help them get it. This was true a month ago, and it’s still very true today.
What’s different today is that you can’t really take too long to collect data, formulate hypotheses, or test different ideas to find the optimum solutions to implement. Your customers need a clear and functioning website, and they need it now:
People are, in general, way more scared and stressed than before → they will likely respond with far less patience than usual if your website adds confusion and/or frustration to their life
Daily routines, including shopping, are disrupted → traffic to your site might be coming from different browsers and devices than the ones you have optimized for (for example, customers may start shopping from desktop rather than mobile now they’re in lockdown)
People who haven’t shopped online before might be visiting your website for the first time → as physical shops close, non-digital shoppers may be forced to go online out of necessity and may need more signposting and clarity compared to previous, more ‘competent’ customers (personal sidenote: in Italy, where I’m from, turns out 75% of people who shopped online this March had never done it before)
In other words: if you research too long, your research will be outdated by the time you change your website. If you see that something is broken, fix it; if a customer tells you something is not clear, clarify it. This is the time to do more with less: observe behavior, make quick changes, and send them live asap.
Learn why your visitors aren’t converting
Hotjar shows you what keeps your visitors from buying, so you can make website changes based on real insights, not assumptions, and watch your conversion rate grow.


“I think the most important thing nowadays is that we should take action. Don't spend too much time on the analysis itself: the analysis is important, but if you see something, change it. If you had something that used to have a 40-60 split, and now it's suddenly a 20-80 or a 23-77 one, the detail of why it’s 20 or 23 doesn’t matter. What matters is making sure everything is working correctly. If you understand that people are now ordering this product more than that one, give it prominence. If something is sold out, recommend similar items. If your delivery times have changed, specify it on the homepage. Act now. Just see what you can do with your website, and do whatever it takes or whatever is needed to help your visitors as much as possible.”
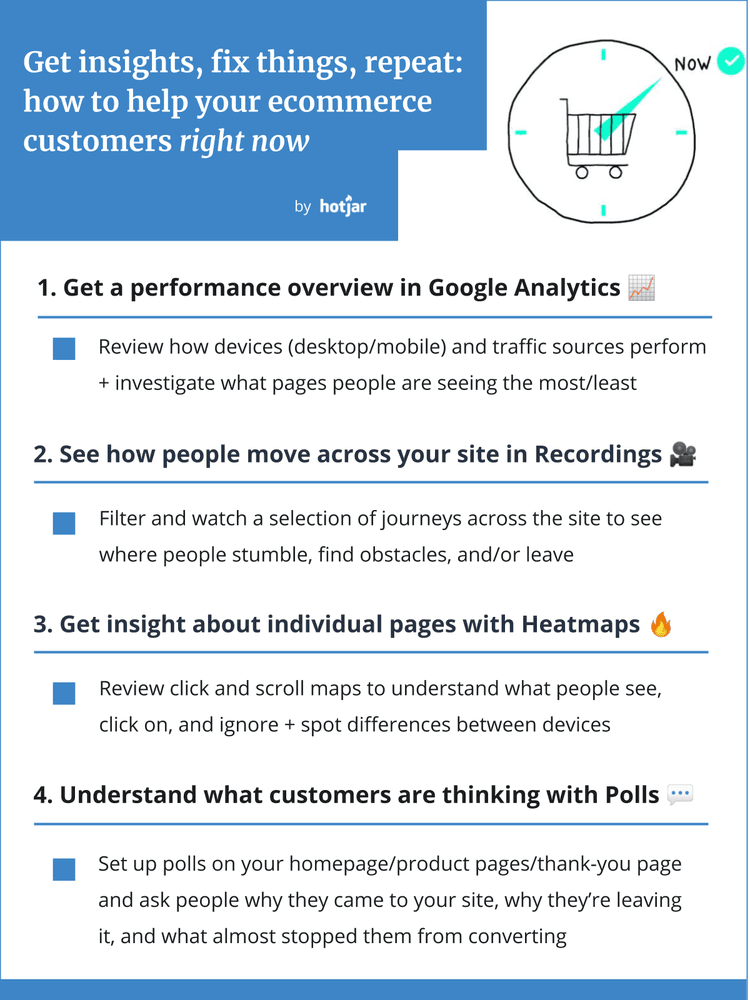
With all of this in mind, here are the 4 steps I’m going to help you take to make sure you can stay fully focused on your customers right now:
Note: this checklist assumes that you are already using Hotjar. If not, use this free forever plan—you don't need a credit card to sign up, and you only need to add a script to your website to start collecting data.
Stay focused on your customers 🔥
Get insights about how people are using your website & what they really need from it, right now.
Step 1: get a performance overview in Google Analytics 📈
Google Analytics gives you a comprehensive overview of traffic data and trends on your site. But normal seasonality won’t happen this year, so you can't rely too much on past trends and knowledge: right now, GA should be your first entry point to look for changes on a weekly, and even daily basis. Here are a few ideas:
Look for traffic composition in Audience > Mobile > Overview and use the report to investigate changes. For example: has traffic from desktop/mobile changed across your website? Do you need to account for any fluctuations, for example by checking responsiveness across new device types/models?
Use the same report to look for conversion rate per browser/device: has conversion rate changed—and does your website work optimally on your top devices and browsers right now, whichever they may be?
Look for how traffic sources perform in Acquisition > All Traffic > Channels: what kind of traffic performs better or worse, conversion-wise? Do you need to make adjustments to your acquisition strategy?
Speaking of which: if you’re running Google ads for your business, drill down into your Acquisition > Google Ads > Campaigns to see if something looks significantly different than before, conversion- or revenue-wise. If it does, do you still have your normal ads running (for example the ones that talk about one-day or in-store delivery) and are they still relevant?
Investigate where people are going by using the Behavior > Site Content > All Pages report: what are the top pages visited right now? Do you have product pages that are suddenly getting a lot more/less traffic? Are your highest-margin products pages being seen? (And if not, have you considered giving these products more prominence on the homepage?)
Check your search term reports in Behavior > Site search > Search terms, which is especially useful for tracking daily/weekly changes in user intent across your site
🔥Pro tip: when looking at Analytics these days, always make sure to look at a time period that's very recent, because buyer intention can shift very dramatically in just a few hours. For example, last week our Belgian government decided that all barber shops would be closed. And the next day on the biggest e-commerce website here in Belgium and the Netherlands, everything that had to do with shaving and hair-cutting was sold out. So if something like that happens to your ecommerce, you have to adapt to the situation: use out-of-stock messages, maybe change the homepage, recommend a similar product, and so on.

JOEY KANT, AGCONSULT
PS: looks like hair clippers are in high demand over in the UK, too → and this is a good example of how to quickly direct people to something similar if you don't have exactly what they're looking for.
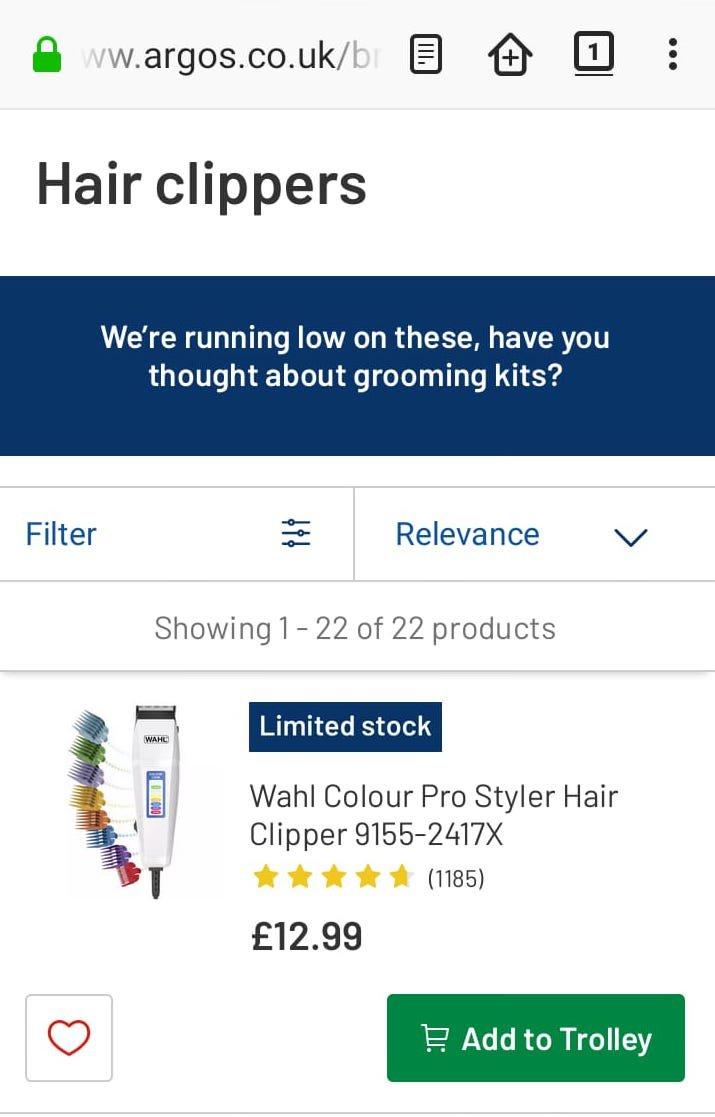
SOURCE: ARGOS.CO.UK
Step 2: see how people move across your site in Recordings 🎥
Once you get a general sense of what’s going on traffic-wise via Google Analytics, you want to start building a clearer picture of how users are actually experiencing your website.
That’s where session recordings (also known as session replays or visitor recordings) are going to help a lot. Recordings are renderings of the actions your visitors took as they browsed through your site—I’m talking clicks, taps, mouse movements, and scrolling across multiple pages:
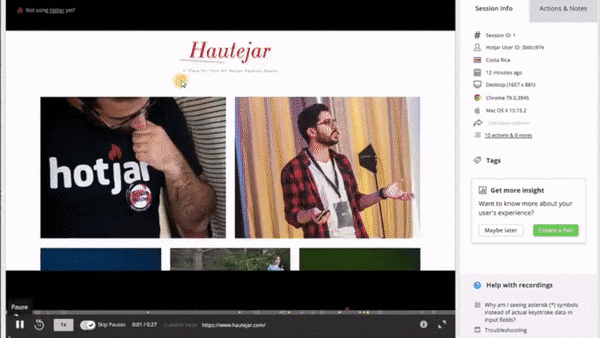
How to get started: from the sidebar menu, select Recordings and set them up as you need. Hotjar will start recording samples of visitor sessions when new people land on your site, so you can watch them fairly quickly (depending on how much traffic you get)
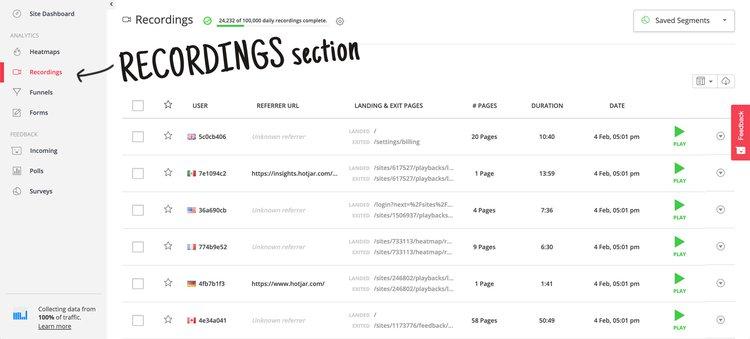
(here are step-by-step instructions for starting Recordings if you haven’t done it before).
Watch recordings to understand user behavior patterns
At this point, you’re trying to build a general understanding of what’s going on, so you can sort recordings by length and/or number of pages viewed and watch a mix:
Shorter recordings might be coming from visitors who encounter an ‘issue’ and cannot continue their journey—they might see a bug that won’t let them proceed, find that a product they need is out of stock, or they might be looking for details (delivery, customer service, etc.) they cannot find
Longer recordings help you paint a more accurate picture of the whole journey and potential stumbling blocks that happen between pages, and how people deal with the obstacles they encounter—for example, if they keep searching for alternatives to the out-of-stock product they needed, or keep going back and forth on your customer service and delivery FAQ pages
If you see something broken, share it with your team + fix it
If you and your optimization/UX/product team are using a project management system like Jira/Trello/Asana, create and add recording links to individual tickets or requests for changes and fixes. If a chat tool like Slack is faster, simply drop links to relevant recordings into it. This gives whoever is in charge of dealing with the situation the opportunity to see it happen before going in and working on a fix.
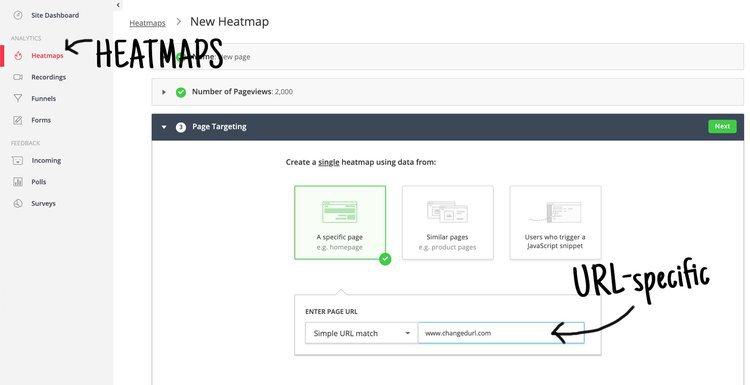
Step 3: get insight about individual pages with Heatmaps 🔥
Recordings let you develop a good understanding of complete journeys across the entire website, but you’ll also want to investigate individual pages—and you can turn to heatmaps for that.
Heatmaps aggregate data from multiple visitors and turn it into colorful visualizations of what people are clicking on, scrolling past, and/or ignoring. Using a color scale form cold (blue) to hot (red), they help you see which elements of the page receive the most attention and the most clicks:

EXAMPLE OF A SCROLL HEATMAP (LEFT) AND A CLICK MAP (RIGHT)
How to get started: set up a heatmap on each of your most viewed URLs (which you should have detected in Google Analytics) plus any other page that is currently of interest:
(here are step-by-step instructions for creating a new Hotjar Heatmap if you haven’t done it before).
Note: it only takes one person to visit the page for a heatmap to start working, but data based on just one visitor will not be very useful—so remember to give the tool some time to collect a good amount of data (100-200 visits are a good starting point).
Review click and move maps to see what people are clicking the most
Click and move heatmaps show where your website visitors hover and click their cursor on desktop, or tap on mobile and tablet screens:

The elements that get the most interaction(s) are highlighted in red. On your category pages, the reddest element will give you a good indication of what your most popular products currently are—and will also help you determine if your customers’ attention is where you want it to be. For example: if people are ignoring something you have given a lot of visibility to, you can move elements and modules around to bring what they are interested in into focus.
Use scroll heatmaps to see how much of the page visitors are viewing
Scroll heatmaps show you how far down the page your visitors go:
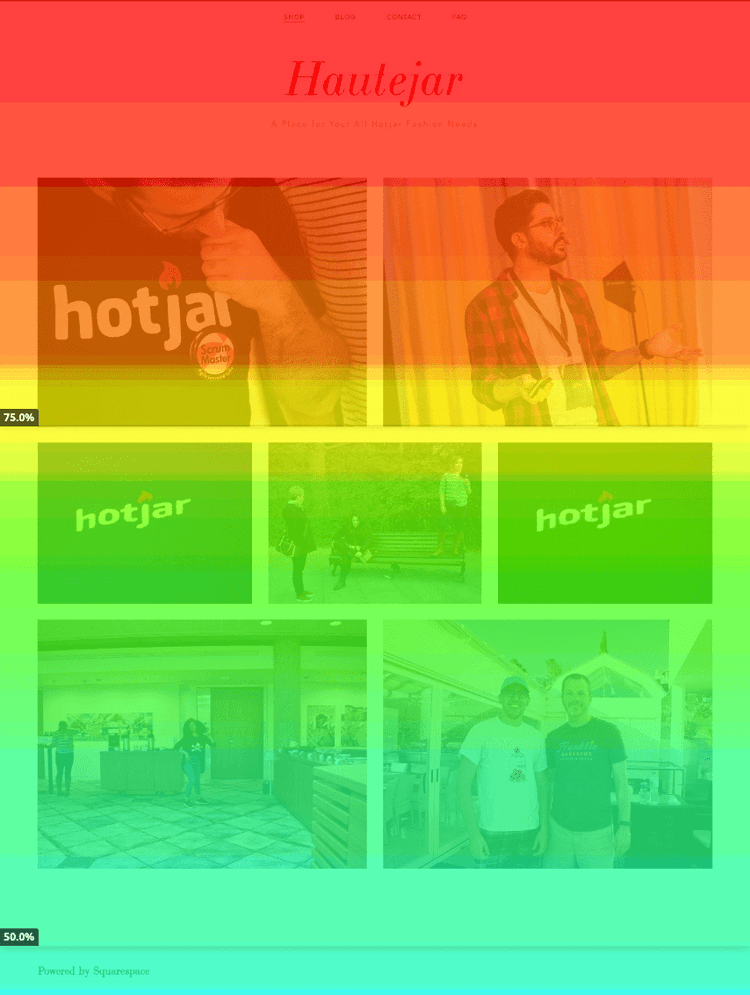
As with click and move maps, red indicates the most viewed section of each page—the one that the majority of people saw. If your scroll maps show you that the majority of visitors don’t scroll far enough to see important information, you can consider moving elements around to make them more visible.
Also, and this goes back to the idea of there being new devices/new browsers in use right now that you may not have optimized for: content that sits in a relatively prominent position on desktop may be far below down the page on mobile, and scroll maps can show you the percentage of people who see it (or don’t) so you can adjust things accordingly.
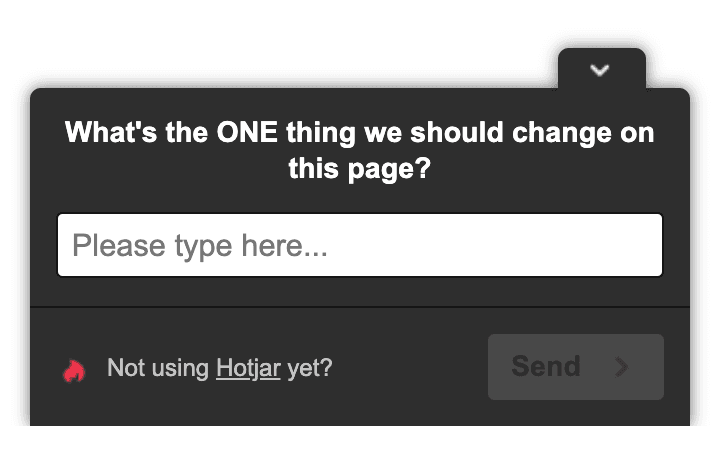
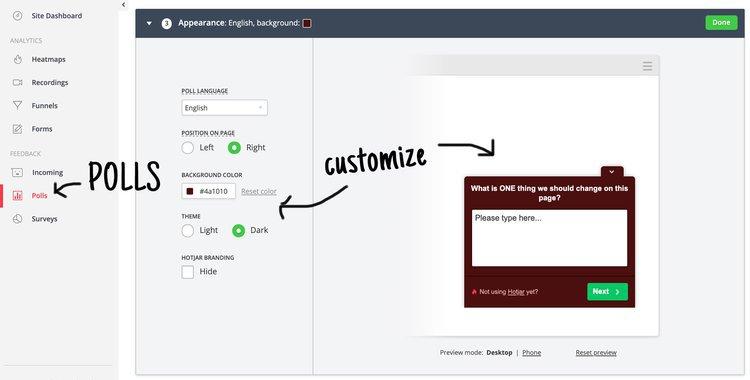
Step 4: understand what customers are thinking with Surveys 💬
Heatmaps and recordings will help you develop a clearer understanding of what’s happening on your website than just Google Analytics alone—but what you really need to do right now is some qualitative data about what people are thinking.
The easiest way to learn directly from your customers (and to get insights your competitors are likely not getting, right now) is by asking for their feedback on the page itself by using on-site surveys like this one:
How to get started: follow these instructions to create one and place it on any page(s) you want to investigate; remember to customize the color and appearance to match your brand style:
Once you send your Survey live, Hotjar will start showing it to visitors as soon as they reach the URL you’ve placed it on—but the speed at which you get answers, and the quantity of answers you get overall, will depend on people’s willingness to submit them.
Use a homepage survey to understand your audience
Putting an on-page survey on your homepage usually helps you understand the ‘drivers’ that brought people to your website. Ask questions such as:
What [product/solution/info/etc.] are you looking for today?
What’s the purpose of your visit today?
What are you looking to do on this website?
On-site surveys also let you ask follow-up questions; at this particular time, you may want to add a second question that allows you to understand the make-up of your audience, for example:
How did you first hear about us?
Have you been on this website before?
Have you shopped online before?
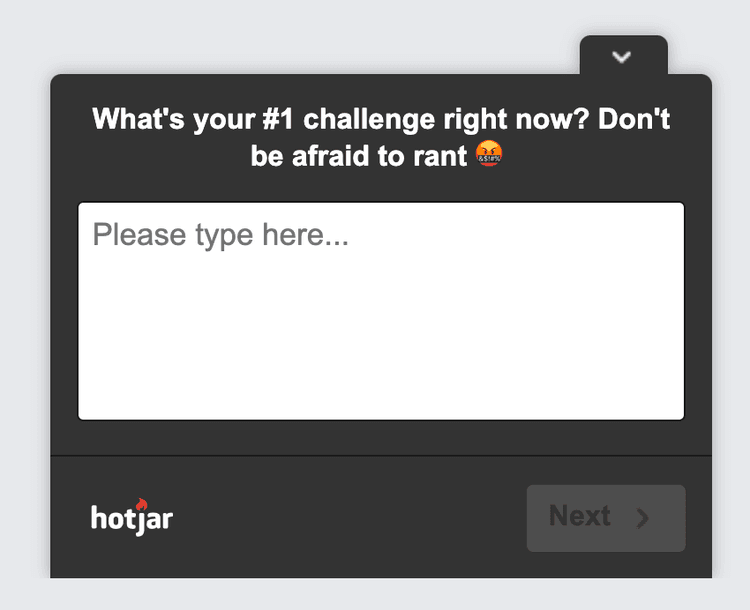
You can also use an on-site survey to ask more personal questions (if/when appropriate) to understand your customers’ state of mind and how best to serve them. For example, our team has recently shared a poll to specifically ask our customers how they are affected by the situation, and the first question was: What's your #1 challenge right now? Don't be afraid to rant
Use a product/category page survey to understand what information is missing
The following open-ended questions help you figure out what your potential and existing customers need to know about your product:
Does this page give you all the info you need?
What’s missing on this page that would help you make a decision?
Do you have any questions that this page is not answering?
What’s your biggest concern about this product right now?
If we could change ONE thing about this page, what would it be?
You don’t need to stick with open-ended questions. You can use a YES/NO approach to give people options and pair them with a follow-up question:
Is there anything on this page that doesn't work the way you expected it to? Yes/No (If people answer ‘yes’, follow up with: Please specify what)
Would you prefer to see [X] on this page? Yes/No (if no: why?)
🔥 Pro tip: usually, Surveys work better when you have hundreds of page visitors a day, so you can get a reasonable amount of answers and be sure your results are somewhat statistically significant. These days, I’m going to suggest that you just take whatever answer you get from this particular survey and make quick changes even if only one or two people report something.
For example: if ONE person tells you that what they need and cannot find is more detail about, say, the size/weight of the product, assume this is also true for everybody who did not answer your survey—and just add those details in, or make them more prominent if they are already there.
We’re after speed of execution after all.
Use a thank-you page survey to understand what almost stopped your customers
After your customers have successfully completed an order, you can use what is known as a post-purchase survey to uncover conversion-boosting insights. Ask the following 3 questions, in this order:
How would you rate your overall experience? (1-5 scale)
If the previous answer was 1, 2, or 3: What can we do to improve the experience? If the answer was 4 or 5: What did you love the most about it?
What almost stopped you from completing your purchase?
🏆 Pro tip: if you need help understanding and categorizing the responses once your customers start submitting them, you can use this quick guide that explains how to analyze open-ended survey questions.
Your 4-step checklist:
A final note:
These days we don't have the luxury of time when it comes to optimization—so I encourage us all to be scrappy, unlearn a bit of the processes we normally have in place, and just, well—do things that help. If you learn that something is broken via session recordings, don't park this information into a ticket for later: jump in and fix it. If a heatmap proves that people are not paying attention to something on a page, don't file this information away for the future: use it to make changes right now. If your customers give you feedback about something missing on a page, don't add it to a list of things that need to be looked into: go to the page and do whatever is needed.
Focusing on your customers, and what they need, is never the wrong thing to do.

FIO - SENIOR EDITOR, WORKING FROM HOME IN THE UK
Start collecting user behavior insights today
Get in-depth insights and conduct customer behavior analysis with Hotjar’s suite of tools.
Related articles

CRO
7 stats that prove user-centric websites win for mid-market companies in 2024 (with tips on how to improve UX)
Is your website user experience holding you back? Don’t rely on guesswork and gut feeling alone: use data to elevate your UX and enhance your bottom line.

Shadz Loresco
CRO
7 stats that prove user-centric websites win in 2024 (with tips on how to improve UX)
Is your website user experience holding you back? Don’t rely on guesswork and gut feeling alone: use data to elevate your UX and enhance your bottom line.
Shadz Loresco

CRO
How to improve your online reputation to acquire more users and customers
A good online reputation inspires your users to share positive reviews that make your business more trustworthy in the eyes of potential customers, and, in turn, increases sales.
But it takes more than a good product to build and maintain an effective online presence. You have to actively listen to customers to understand how they feel and make changes to improve the user experience (UX).

Hotjar team