Learn / Blog / Article
5 strategies for reducing ecommerce bounce rate
Let’s face it: something is probably off if potential customers leave your ecommerce site before they make it past the first page they land on. Whether they can’t find what they’re looking for or just don’t like what they see, it’s essential for any ecommerce business to be aware of what pages visitors ‘bounce’ from in high numbers—and why.
This article covers several customer-centric tools for understanding and reducing ecommerce bounce rate.

Reduce your ecommerce bounce rate
Hotjar has all the tools you need to understand customer behavior and identify ways to reduce your site’s bounce rate.

What does bounce rate mean for ecommerce sites?
Bounce rate is a meaningful metric to examine if you want to assess how your online store is performing. It’s a good indicator of how visitors experience your website and can provide insight into why sales or conversion rates aren’t as high as you’d like.
Looking at the bounce rates of single pages on your site is a great way to discover where potential customers leave before buying. The next step is to use tools to help you uncover the factors behind these bounce rates and how you can improve the user experience.
5 ways to reduce ecommerce bounce rate
Generally, a high bounce rate could mean something on your homepage or product page is broken, unclear, or off-putting, while a lower bounce rate might mean the opposite.
That said, context matters. For example, a high bounce rate on a contact page isn’t necessarily cause for concern because those visitors most likely found the information they needed.
When it comes to reducing ecommerce bounce rates, it’s valuable to know where and why visitors don’t explore past the first page they see. The following five strategies will allow you to step into your customers’ shoes to get a better understanding of what’s causing them to bounce.
1. Go beyond basic bounce rate metrics
Naturally, you’ll want to start by determining your website’s bounce rate. If you’re conducting regular ecommerce website analysis, chances are you’re already familiar with Google Analytics (GA) and the fact that it can automatically calculate bounce rate, or the percentage of page sessions that result in a bounce. This statistic can be examined and broken down in various ways, depending on what exactly you’re trying to learn from a page’s bounce rate.
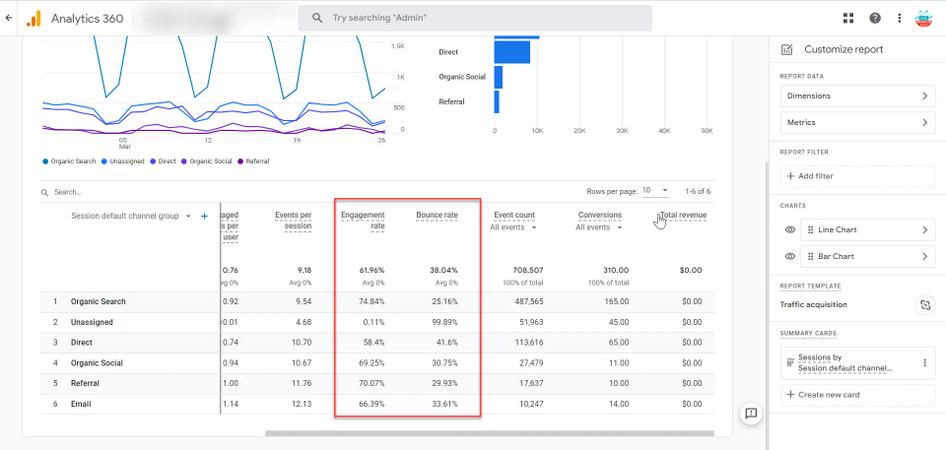
Tools like Google Analytics will calculate bounce rates for your ecommerce site (Source: Seer Interactive)
🧑🏫 Expert tip: Joel Klettke, the conversion rate optimization (CRO) expert behind Business Casual Copywriting, recommends evaluating bounce rate and website traffic sources. The example image above shows a GA report that differentiates a page’s bounce rate by traffic source.
If you’re using paid search ads, customer retention emails, or social media campaigns and are unhappy with the bounce rate of visitors they bring in, it may be worth re-evaluating your marketing strategy—make sure your ads properly reflect the type of content visitors will find on linked landing pages.
And keep in mind that bounce rate can negatively affect search engine rankings: a high bounce rate signals to search engines that users don’t find your page relevant to their search, which leads to lower rankings.
Supplement Google Analytics with user behavior analytics tools
Don’t forget: there’s more to the story behind bounce rate numbers. Let’s consider the following bounce scenarios:
Visitor A arrives on a product page and leaves after a few seconds
Visitor B arrives on a product page and spends a few minutes on it before leaving
Without extra context, you could assume that Visitor B is interested in your products because of the time spent on the page and argue that this bounce is more problematic than Visitor A’s, who showed less interest by staying for a shorter time.
Then again, Visitor A might have expected something very specific and left in frustration without immediately finding it, while Visitor B could have had zero desire to purchase anything and just kept reading out of curiosity.
There’s no difference between either scenario in Google Analytics’ eyes: they're both a bounce. But for you as an ecommerce business owner, manager, or optimizer, knowing what happened in either scenario—whether an element was broken or a product impossible to find—might be the key to improving the page’s conversion rate.
Since Google Analytics can’t tell you why people bounce from your page, you need to gather additional user behavior insights to ditch assumptions, and get actual explanations that lead to actionable solutions. Pairing GA data with qualitative, customer-centric tools like the ones we list below is the way to go.
💡Pro tip: Hotjar is the perfect companion to Google Analytics. With our seamless GA integration, you can combine information that shows you what’s happening on your ecommerce site with information that answers why those things are happening.
2. Use heatmaps to reveal what visitors see and interact with
Have you ever gotten lost in a poorly organized (physical) store, endlessly searching for the item you need? Just like with a physical storefront, online businesses need to put deliberate thought into how potential customers browse their ecommerce store. Product arrangement and content flow directly influence how navigable or familiar a site feels for visitors, whether they’re perusing for the first time or returning for a repeat purchase.
Heatmaps, which come in various forms, visualize how visitors behave and interact with your site, providing answers to questions like:
Do people see the most important content when they first land on a page?
Did they abandon a page halfway through because they couldn’t find what they wanted?
Do they intuitively interact with clickable elements, or become frustrated after clicking something inactive?
Understanding these behaviors will give you insight into why certain pages have a higher bounce rate. Let’s look at what you can learn from different types of heatmaps.
Scroll maps
The name is self-explanatory: scroll maps show how far down the page a visitor scrolls and, more specifically, whether they make it below ‘the fold’, the top area of the page initially displayed on their screen.
Ideally, you want the most important information, brand messaging, or product specs to live in that space, enticing visitors to remain on the page and click further into your site.
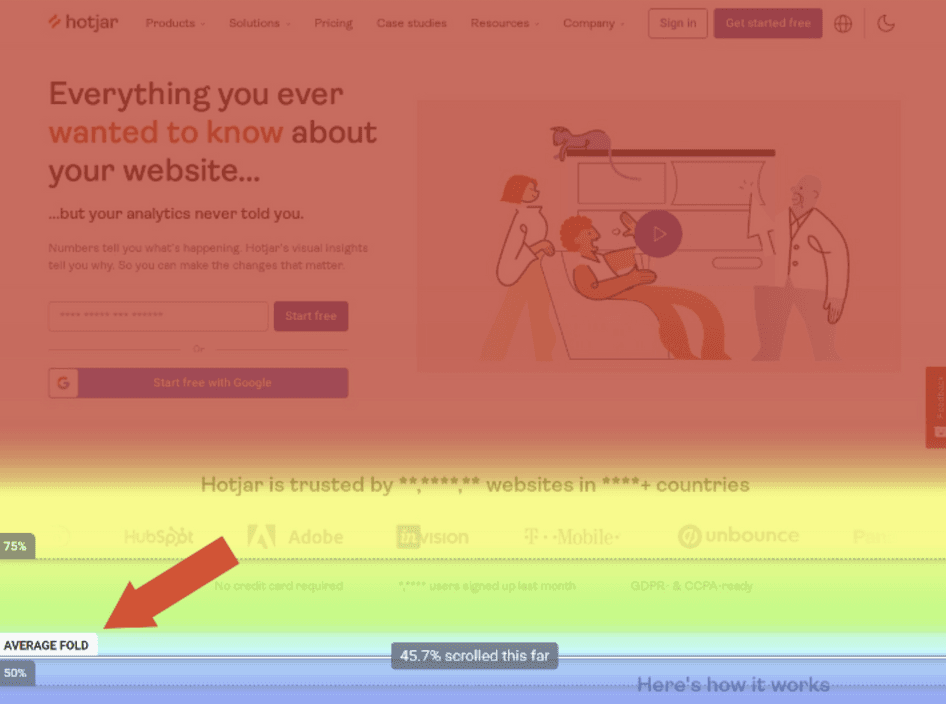
Scroll maps, like the one above generated by Hotjar, automatically calculate the average fold on your page so you can tell if crucial elements, like a call-to-action (CTA) button, are immediately visible on desktop and mobile devices.
Knowing where most visitors stop scrolling will indicate whether the page needs to be redesigned to highlight those crucial elements.
The scroll map showed that on mobile, 75% of users didn't see our main CTA. We moved it above the fold and saw an immediate increase in users landing on our key pages.
Click maps
While scroll maps show what people see on a page, click maps show what they interact with. ‘Hotter’ red areas visualize which text, buttons, or imagery receive the most clicks (or taps, from mobile users), revealing your visitors’ intent to delve deeper into your site.
Visitors who bounce after seeing only one page haven’t clicked any active links or back buttons—but you can still use click maps to investigate
Where people click on average
If people are trying to click non-clickable elements, which could frustrate them enough to want to leave your site
Hotjar has a specific heatmap for this second scenario: with the rage click map, you can see if visitors tried to click on an inactive logo or image, expecting an interaction that never happened. They could have bounced away as a result.

🧑🏫 Expert tip: not all is lost if a potential customer doesn’t find what they want on the first page they visit. Ecommerce growth consultant Rachel Jacobs sees this as an opportunity—you can still incentivize visitors to stay by helping them discover other related products they might want or need with strategically placed product recommendations. Inspiring visitors to continue browsing can increase engagement and conversions.
You can see how well your product recommendation setup works by placing heatmaps on product pages and noting the percentage of visitors who click on related products. If visitors aren’t paying attention to the section, you may need to move it around or make it more eye-catching.
💡Pro tip: an Engagement Zone map, a tool unique to Hotjar Heatmaps, combines click, scroll, and move data into a single view. This heatmap makes it easier to spot clear behavior patterns and understand what content your users find most valuable.

Consolidate multiple heatmaps into one view with a Hotjar Engagement Zone map
3. Collect customer feedback with on-site surveys
Finding out where website visitors click (or want to, but can’t) offers you a glimpse into their intentions and expectations, but there’s still some guesswork involved when you want to know reasons behind their behavior.
To really understand what might cause someone to bounce, why not ask them? With on-site surveys, you can gather real-time feedback from visitors about their experience.
Website survey tools like Hotjar Surveys are designed to help you strategically improve your site’s user experience, which is ultimately at the heart of customer delight and satisfaction. Poll visitors about their overall impressions by placing a survey on a page and asking pointed questions, depending on the nature of the page:
For a product page: what do you think of the product information on this page?
For an information page: can you find the information you’re looking for?
For any page: what’s the ONE thing we should change on this page?
You can even ask visitors why they’re leaving from a specific page: Hotjar’s customizable exit-intent popup survey template lets you effortlessly create a survey to understand the causes behind a high bounce rate. You may learn that you’re losing potential sales because the copy on your pricing page is confusing, or because you don’t offer international shipping, while your competitors do.
Once you evaluate and analyze the answers you receive, you can make informed decisions about what changes to make to your site’s design and business structure.
Optimizing your site can involve eliminating irrelevant copy or playing around with more engaging fonts and formats. Or maybe your site gives the wrong impression—to convey that your business is professional and trustworthy, use high-quality pictures and consider incorporating customer reviews and testimonials to build social proof.
🧑🏫 Expert tip: when researching why people abandon your site, Hotjar Founder David Darmanin recommends focusing on a group he calls the ‘undecided explorers’: potential customers who fit your ideal customer profile but require additional persuasion before committing.
Your job is to find out why these prospects aren’t making it through to more than one page of your website. It might sound counterintuitive, but one way to do this is to run a post-purchase survey and ask your newly converted customers what almost made them not convert. The barriers they managed to overcome may be proving too difficult for other, less motivated visitors. With this knowledge, you can fix whatever needs fixing for everyone who comes to your site in the future.
Using the information gathered from Surveys helped us make substantial changes that resulted in a +491% increase in email CTR and a +49% conversion rate increase for our landing pages.
💡Pro tip: to collect valuable qualitative data from users, you need to ask questions that will lead to actionable insights. But it might seem daunting to come up with the right questions to ask, and you may not have the resources to invest in extensive brainstorming.
With Hotjar AI for surveys, you can generate a survey focused on reducing bounce rate in seconds. Better yet: with automated summary reports, Hotjar AI will analyze your open-ended survey responses and provide you with a summary of findings, quotes to support those findings, and actionable recommendations for next steps.
Reduce your ecommerce bounce rate
Hotjar has all the tools you need to understand customer behavior and identify ways to reduce your site’s bounce rate.
4. Watch what visitors do before bouncing with session recordings
If you really want to see your site through your customers' eyes, consider monitoring their behavior with session recordings. Hotjar Recordings anonymizes personally identifiable information and focuses solely on how a visitor navigates a site or page, including keyboard strokes, scrolling, and click and movement data.
Watching people engage with your site in real-time breathes more life into insights from heatmaps and survey responses.
To look into the reasons for bounces, session recordings show you what people do on a page before leaving it—just segment sessions in Hotjar Recordings to see users who bounced from a page. Some things to ask yourself as you watch these sessions:
Which areas of the page do users linger on, and which sections do they miss entirely?
Do they seem confused or frustrated? Are they repeatedly scrolling up and down in search of something?
What are they doing immediately before leaving? Did they abandon the page when they saw a specific item was out of stock, or after several attempts to click a non-clickable element?
Paying attention to these behaviors can help you identify which areas of a page are persuasive to prospective buyers and which areas may act as deterrents.
Session recordings are also invaluable for spotting technical errors and other issues with your site—think 404 errors, faulty drop-down menus, and mobile rendering problems. Usability issues are one of the most common aspects that drive visitors away: a bounce is almost inevitable if people can’t progress on a page that doesn’t work. Reviewing session recordings is one of the simplest forms of usability testing when you’re trying to determine whether a usability issue is a culprit behind a page’s high bounce rate.
🧑🏫 Expert tip: if you’re not sure what high-bounce pages to focus on first, take the advice of ecommerce growth consultant Rachel Jacobs. Product pages “are the heart of your business,” and “making sure that the product images are clearly and accurately displayed, add-to-cart functionality is easy, and reviews are visible is a good place to start.” Prioritizing optimizing your product pages can help you streamline the checkout process and preemptively avoid cart abandonment.
Reviewing session recordings of visitors that viewed a product page and bounced will reveal where they try to click, and how often they’re scrolling up and down in search of something. Use Hotjar Recordings to filter sessions by frustration level to uncover and address common pain points.
Showing clients analytical numbers about what happened and where isn’t always enough. When I introduced visual insights into ‘why’ shoppers behave certain ways, specifically session recordings, I saw jaws drop and excitement build.
5. Test the success of individual conversion pages with funnel analysis
As a part of conversion rate optimization, funnel analysis is used to identify where site visitors drop off along a specific marketing funnel aimed at converting them to paying customers. Though this normally involves looking at an entire flow or progression through multiple pages, funnel analysis is still relevant for identifying why people bounce from the first page of a funnel.
What’s more, Hotjar Funnels integrates with Session Recordings and vice versa. You can quickly identify landing pages with high bounce rates and dive into the recordings for that page to see why people are leaving. Or, if you spot a usability issue in a single session recording, you can see if that experience is a one-off or part of a bigger issue.
With funnels, it’s beneficial to conduct A/B testing on your landing pages to discover the features visitors love and hate, either leading them to continue down the funnel or bounce away, never to be seen again. A great time to test is when you want to implement changes to a page based on insights gathered from heatmaps, surveys, or session recordings.
To run an A/B test on a high-bounce landing page, split inbound visitors between the original landing page and a version with changes based on user feedback. If more people continue through the funnel after seeing the new landing page, it might indicate that whatever features were updated are performing well and can be implemented for all future visitors.
We’ve identified steps in our funnel that were confusing to our customers and caused them to abandon our product. We can easily identify screens that make them get lost and hesitate on what to do next, so then we can fix UX issues and keep improving for them. Every small improvement increases conversions around 10%-20%, which is really significant.
🧑🏫 Expert tip: shortening overall site speed and individual page speeds is a quick and easy step to take when it comes to reducing bounce rate and optimizing conversions. People’s attention spans are short—a slow page load time can result in visitors bouncing from a landing page before they even see what’s on it.
While researching ecommerce conversion data, Michael Wiegand, Director of Analytics at Portent, found that sites with a 1-second load speed have conversion rates 2.5x higher than sites with a 5-second load speed. You can reduce your site’s load times by streamlining your code and eliminating unnecessary elements or plugins.
What is a good bounce rate for ecommerce?
Now you might be wondering what, exactly, is a good bounce rate to aim for in ecommerce. From multi-industry research conducted in 2023, Siege Media found that the average ecommerce bounce rate is about 54%, noting that ecommerce blogs experience exceptionally high bounce rates—some upwards of 90%. They recommend that a general benchmark to aim for is a sitewide average bounce rate of below 50%.
Google Analytics even has a Benchmarking feature that lets you compare your site data to other companies in your industry. See how your bounce rate measures up to your competition so you can stay ahead of the game.
But don’t forget that a higher bounce rate on a specific page doesn’t necessarily indicate something is wrong: maybe most people reading this article found all the answers they need for now and don’t require further exploration, and that’s ok. Context is key, and the strategies featured above will help you discern which web pages need work.
Why should ecommerce sites care about reducing bounce rate?
Satisfying as it may be, reducing bounce rate in ecommerce shouldn’t be about watching your numbers drop below the industry average—see it instead as a customer-centric approach to making sure your visitors have the best possible experience they can while engaging with your ecommerce business.
When you understand and empathize with the real needs of your customers, an improved bounce rate will be a byproduct of you fixing whatever is not currently working for them. Give your customers what they want and need; they’ll reward you by sticking around.
Reduce your ecommerce bounce rate
Hotjar has all the tools you need to understand customer behavior and identify ways to reduce your site’s bounce rate.
Ecommerce bounce rate FAQs
Related articles

Marketing
6 traits of top marketing leaders (and how to cultivate them in yourself)
Stepping into a marketing leadership role can stir up a mix of emotions: excitement, optimism, and, often, a gnawing doubt. "Do I have the right skills to truly lead and inspire?" If you've ever wrestled with these uncertainties, you're not alone.

Hotjar team

Marketing
The 7 best BI tools for marketers in 2024 (and how to use them)
Whether you're sifting through campaign attribution data or reviewing performance reports from different sources, extracting meaningful business insights from vast amounts of data is an often daunting—yet critical—task many marketers face. So how do you efficiently evaluate your results and communicate key learnings?
This is where business intelligence (BI) tools come in, transforming raw data into actionable insights that drive informed, customer-centric decisions.
Hotjar team

Marketing
6 marketing trends that will shape the future of ecommerce in 2023
Today, marketing trends evolve at the speed of technology. Ecommerce businesses that fail to update their marketing strategies to meet consumers where they are in 2023 will be left out of the conversations that drive brand success.

Geoff Whiting