Learn / Blog / Article
The Why Gap: how to see beyond your product analytics
Between product activity and your proposed solution is a gap. Do you fill it with assumptions, opinions, and guesses? Here’s a better way to do it.

Imagine this: You’re home, working remotely, and you’ve got a water leak dripping down from the ceiling. What do you do?
A) Call the plumber to fix your pipes
B) Grab a ladder and fix your roof
C) Wait to see if it stops on its own
D) Build a bathtub under the leak to catch the water
If you picked any of the above options, you need to keep reading. Because none of these are good answers based on the information you’ve got.
Yet time and time again, product teams are doing exactly this: observing user activity in their product >>————— >> then jumping to possible features, patches, or upgrades.
Did you see that big gap between the observation and the solution? That’s what we’re here to talk about today—a.k.a. the information you use to fill that gap.
We call it the Why Gap.
And how you fill it can mean the difference between helping users be badass evangelists of your product and hiring more salespeople because you’ve got a churn that’s just way too high.
We’re here to help you fill your gap.
Fill your Why Gap with product experience insights from Hotjar
Need to go deeper into your users’ minds? Fix the issues your users actually have.

What is the Why Gap?
Let’s start with an example.
Imagine your team is tasked with improving your product’s onboarding flow. You’ve looked into the data and seen that engagement times are down, and the majority of new users aren’t completing the steps as intended.
Now it’s Monday morning, and you’re preparing for your sprint meeting. You’ve got a backlog of possibilities you could focus on:
Fix page load times
Reduce page length
A/B test button colors and placement
Update tooltips and CTA copy
Improve explainer video
Add case studies for inspiration
Add dedicated support chat for onboarding
Add highly-requested feature X
There’s no shortage of solutions. But what’s the problem? What’s causing that water leak in your roof? Now there’s a good question. And it reflects the most agreed upon challenges from a survey of 145 product managers:
“Stakeholders want to talk more about solutions than about problems, but we need to understand the problem first.”
This is the Why Gap—the space between what you want to fix and how you’re going to fix it.
Observation of user behavior (thing to fix)
—Why Gap—
Next action to take (how to fix)
The Why Gap exists in your users’ minds, but it can be revealed through their words and action—and we’ll show you how to do this below.
It’s the reason why users do what they do—or don’t do—in your product. It’s the motivation that pushes people to perform certain actions in your product. It’s the barrier preventing users from accomplishing what they came to do.
These insights sit at the heart of every product decision you make. Here’s why.
Why you need to start with why
When you don’t know why, you focus on the wrong solutions. It becomes a big deal when it comes to prioritizing product improvements.
Understanding your users’ reasons and motivations—their whys—makes the difference between product improvements that actually make a difference and spending time fixing imaginary problems.
Peering inside your users’ heads lets you:
Spot new product opportunities
Get to the bottom of issues quickly
Develop and test hypotheses for unexpected user behavior
Feel confident that you’re prioritizing work that’s needed
More to the point: the why driving user behavior is the input that drives product decisions.
We all know that we should be filling the Why Gap with data. The question is: what kind of data? And where do you find it?
Where traditional product analytics fall short
When it comes to numbers, we’ve got plenty. Some of the most popular data sources for product decision-makers include:
Google Analytics/360
Adobe Analytics
Mixpanel
Amplitude
These are invaluable sources for narrowing in on product strengths and weaknesses. At Hotjar, we routinely use three of those four tools to track new users, monitor conversion funnels, and measure product engagement and retention.
Take Google Analytics, which can tell you how many people came to your site, where they came from, how much time they spent on each page, and so much more.
But Google Analytics also has its shortcomings. One of the biggest: you can’t track individual users. It only provides numbers in aggregate.
This is great for seeing big trends and can tell you a lot about what is happening in your product. But it doesn’t answer why these things are happening.
In other words, Google Analytics doesn’t let you get inside a user’s head.
So what are some other options?
Other data for making product decisions—and their limitations
According to Productboard’s 2021 Product Excellence Report, less than 50% of product teams say they have a process for capturing customer insights and feedback. And Just 17% say that they successfully capture insights and feedback from available sources.
User research is one of those sources and a key force behind product experience insights and UX improvements. But even well planned studies with the right UX research tools have pitfalls.
You can run user testing, but they’re not real users in a real context. So dive into some real UX research examples before getting started.
You can do customer interviews, but then you’re asking people to remember why they acted a certain way. So make sure you write effective UX research questions to avoid confusion and non-actionable results.
And then there’s time. Over 100 product managers identified user research as a top challenge because: “It takes too long to conduct robust user research, so we end up cutting corners.”
So where do teams often end up turning for insights?
One of the most popular gap-fillers: intuition and opinions based on personal preferences. You’ve got a hunch that key features should be more visible. You’re sure that people prefer videos over bullet points.
Another source of product insights: your competitors. They’re doing it, so it must be good, right? Maybe. Or perhaps they’re just guessing what their customers are thinking too.
Sara Parcero, a UX researcher at BridgeforBillions, told us just how risky this is:
We can change a lot of things based on our assumptions, but that's the worst mistake you can make. It's impossible to improve if we don't know how people actually use our product.
The good news? There are tools that give you insights into how individual users think, feel, and behave when they experience your product.
What you need is a little data-backed empathy.
How to mind the (why) gap: four tools to get you started
Pause for a minute and think about how you got here. To arrive at this point, you had to scroll down the page. Along the way, you might have paused to look at an image, or tapped a menu icon, or opened a link in another tab, or scrolled back up to check something you missed.
All of these clicks, scrolls, and taps provide insights into your interests and motivations. They reveal crucial clues that can be used to fill the Why Gap. And this data is available to you, along with other forms of feedback.
At Hotjar, we call it product experience insights. It’s what we do. We build tools to help you unlock empathy for your users by:
Observing real user behavior in a real context (see)
Getting direct user feedback at just the right time (ask)
Here are four tools that can help you peek inside a user’s head for why-gap-closing insights.
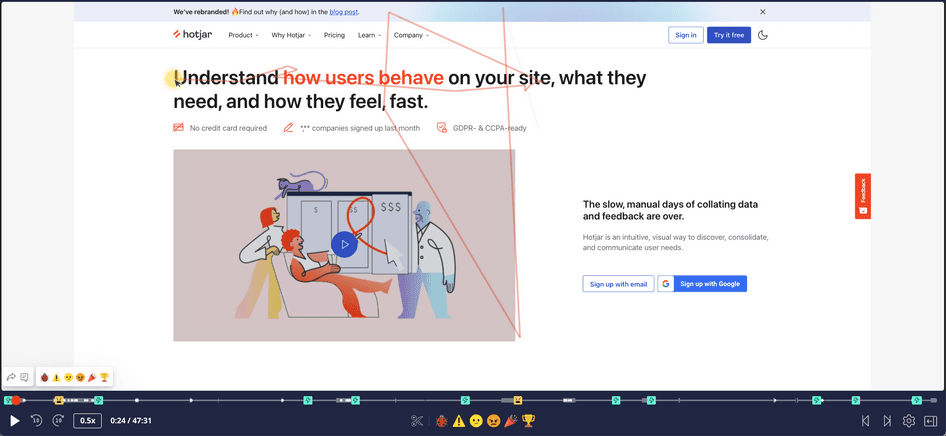
1. Session recordings
Session recordings capture the actions of people who land on your website—on desktop and mobile devices—so you can watch and analyze them later. Mouse movements, clicks, taps, and scrolling behavior across multiple pages reveal insights into a visitor’s interests and motivations. It also reveals where people struggle and when they abandon a page.
Session recordings are a must for your UX optimization toolkit. But we admit we’re biased, so don’t take our word for it. Take it from Megan instead:
Session recordings let me track how users are traveling through a website. I can see where their eyes go around the site. And it helps me understand things like: Do we really need this piece of content? Is anybody actually clicking on this video? If not, then why are we wasting space with it? Hotjar gives me that extra piece of information that numbers and data can't.
Then there’s Sara, who told us about a fun—and effective—way they do something similar:
I started hosting Friday Hotjar parties. We get together to watch session recordings with a list of things to improve in the next sprint—like optimizing the payment part of the funnel or a new feature we just launched. Then we have a brainstorming session to plan our next steps.
Sometimes session recordings can be a big eye-opener, as Dom shared here:
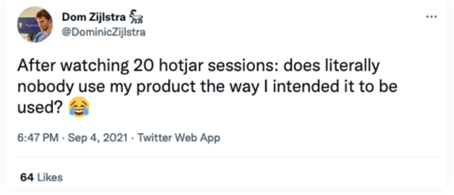
Now that’s information you want to know.
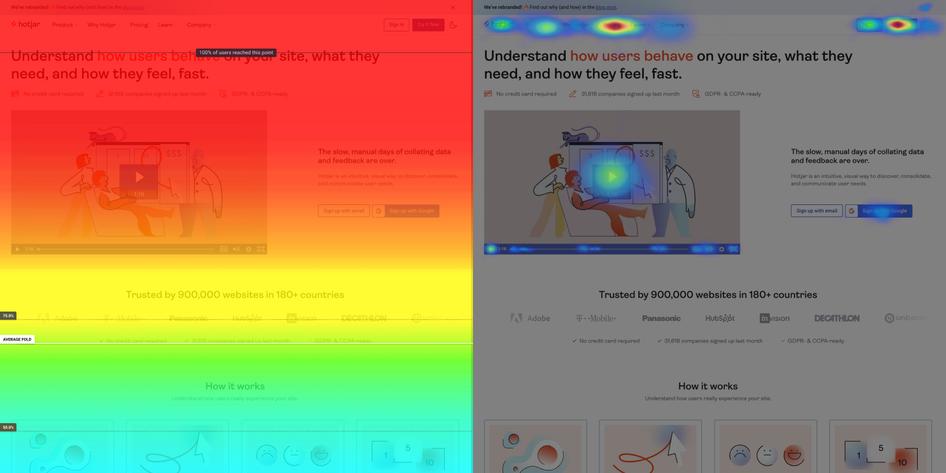
2. Heatmaps, scrollmaps, and clickmaps
Heatmaps show you which areas of your website people interact with the most (hot) and least (cold). It’s a color-coded representation that reveals what engages your users and what gets ignored completely.
Where are people clicking? How far down are they scrolling? What images and copy are grabbing their attention? Answers to these questions give you a clearer understanding of what to change, what to start A/B testing, and what to improve on your site.
Dima Yerebakan, a product manager at Turnitin, shared a specific example of how click maps helped his team create better product experiences for their users:
By observing a user clicking a specific button 10 or 20 times, we were able to see that he didn’t understand that his browser was blocking the popup.
Heatmaps are so cool, our Director of Brand, Christian, occasionally dresses up like one for fun:

Visualizing your coworkers dressed up like heatmaps might induce laughter. But visualizing your users’ behavior directly can provide clear pointers toward what you need to fix next.
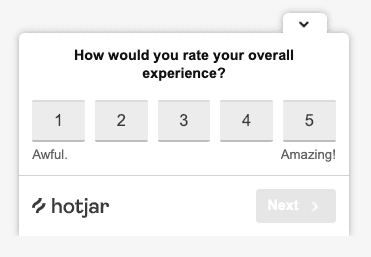
3. Surveys and polls
Sometimes the best way to know what someone’s thinking is to ask. Curious if an idea you have is something that people actually want? Wondering why someone just canceled their account? Just ask.
Easy-to-make surveys can be embedded on any page to get a quick pulse of a user’s thoughts, feelings, frustrations, and desires—the whys that drive their behavior.
Creating insightful surveys has a lot to do with asking good questions. If you need help or inspiration, here are some interesting survey examples and questions from a bunch of brands you know.
And speaking of brands you know, here’s Eric Peters from HubSpot Academy:
The feedback collected from the Hotjar Survey gave us enough confidence to begin designing the new page template. Ultimately, we saw a 10% uplift in conversions.
4. Incoming feedback with context
When you just need a quick opinion or simple pulse check, sometimes quick-click feedback is enough. Incoming feedback can also provide the additional in-context why to point you right to the areas that need improvement, or that visitors already love.
Did you know that visitors can highlight parts of your site and share it directly with you, along with their comments?
Daniel Slowacek, now the head of product design at Adidas, tells us it’s not hard to do:
There are lots of ways that Hotjar helps us with user research and improving user experience, like on-site surveys and quick polls that are easy to set up
These qualitative insights don’t substitute your traditional quantitative analytics. They just help you polish the what into a why, as Mitch Bowser at Seattle Children's Hospital told us:
We use Hotjar to get additional context than raw numbers, like time on page, typically give. It’s a way to go a little bit deeper than that.
In other words, instead of numbers, you get insights.
All of these product experience insights tools—session recordings, heatmaps, surveys, and incoming feedback—provide insights into user behavior. And when used together, you can go even deeper. Like analyzing session recordings only for users who reported a poor experience.
So when you show up in that sprint meeting, you’ll know how to mind that gap.
Better product decisions start with smaller gaps
Between the activity in your product and the actions you take to improve it, is a gap—a Why Gap.
Without the right data filling that gap, product teams substitute their own experiences—opinions, preferences, past successes—for real customer needs. And that’s a problem.
Because most product failures can be traced back to a misunderstanding—or outright ignorance—of what people actually care about.
But there’s another way.
It starts with awareness of the Why Gap that’s staring at you in every planning session you walk into. And now you have the tools to fill it with your customers’ thoughts, feelings, and needs.
And the better you understand your users, the more likely they are to love the products you make.
Which means they stick around longer, spend more, and tell their friends. And when they do, you just might hear them say: “It’s almost as if they can read my mind.”
Now go fix that ceiling leak.
Do you have a Why Gap?
Fill your Why Gap with product experience insights from Hotjar—and start fixing the issues users really have.
The Why Gap FAQs
Related articles

Behind the scenes
The ultimate HOTSAUCE roundup
Leading minds in product, marketing, ecommerce, and UX came together over two days to shape the future of digital experiences at HOTSAUCE—Hotjar's inaugural in-person conference. Couldn’t make or want to relive the magic one more time? Take a trip through the event from the lens of the people there—Hotjar’s core planning team, speakers, and attendees—and read about their favorite moments, top learnings, and what they’re looking forward to at HOTSAUCE 2024.
Hotjar team

Behind the scenes
Celebrating Pride Month in 2023: the Hotjar Pride Panel
Here at Hotjar, we stand for an inclusive culture where our team members experience the psychological safety necessary to express themselves fully at work.
Guided by this principle, we have a long-standing tradition of celebrating Pride Month with initiatives proposed and curated by our internal LGBTQIA+ group.
Hotjar team

Behind the scenes
How to create a customer success program from scratch
Building a customer success program for the first time? Learn from Hotjar’s experiences to make your customer success program a winner.

Coleen Bachi