Learn / Guides / Customer analytics guide
A guide to ecommerce customer analytics: tracking key metrics to drive conversions
Customer analytics are key in ecommerce. Analyzing your buyers’ behavior, motivations, and engagement helps you understand what your customers need and spot opportunities to optimize your product or website.
But it can be hard to know exactly which metrics will really help you track the effectiveness of your ecommerce journey and get you the data you need to boost your customer experience (CX).

We’ve written a comprehensive guide to ecommerce customer analytics to help you track the right metrics for your online business and get all the insights you need to increase conversions and deliver a great user experience (UX).
Optimize your ecommerce store with customer insights
Hotjar’s product experience insights show you exactly how users experience your website, helping you make changes to improve it.

11 customer analytics metrics you should track for ecommerce
The best customer analytics combine qualitative and quantitative data. This involves monitoring statistics and customer patterns and combining this quantitative information with voice-of-the-customer (VoC) data.
Below, we explore various metrics your business can use to track ecommerce customer success, covering the full customer journey—from customer engagement metrics to checkout analytics and customer satisfaction and retention metrics.
Key 'customer engagement' metrics your online business needs to track
Engagement metrics tell you how active users are on your ecommerce site: whether they’re clicking on web or product pages, making purchases, watching your product demos, or reading blog posts.
Tracking engagement metrics gives you valuable insights into your users' product experience (PX) and whether your content and site design are compelling enough to move them through the customer journey.
1. Time on page
Time on page refers to the time a user spends on a single page. It’s calculated by tracking when a user lands on a page and timing how long it takes for them to click on the next one.
Use customer analytics software—like Google Analytics (GA)—to calculate time on page for your ecommerce web pages to determine if you’re cultivating an engaging online customer experience.
For example, let’s say you’ve created a landing page promoting a new product launch for your ecommerce store. If you have a low time on page rate for your new landing page, it’s a good indicator you’re not engaging customers with your product, messaging, or web design. As well as landing pages, you’ll want to track time on product pages, checkout pages, and conversion content, like blogs.
For optimal results, combine customer analytics with Hotjar (👋) Recordings of user sessions to get a firsthand look at how users experience your key pages—showing you what to optimize to better attract customers.
2. Page visits
Calculate page visits by measuring the number of times a user lands on a page from an external source, like a search engine or advertisement. Tracking page visits tells you whether you’re creating an exciting customer experience by telling you how popular each page is.
Track page visits with analytics tools to understand which pages perform the best, and which you need to optimize. Next, use Hotjar Surveys to go deeper into your users' rationale and motivations, and find out why they’re engaging with certain pages over others to drive customer-centric experiences.
3. Conversion rate
Measure your ecommerce store's conversion rate by dividing the number of online users who convert divided by the total number of users to understand how well you’re selling your product to customers, and whether your ecommerce customer journey is effective, intuitive, and responsive.
A low conversion rate is a strong indication that you need to better understand your customers and their behavior and make changes on your website according to your user findings.
For example, traditional web analytics tools might tell you that you have a ton of users visiting your landing page but no conversions. Combine your customer analytics with product experience insights from Hotjar Surveys to ask users directly about their experience to find out what’s going wrong. Maybe you discover broken CTA links or site glitches that are blocking them from converting—and there’s a quick fix. Or maybe you find your messaging isn’t compelling them to convert, and you need to add more relevant use cases to your page.

4. Drop-off rate
Drop off rate tells you how many users abandoned a desired action on your website, like submitting a newsletter or discount signup form, or completing a purchase. But how do you calculate your website's drop-off rate? Take the total number of users who abandon an action and divide it by the total number of users who complete an action.
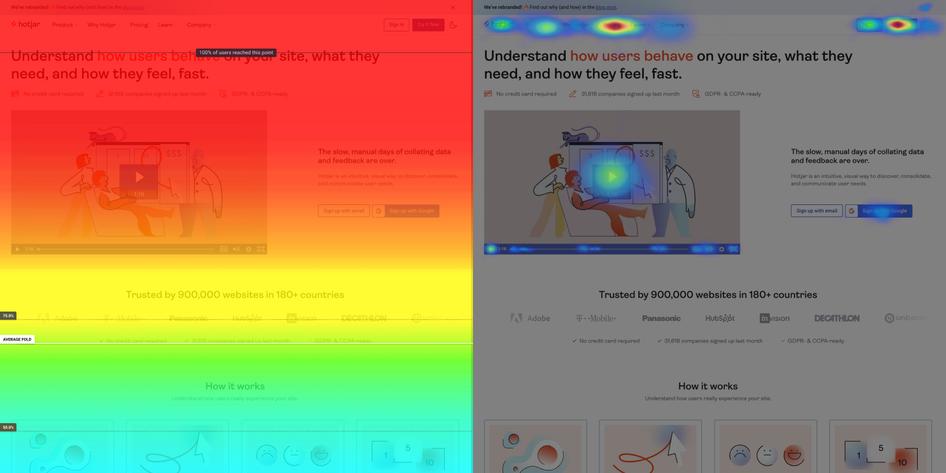
Once you’ve calculated your drop-off rate, use Hotjar Heatmaps to show you where customers click and how far down they scroll on your web pages to find out what draws attention and where users lose interest.
5. Bounce rate
Bounce rate is the percentage of users who leave a webpage without initiating an action. A high bounce rate may indicate that your online store experience isn’t delivering on content, user experience, copy, or web design.
Use Google Analytics to measure your bounce rate and get an overall sense of whether you’re engaging your users. Then use product experience insights tools to dive deeper into what customers need, how they experience your site, and why they’re bouncing.
For example, analyzing responses to Hotjar Surveys could show customers bouncing because they searched for an informational article on what types of hiking gear to buy, and landed directly on your product page selling hiking gear they weren't yet ready to purchase.
In this case, your store could be ranking for keywords that aren’t relevant to your specific pages or offering, causing users to click away and negatively impacting your bounce rate. Qualitative insights are crucial to put metrics like bounce rate in context.
Key customer analytics checkout metrics for ecommerce stores
Checkout metrics are essential for any ecommerce business to track, as they show how well users flow through the purchasing process and complete your desired checkout goal.
1. Cart abandonment rate
Cart abandonment rate measures the total number of completed purchases divided by the number of initiated transactions. This metric tells you whether you’re facilitating a seamless customer experience or whether users are running into bugs, glitches, or distractions during checkout.
Use tools like Woopra to calculate your cart abandonment rate. Then, use Hotjar to watch Session Recordings of your checkout pages to see where customers get stuck or drop off to quickly improve your checkout experience without negatively impacting sales.
💡Pro tip: use Hotjar's Observe tools—like Session Recordings—to watch users as they navigate your checkout process. Then, set Surveys to ask them about their customer experience as they’re abandoning their cart or dropping off to get the user-backed insights you need to streamline key ecommerce pages and boost conversions.
2. Repeat purchase rate
Your repeat purchase rate tells you the percentage of customers that have purchased more than once from your ecommerce store.
Track your repeat purchase rate on GA to see if you’re retaining customers. Then, ask users to rate their experience with your store or product using feedback tools to see if they’re satisfied with their experience and what you could do to improve their journey.
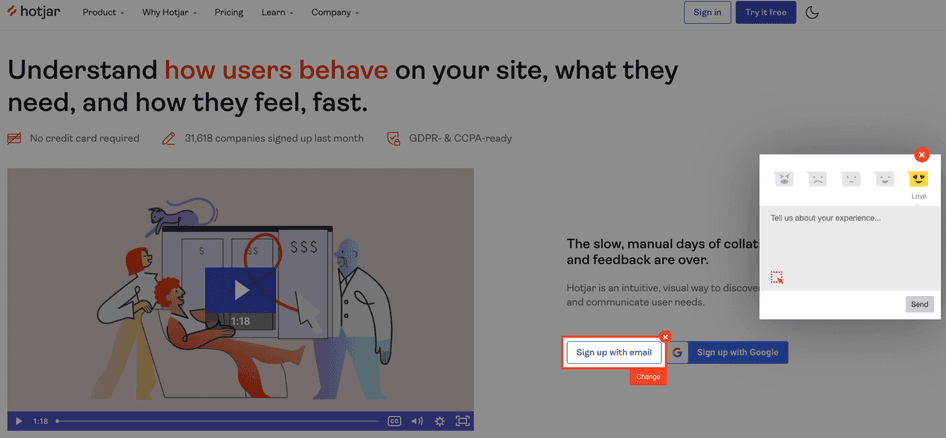
Hotjar's Feedback widget even lets users highlight parts of the page they like or dislike, so you know exactly what to focus on to get more repeat business.
3. Average order value
Your average order value (AOV) represents the average amount customers spend per order on your ecommerce store which you calculate by dividing your total revenue by the number of orders.
Track AOV to determine if customers are willing to pay for your products or services. If not, it might indicate that you’re not meeting your target audiences’ needs or effectively conveying the value of your product. This can also be an indicator to conduct market research to determine if you’re at the right price point.
Customer satisfaction and retention metrics to track
Below we list key customer satisfaction metrics, which will show you if you’re on track with meeting your users’ needs and creating a delightful experience they’ll come back for.
1. CSAT
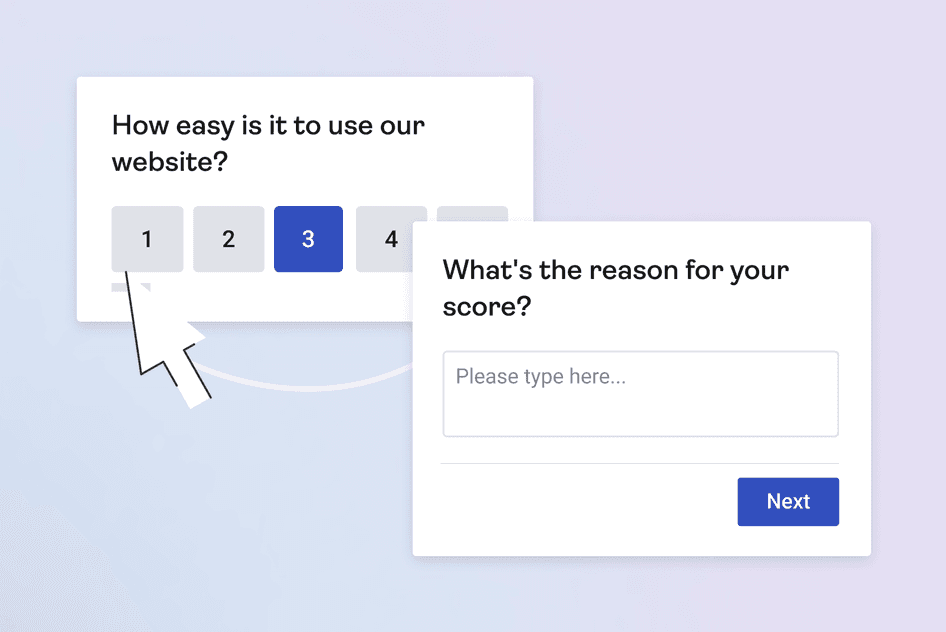
Customer satisfaction scores (CSAT) tell you how satisfied customers are with your product, service, or customer experience. CSAT scores are collected by asking users to rate their experience, either choosing from a scale of 0-5, or satisfied/dissatisfied and yes/no options.
CSAT scores help ecommerce teams measure and understand short-term customer satisfaction levels. Place CSAT Surveys at key moments throughout the customer journey—like checkout or product pages—to better gauge both overall satisfaction levels and how happy your users are with micro-experiences (like finding a product) on your site.
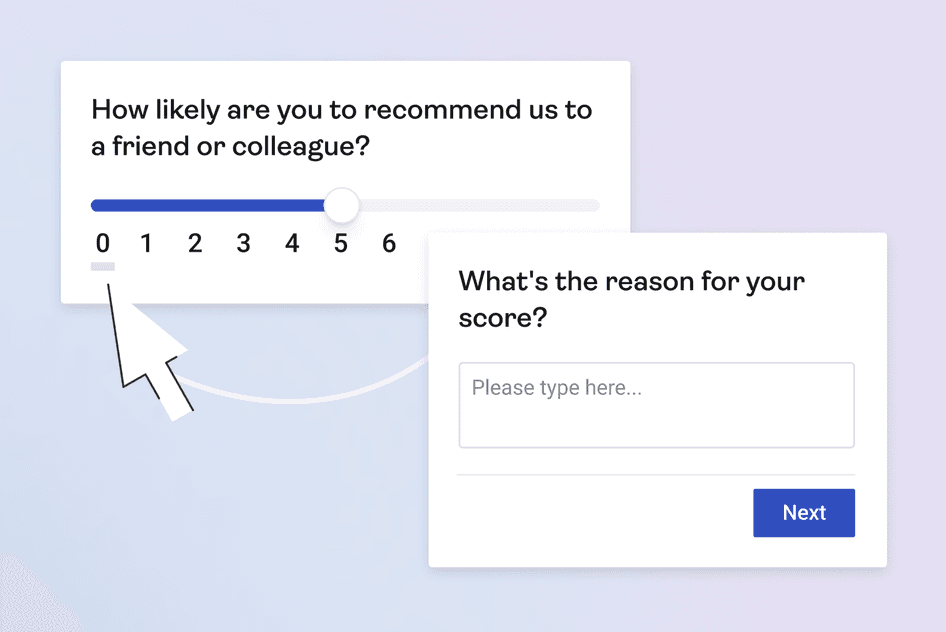
2. NPS
Measure your Net Promoter Score® (NPS) by asking customers how likely they are to recommend your product or service on a scale of 0-10.
NPS scores help you understand your customer loyalty levels, learn what impacts customer perception, and foster a happier customer base.
Use Hotjar to build effective NPS Surveys that let customers elaborate on their scores in their own words to get a better understanding of customer sentiments and behavior.
3. Monthly active users
The monthly active users (MAU) key performance indicator measures the number of visitors who interacted with your brand’s product or service over a period of 30 days. Calculate your MAU ratio by dividing the number of daily active users by the number of visitors who interacted and multiplying it by 100, or by using web analytics tools.
Then, learn how your users are engaging with your site. For example, you might want to survey users about how easy it is to navigate your product pages or observe them as they explore your checkout process to make customer-centered decisions and improve your MAU.
Turbocharge your customer analytics with qualitative user insights
Figuring out the right metrics to track for your unique ecommerce business depends on your organizational goals and customer needs.
Use traditional web analytics to first find out what your customers are doing and where your user experience might be falling short. Then, combine hard numbers with a boost from qualitative product experience insights by digging deeper into customer patterns and behavior to help you understand what’s driving your users and the product value they get from you.
Optimize your ecommerce store with customer insights
Hotjar’s product experience insights show you exactly how users experience your website, helping you make changes to improve it.