Learn / Guides / Customer journey mapping (CJM) guide
21 customer journey KPIs to track to improve PX
You want to improve your customers’ journey through your site or product page—and you know that what’s measured can also be managed and improved. But with so many customer data points available, what should you measure? It’s hard to know where to start—or what to track.

We’ve put together a guide on the most important key performance indicators (KPIs) to help you measure the success of your customer journey and connect the dots between your users and your business objectives to understand how to improve your customer's experience at every stage.
Improve your customer journey with product experience insights
Use Hotjar to understand how real users are experiencing your website—then optimize their journey!

21 customer journey KPIs to track user success
KPIs measure how well your business or team is achieving your most important user and company goals. KPI metrics act as progress milestones that show whether you’re meeting your targets, helping you make data-informed decisions.
Tracking quantifiable, user-centric KPIs across the customer journey helps you understand whether you’re converting and retaining users, and how you can improve the customer experience.
We’ve created a ‘KPI starter pack’ for your business: learn which metrics to track—and how—at every point in the buyer’s journey, from the awareness, consideration, decision, and retention stages right through to post-purchase advocacy.
Let’s get started!
7 KPIs for measuring the awareness stage
At this stage, your potential customers are aware that they have a specific need or problem they need solving and have usually started researching answers to their questions when they come across your company or website.
Use the following KPIs to track how well you’re engaging awareness-stage users to find your site and consider your brand as a possible solution to their pain points.
1. Impressions
Impressions are metrics that quantify the number of times your content is displayed to users, regardless of whether they click on it or not. Every time a piece of content is shown to a user, it counts as an impression—so one user can have multiple impressions of one ad, page, post, or media element.
Measuring impressions gives you insight into your findability, search ranking, web traffic, and content shareability.
Use tools like Google Analytics to track impressions on your website, content, product pages, and ads.
How to optimize impressions:
Emphasize quality: great, shareable content is shown to more users—use targeted copy, keywords, and segmenting to make sure your content helps users achieve their goals.
Focus on keyword match types: you don’t just want impressions: you want to get your content in front of hyper-relevant, qualified users. Use a mix of keyword match types (like broad, phrase, and exact types) to discover new search queries and get a good impression share.
Geo-targeting: market your content to target a certain region that’s relevant to your ideal customer profile to reach more users within that area.
Create engaging headlines: use emotional words, numbers, questions, or how-to and listicle headlines to attract customers.
2. Cost per 1,000 impressions (CPM)
CPM refers to the price of 1,000 impressions on a web page: it helps you understand how many users are seeing your content, relative to its cost, to help you decide what to invest in for maximum visibility and impact.
You can use free CPM calculators like WebFX or ClickZ—or this formula to calculate CPM:
CPM = Total cost of campaign / (Total number of impressions/1000)
How to optimize CPM:
Use A/B testing tools: test out different content, banner, and website visuals and copy on your users to see what’s working and what you could improve to save money on pages or campaigns that don’t grab your users' attention.
Add a CTA: make sure you’re adding attractive calls to action (CTAs) on your product pages so users know what action to take when they see them, helping your business drive conversions. Use Hotjar's Observe tools—like Heatmaps—to understand where to place your CTAs so they get more user attention and traction.
3. Reach
Reach describes the number of potential users who could possibly see your content, helping you figure out if the cost of the content or campaign is worth the number of new users it might attract. Reach can be measured over various channels or campaigns: for example, you can measure reach for your social media, your blog, your landing pages, and specific marketing or ad campaigns.
Understanding your reach helps you increase brand awareness, minimize campaign risk, fine-tune your messaging, and maximize your resources.
Use tools like Google Adwords to quantify your reach for specific campaigns or calculate it yourself:
Reach = impressions/frequency
How to optimize your reach:
Make your website relatable: create strong content and web pages relevant to your users so they'll want to share it on their channels.
Master referral marketing: delighted users help you spread the word about your brand or website, and grow your reach. According to HubSpot, 90% of people trust suggestions from family and friends, which means that referrals help you sustainably grow your product awareness and increase conversion rates.
Partner with other brands: increase your network by working with other businesses that target a similar audience.
4. SEO ranking
Your Search Engine Optimization (SEO) ranking shows how visible your content is to users who are ‘organically’ searching for relevant terms. A strong SEO ranking also gets you prime positioning on Search Engine Results Pages (SERPs).
If your content or website doesn’t appear on the first few pages of search engines like Google when users look for potential answers to their problems, they’ll be less likely to turn to your solution.
Many factors influence your SEO ranking: having a secure and accessible website, page speed, mobile-friendliness, optimized content and keywords, domain authority, user experience (UX), and backlinks.
Use tools like Google Analytics, SEMrush, and Moz to measure your SEO ranking, taking all these factors into account to help identify areas of improvement.
How to optimize your SEO ranking:
Optimize your URLs and content: make sure your ‘slug’ (the part of the URL that identifies a particular page) includes important keywords and shows users what your page is about. Optimize your content with tools like Google Search Console.
Focus on content quality: high-quality content ranks better on search engines. Make sure your content is well-researched, educational, and useful to users.
Use relevant keywords: keep your keywords focused and relevant to your content.
Improve your page loading times: test and optimize your page speed to 2 seconds or less to prevent users from bouncing.
Make your website mobile-friendly: a responsive website will help you reach mobile users. Use the Google Mobile-Friendly Test to make sure you’re optimized for cell phone devices.
5. Bounce rate
A website’s bounce rate tells you the number of users who leave a web page without performing an action. Seeing a high bounce rate indicates you’re not attracting the right customers to your website, or that you’re failing to keep them engaged. An increasing bounce rate could mean there are problem areas on your website: users may be leaving due to poor website usability, slow page speed, unnecessary pop-ups, or low-quality content.
Calculate bounce rate by dividing the number of single-page sessions by the number of total sessions on your site. For example, if 1,000 users land on your site (total sessions) and 60 of them leave without performing an action (single-page sessions), your bounce rate is 6%.
How to optimize your bounce rate:
Improve UX: make website elements findable, create a responsive design, build intuitive navigation, and remove unnecessary pop-ups or plugins to make the user experience more enjoyable.
Include strong CTAs: if you’ve enticed users to click on your website, don’t lose them with a weak call to action that doesn’t encourage them to keep browsing. Make your CTAs relevant to your content so they hit home with your audience and help them make the crucial next step to converting.
Make your content consistent and high value: update your content regularly and make sure it’s high-quality to provide users with real value before they’ve even made a purchase.
Improve your brand storytelling: ensure your brand story is relatable and your product experience (PX) is interesting and emotionally compelling to establish a real connection between users and your brand and mission.
Pro tip: use Hotjar's Observe tools—like Session Recordings—to dig deeper into understanding why users bounce.
Bounce rates are good indicators that something might be wrong: but considered alone, they tell you very little about what’s really happening on your site. Recordings help you put bounce rate metrics into context by showing you playbacks of how users are navigating individual web pages and what’s blocking them.
Once you’ve learned what’s making users click or ‘bounce’ away, use your targeted insights to optimize key pages and site elements and remove blockers.
6. Time on page
Time on page KPIs measure how much time users spend on each web page, helping you determine your business's best-performing or most engaging pages, and which ones you need to improve. It also tells you if you’re attracting the right users to your site, or whether they're just false leads.
Use tools like Google Analytics to determine your time on page metric.
7. Pages per visit
The pages per visit on a website indicate the average number of web pages a user visits during their session. When the average user is interested in exploring your site beyond the homepage or landing page they arrive at, it’s a good sign you’re engaging visitors.
Calculate pages per visit by taking the total number of page views and dividing it by the total number of sessions.
How to optimize time on page and pages per visit:
Make your web pages more engaging: ensure you’re giving users a consistent, engaging product experience. Do this by focusing on intuitive and pleasing design, easy navigation, and interactive elements on your site.
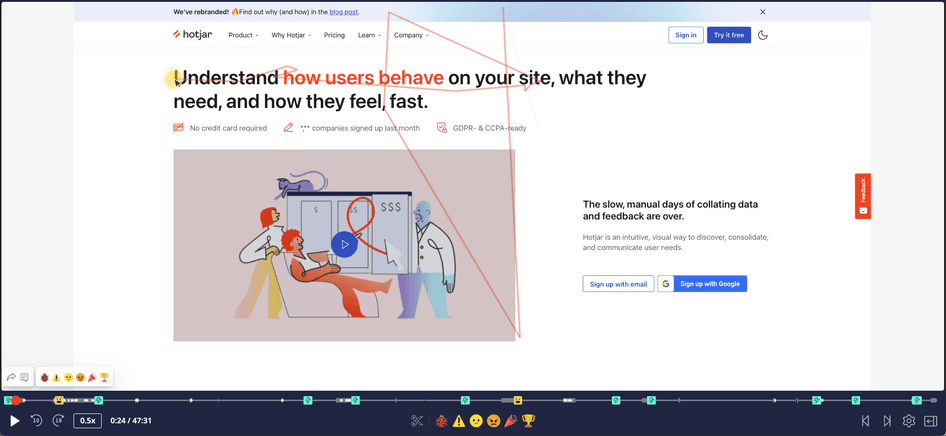
Session recordings: watch as users navigate your site with Hotjar Recordings to know which pages to optimize to improve user delight.
4 KPIs for measuring the customer journey's consideration stage
At the consideration stage, potential buyers start comparing and analyzing existing options: they’re probably aware of some of the options they can choose from but haven’t yet made up their mind.
Because the consideration stage involves several different customer journey touchpoints, your business needs to offer a strong product offering and great content marketing and messaging.
So, what are some of the KPIs you need to use to measure your website’s success when users are considering buying your product?
1. Clicks
Clicks show visitors engaging with website elements, media content, links, and CTAs: a click means a user is looking to trigger an action.
Analyze clicks with tools like Hotjar Heatmaps and Recordings, which give you deep insights into exactly how users click, move, and scroll through your site.
How to optimize clicks:
Session Recordings: Hotjar Recordings let you watch full user sessions to determine what’s driving clicks. For example, if you see users ’rage-clicking’, on a non-responsive site element, but failing to click on your CTA, it’s a good indicator there’s navigation confusion or a broken link.
Heatmaps: Hotjar Heatmaps give you context into which key elements, features, and CTAs users are clicking on and which they’re ignoring to help you make effective changes that drive conversions.
2. Click-through rate (CTR)
Click-through rate measures the number of clicks on a specific link to the number of times users were exposed to the link (the number of impressions). Here’s a simple formula for calculating CTR:
CTR = (click-throughs / impressions) x 100
Use CTR to measure the success of CTAs on your landing pages, pay-per-click search results, or hyperlinks in email campaigns or blog posts.
Measuring click-through rate helps you better understand whether users are taking key actions or not, so you know what works (and what doesn’t) on your website or product pages.
How to optimize CTR:
Optimize headlines and copy: use a maximum of two focus keywords in your headline and copy. Make sure your content is designed to appeal to users, not just to search engines, by addressing and solving their problems.
Use images: break up text with attractive images or visuals to engage users.
Include clear, attractive CTAs so users know exactly where to click: write targeted CTAs that compel visitors to click, and position them clearly above the fold.
3. Cost-per-click (CPC)
CPC measures the amount of money you pay for each click in pay-per-click (PPC) marketing campaigns to help you target the right users and get a return on your investment.
You can calculate CPC by dividing the total cost of an ad, post, or campaign element by the number of clicks it gets.
How to optimize CPC:
Improve your Quality Score: your Quality Score is an estimate of the quality of your ads, keywords, and landing pages. Improving the quality of each directly impacts your cost-per-click.
Bid on long-tail keywords: use ‘long-tail’ keywords—like questions or longer search queries—to reduce your cost-per-click. Since ad placement is ‘auctioned’, this means bidding on long-tail search queries relevant to your business.
Schedule your ads: make sure your ads are displayed at times when your users are active and converting.
4. Engagement rate
Tracking engagement rates shows you how involved users are with your content—you know users are engaged when they comment, ‘like’, or share your content.
This shows you how effective your website and brand campaigns are since users who show high interest by spending time interacting with blogs, videos, and product pages are more likely to convert.
Measuring engagement on social media is calculated by dividing the total engagement by total followers, multiplied by 100.
Measuring interaction on your website can be tricky, as there are many metrics that fall under the category. Use tools like Google Analytics to help you measure engagement by aggregating other metrics such as time spent on page, clicks, open rate, and click-through rate.
How to optimize engagement rate:
Use web analytics: Google Analytics will give you insights into which page and website elements you need to optimize.
Use Session Recordings: Hotjar Recordings give you an in-depth window into how users interact with your website across an entire session. This helps you spot problem areas on your site, such as pages that load incorrectly on certain browsers or devices, broken or missing page elements, and unclear or confusing functionality—like a login timeout that’s causing user frustration. Then, you can make improvements that keep your users engaged.
3 KPIs for measuring the customer journey's decision stage
At this stage, your prospect is ready to make the final decision about their purchase.
Customer testimonials, case studies, reviews, and a great checkout experience all play a critical role in winning your user over so they convert into paying customers.
Let’s explore the KPIs you can use to measure your success at the conversion decision stage:
1. Conversion rate
Your conversion rate is the percentage of users that complete a desired conversion action out of your total number of website visitors.
A good conversion rate indicates that you’re successfully targeting the right people with the right solution and giving them a compelling, friction-free customer experience.
How to optimize your conversion rate:
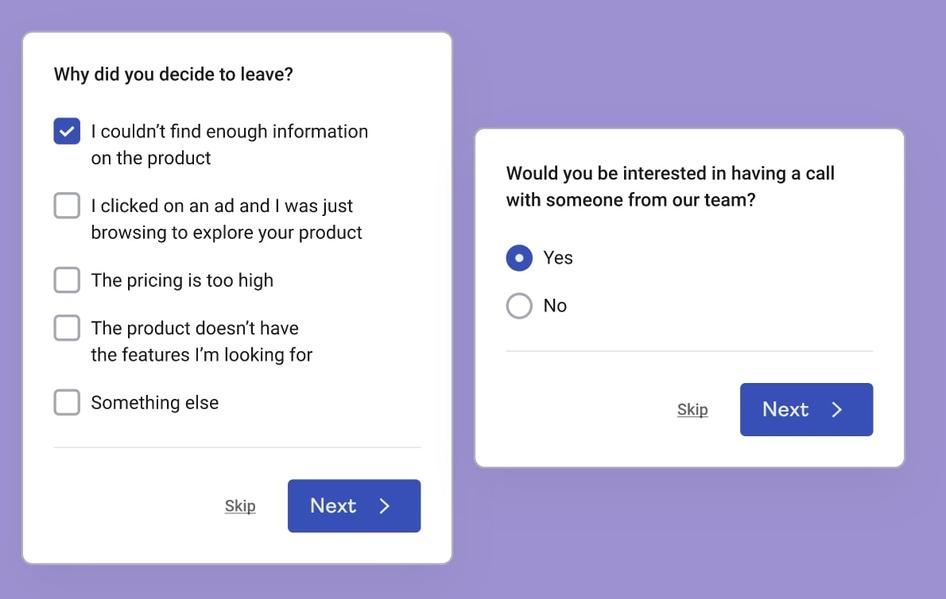
1. Find out why users aren’t converting: use Hotjar's Survey tools to place an exit-intent survey on your website that asks visitors why they’re leaving a page or abandoning their cart. Understanding why users aren’t converting gives you valuable insight into what to fix to remove blockers, improve their product experience, and promote future conversions.
2. A/B tests: test your site’s CTAs, landing pages, buttons, and key elements to see which variations drive the most conversions.
3. Use high-quality product images: users won’t be tempted to convert if they’re looking at poor-quality images. Invest in professional product images to improve conversions.
4. Optimize your headline: make sure your headline clearly communicates your product's value proposition.
2. Sales
Making a high number of sales transactions in a specific time period is a good sign you’re succeeding at converting users into customers at the decision stage.
Here’s a simple formula to calculate your sales total:
Sales = Number of units sold x average selling price per unit
How to optimize sales:
Track and analyze sales data: use sales analytics software to track and analyze your sales data and make data-driven user decisions that drive more revenue.
Add testimonials, reviews, and logos: use social proof to build confidence in your users—if your product has helped others, it could also help them.
Listen to your users: get to know your audience and what they experience with Hotjar's Ask tools to tailor your solution and marketing to user needs.
3. Cost per conversion (CPC)
Cost per conversion refers to the total cost of a website element or advertisement in relation to the conversions it drives.
You can calculate the CPC with this easy formula:
Cost per conversion = Total cost of ads, content, or media/number of conversions
Calculating CPC helps you understand how well your ads, posts, and other media are performing. A high CPC means you’re spending more than you’re converting, while a low CPC means your ads and content are optimized for your target buyers.
How to optimize your CPC:
Focus on your best-performing pages: use web analytics to determine which pages convert the most. Refocus your budget to spend more promoting those pages.
Figure out the best time to display ads and conversion content: use analytics to tell you when users are most active, and show key promotional content during those specific times.
5 KPIs for measuring customer retention
This is arguably the most important stage in the buyer’s journey—by simply retaining your existing customers, you can support sustainable business growth.
According to research done by Frederick Reichheld at Bain & Company (the inventor of the Net Promoter Score®), increasing customer retention rates by 5% increases profits by 25% to 95%.
Use the following KPIs to track and measure your customer retention rates to understand what keeps customers satisfied and improve the customer experience:
Pro tip: use Hotjar churn Surveys to get feedback from product users who decide to cancel their subscriptions or memberships to pinpoint what’s not working for them and make changes to prevent cancellations.
1. Customer loyalty
Customer loyalty measures a customer’s likelihood to do repeat business with your company. It’s a significant metric that speaks to your ability to provide value and positive experiences to your users.
You can measure customer loyalty by calculating the number of customers who have purchased more than four times in a year and dividing it by the number of unique customers in the same time period.
How to optimize customer loyalty:
Provide value: always look for ways to add value to your users’ experience and better solve their pain points.
Increase responsiveness: support your customers with excellent customer service.
Reward your customers: let your customers know you value their loyalty and create a loyalty rewards program that provides users with exclusive gifts, discounts, and offers.
2. Customer satisfaction
Customer Satisfaction Score (CSAT) is a short-term measure of whether your product, service, and user experience meets user needs.
You can measure CSAT scores by asking users to rate their experience on scales of one to 10, poor to excellent, or whatever metric you choose.
Use Hotjar CSAT surveys to easily gauge satisfaction levels and customize surveys to fit your unique business and user needs.
How to optimize customer satisfaction:
Experience the journey yourself: go through all the touchpoints your users experience on their customer journey to get a closer look at what you could enhance. Use Hotjar Recordings to follow your users through their journey and get firsthand insights into journey-specific improvements.
Offer multi-channel help: make sure you’re equipping your users with educational videos, documents, information hubs, and other supporting elements to guide them through product adoption.
3. Net Promoter Score® (NPS)
Net Promoter Score® is a metric used to gauge customer loyalty, satisfaction, and excitement with a company that’s calculated by asking customers one question: “On a scale of 0 to 10, how likely are you to recommend this company/product to a friend or colleague?”
Use tools like Hotjar's on-page NPS Surveys to track and measure NPS scores and visualize how your NPS is trending over time.

How to optimize NPS scores:
Use NPS feedback: implement the feedback you receive from your NPS surveys to drive improvements and meet user needs. With Hotjar Survey tools, you can ask users why they’ve given you a specific score to understand what you’re doing well and what you could do better.
Conduct root cause analysis: identify the main causes of problems your users face to prevent them from happening in the future.
4. Customer lifetime value (CLV)
Customer lifetime value measures the revenue generated over the lifecycle of a customer’s relationship with your company: tracking your CLV tells you how profitable your business is.
Measure CLV by calculating the average purchase value and multiplying it by the average number of purchases.
How to optimize customer lifetime value:
Improve onboarding experience: a poor onboarding experience leads to customer churn—continually test onboarding experiences to streamline product adoption.
Improve UX: constantly look for ways to improve the user's experience for them to seamlessly navigate your site and product pages.
Live chat support: respond to your customers swiftly, every time, to ease user frustration fast.
Keep communication relevant: don’t send customers emails just to fill their inboxes. Keep your marketing emails value-based and to the point.
5. Feedback
Tracking customer feedback is important to understand the quality of your users' product experience.
Use surveys, interviews, and feedback forms to gauge how well you’re meeting user needs and what you could do to improve the user experience.
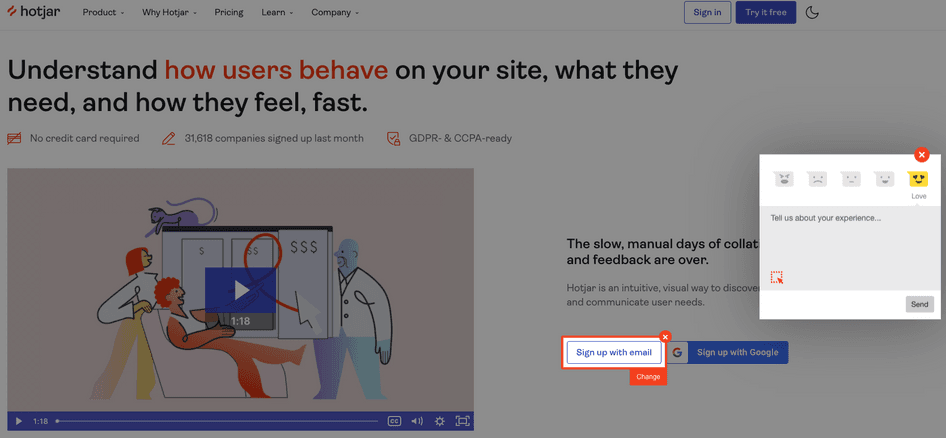
Hotjar Surveys and Feedback tools let you access user feedback ‘in the wild’, as users navigate your website and product pages, giving you actionable insights while their experience is still fresh to help you make customer-centric changes with major impact.
How to optimize user feedback:
Ask a mix of open- and closed-ended questions: ask your users a range of survey questions to get a granular understanding of their experience and possible enhancements.
Make surveys short: don’t bombard users with long surveys that deter them from participating.
Use feedback tools: use integrated, non-intrusive feedback tools—like Hotjar's Feedback widgets—where users can quickly and easily provide their inputs.
2 KPIs for measuring customer advocacy
Advocacy is an important customer journey stage: it means your customer is so delighted with their experience that they become an active cheerleader for your product and brand with their contacts.
Below, we look at KPIs you can use to measure customer advocacy to turn users into promoters for your product.
1. Referrals
Customer referrals build user trust in your brand and compel visitors to convert. The number of referrals your brand gets tells you you’re delighting users—while generating high-quality leads for your business.
To calculate the referral rate, find out the number of referred purchases divided by the total number of purchases. Ask users if they were referred to your product or brand, or how they heard about you with Hotjar Survey and Feedback forms.
How to optimize referrals:
Gamify your referral program: make it easy for users to refer your brand with rewards, or points that count toward a discount per referral.
NPS surveys: use Hotjar NPS Surveys to get insight into how likely users are to refer or recommend your product or brand.
2. NPS
As mentioned above, measure your net promoter score with NPS surveys that ask customers if they’d recommend your product or brand for direct insight into how well you’re retaining customers and meeting their needs.
Tips on identifying KPIs for your business
KPIs should be tailored to your specific business objectives and user needs. So how can you identify the best KPIs for you?
Use web analytics tools to look into the behavior patterns of users who converted
Use product experience insights tools like Hotjar to ask your customers about their decision-making process: which factors were they paying attention to at each stage?
Use this combined data to see which metrics are most likely to predict a successful customer journey, and use these as your KPI
Determine business and user objectives by setting Specific, Measurable, Achievable, Relevant, and Time-bound (SMART) goals and aligning them to your KPIs
Use qualitative (feedback & surveys) and quantitative (analytics) data to inform your KPIs
Pitfalls to avoid when identifying and tracking KPIs
Avoid these common mistakes for successful KPI tracking:
Don’t try to track everything; be specific about choosing the KPIs that matter to your customer and business and stick to them
Don’t map your customer’s journey on assumptions—talk to your customers first
Don’t just measure KPIs then forget about them—use them to prioritize updates and remove blockers along the customer journey
Don’t rely on generic industry KPIs or targets alone—use them to inform your KPIs, but make sure they’re realistic and relevant to your customers and company
Use KPIs to delight customers on their journeys
KPIs are important signals of whether you’re on the right track to achieve your business and user goals—or whether you need to make adjustments to better meet customer needs.
Use our guide to help you find the right KPIs to measure and optimize the user journey for delighted customers and brilliant business results.
Improve your customer journey with product experience insights
Use Hotjar to understand how real users are experiencing your website—then optimize their product experience!