Learn / Guides / User engagement guide
Top 8 user engagement metrics to track and measure
To develop a product customers love, you need to understand which website features excite your users—and which ones put them to sleep.
But what you think will engage your users, and what actually engages them, can be two very different things. Tracking user engagement metrics will give you real insights so you can identify and optimize your site’s best features.

This article walks you through seven user engagement metrics and key performance indicators (KPIs) you need to regularly track and measure, and shows you how to improve user engagement based on the insights you gather.
Find out what really engages your users on your site
Use Hotjar’s tools to make data-driven decisions and boost user engagement

8 user engagement metrics for web and product insights
User engagement tells you how much value your users are finding in your product or service—and is a good indicator of success, since engaged users are more likely to sign up for your service or complete a purchase.
Identifying which parts of your site engage your users helps you create a winning formula to use in future design and marketing decisions—or change elements of your webpage that your users don’t find value in.
The most important thing in tracking user engagement is understanding what the conversion goal is. If you have a fast fashion ecommerce business, you need to know how often your customers actively use your page (monthly usage), how often they add items to the favorites or cart, and how many pages they go through in a specific session (pageviews). It all depends on your engagement strategy and your company’s objective.
Collecting traditional web metrics is important, but it's not enough—combine product experience (PX) insights with traditional analytics to see the big picture and find out what really engages your users.
In the eight user engagement metrics listed below, we look at both qualitative and quantitative data to help you understand not only whether your users find value in your product or service overall—but which content and features hold their attention. Then, you can take steps to optimize and enhance their user experience (UX).
1. Unique, new, and returning users
It’s important to know which of your unique users are new and which are returning.
A high number of new visitors can indicate that a campaign’s been successful, while high rates of returning users tell you your visitors are sufficiently engaged by your product to come back for more.
If you have more returning visitors than new users, this could be a sign that your user engagement efforts are paying off. But if you have more new users, this shows you should think about updating what you offer.
User engagement tools like Google Analytics can help you track your unique, new, and returning users.
Pro tip: to find out user motivations for returning to your site, ask visitors questions in an onsite survey and specify which target URLs you want to focus on.
For an ecommerce store, you could ask the following questions on your product pages:
1. Is this your first time on this site?
2. What information about (product name) are you looking for?
3. How could we make this page more useful?
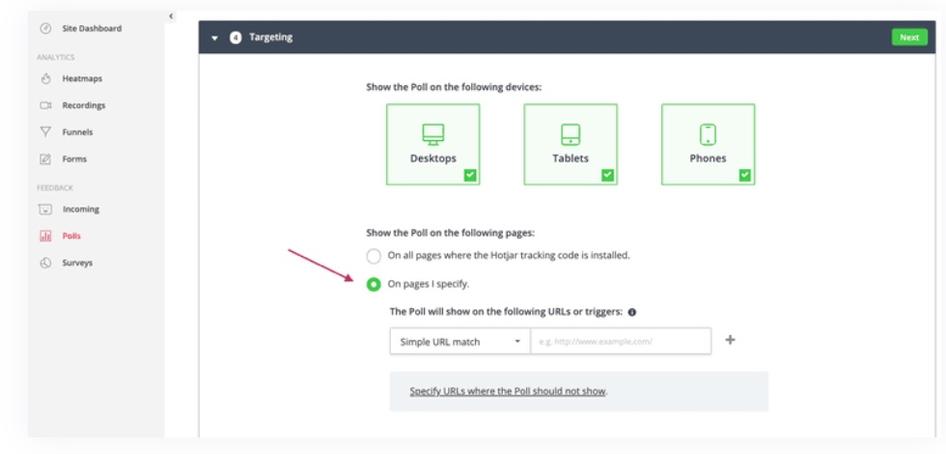
Hotjar lets you set up onsite surveys that target the specific URLs you want to start your investigation from
2. Pageviews and time on page
Pageviews tell you how many users visit a particular page on your website, while time on page shows you how long they spend on each page before moving on to the next.
The number of pageviews on your website shows you how popular your website is, and an increase in pageviews can indicate a successful search engine optimization (SEO) campaign.
But if visitors don’t find what they want, they might leave just as quickly as they arrive—so measuring time on page can help you understand your users’ engagement and whether or not they’ve found the page useful.
You can track both pageviews and time on page metrics with Google Analytics. View how your pageviews evolve over time and track them against campaigns to attract new users.
If your page views drop, you can attract more traffic to your site through:
Social media engagement
Email campaigns for lapsed users
Paid-for ads
SEO content to bring in traffic from keyword searches
Calculate time on page by dividing the number of words by the minutes users spend on the page. If visitors spend 5 minutes on a page with 1,000 words of content, that’s a decent average rate. But if they’re spending less time than that, you need to find out what’s causing your users to leave early so you can address it.
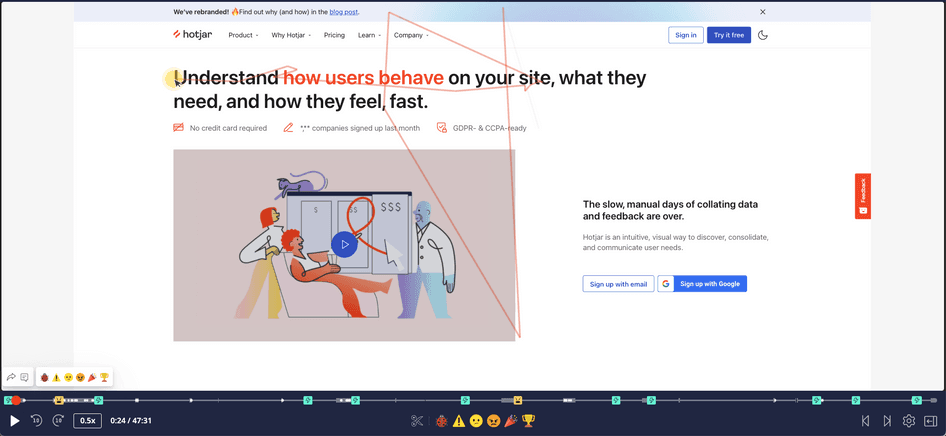
Watch Hotjar (that's us!) Session Recordings of users interacting with your site to uncover problems like rage clicks, which can indicate bugs, blockers, or broken links that might be the cause of low time on page.
3. Scroll depth
Scroll depth measures how much of your content users consume by monitoring where on your page they get to, revealing whether your content is interesting and easy to read.
Measure scroll depth with the Google Analytics Scroll Depth plugin, which tells you the percentage of your page your users get to (i.e. 25% or 75%) and pixel depth. This is a definitive measure of where your users stop scrolling, which might vary depending on screen height.
If your scroll depth metrics are low, find out why by comparing pages with high and low scroll depth. It might be that in pages with low scroll depth, you give your users all they need above the fold, or there might be an external link encouraging them to leave before they scroll all the way down the page.
Improve your pages' scroll depth in the following ways:
Personalize content for your users
Make pages scannable with good use of headings, formatting (bold, bulleted lists, etc.), and images and graphs that make your narrative more attractive
Encourage scrolling through a blog article with a table of contents, to show readers what is coming later and with signposting language like: "In this article, we’ll look at and provide tips on..."
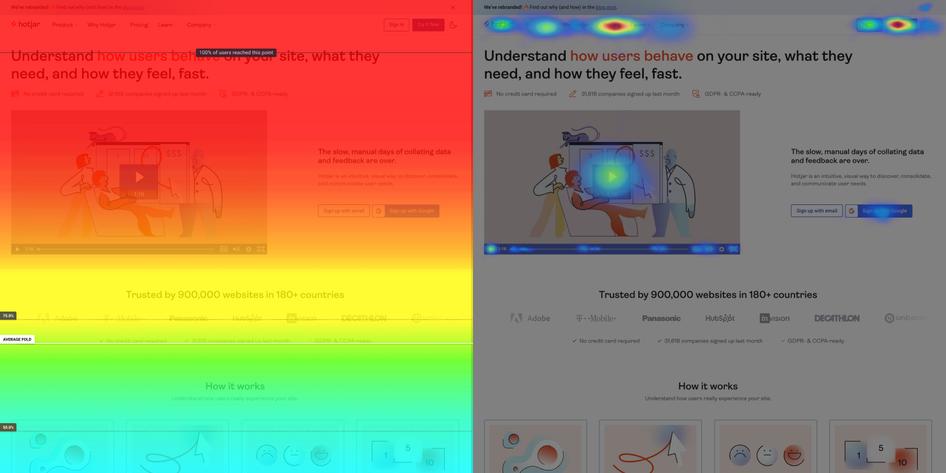
Create Heatmaps of your popular and low-performing pages to understand scroll depth and see where your users click, move, and scroll on your site, helping you identify which aspects of a page engage your users and which get ignored.
4. Use of new tools and features
Making regular updates to your site should be a central part of your user engagement strategy. But how do you know which tools and features are really engaging your users?
Track metrics like pageviews and time on page to see how many people visit new features on a particular page, and how long they spend interacting with them.
Or, if your tool requires a signup or download, track these figures over a period of time to see if there are particular campaigns or times of the year that increase user engagement.
Watching and analyzing recordings of visitors interacting with your site also helps you understand why your users are ignoring a new feature. Segment users who interact with or ignore your updates to understand the different journeys they take and what affects their experience. You might realize you need to set up an onboarding process to show users the value of the feature.
There might also be a bug in your new feature, which you can identify by getting on-page feedback from users and asking them to send a screenshot of the element that isn’t working for them.
5. Bounce rate
Your site’s bounce rate is the proportion of users who abandon your site after viewing only one page.
Calculate bounce rate by dividing the number of bounces (single-page sessions) by the number of total sessions on your site.
For example, if 100 users arrive at your homepage and 10 of them leave without clicking further through your site, then your homepage has a bounce rate of 10%.
A high bounce rate indicates that users don’t find your product useful or don’t understand how it can help them achieve their jobs to be done (JTBD). For example, if your landing pages have a high bounce rate, you know your users aren’t navigating further to find out more product information. In this case, it’s a good idea to find out what’s holding them back and improve your messaging or design to show users the value of your product.
🔥Pro tip: A/B test trial designs of your landing pages to find out which design is more popular and encourages users to engage with your product.
Use A/B testing software like Google Optimize or Hotjar Heatmaps to design and test different page variants, then determine which aspects of your design or messaging users find engaging by asking them directly with a Hotjar Survey. You can even filter survey results based on specific events, like whether users bounce or continue to navigate through the site.
But bounce rate can be misleading. Perhaps your users find exactly what they need on a particular page and leave shortly after that. Or you’re getting users from search engines who click away quickly after realizing they’re not the target audience for your product.
Analyze bounce rate alongside scroll depth, time on page, and search engine statistics to get a better understanding of whether your product experience (PX) and content engage your users.
6. Click-through rate
Click-through rate (CTR) is the ratio of clicks on a particular link to the number of times users view the link (number of impressions). So, if 100 people view a CTA button, and 3 users click on it, the CTA button has a CTR of 3%.
CTR is a useful user engagement metric that helps you understand if users like what they see when they visit your page, and feel compelled to find out more by signing up for a free trial, for example. If your CTR is low, you might not be targeting the right audience with your marketing campaign to bring people to your site, or you might not be giving them compelling content they want to read.
Like most other user engagement metrics that deal with traffic, you can track your CTR on Google Analytics. But this will only give you headline figures. To find out which specific aspects of your site contribute to high or low click-through rates, you need to collect product experience insights data from session recordings or user feedback to make impactful changes.
How to improve click-through rates:
Improve your targeting of new users on social media platforms by using hashtags
Design better CTAs with compelling text and an attractive design
Show users the value of your product by presenting them with a clear pain point, like not being able to keep track of customer support tickets, and demonstrating how your service offers a solution
7. Conversion/churn rates
Your conversion rate is the percentage of visitors who complete a key action like making a purchase or signing up for a subscription. It’s an important measure of user engagement—the more engaged your users are, the more likely they are to convert and bring revenue to your business.
Calculate your conversion rate by dividing the number of user sessions by the number of users that complete an action.
Your churn rate is how many users you lost over a period of time, telling you how many of your signed-up users stopped finding value in your product and unsubscribed. Calculate your churn rate by dividing churned users over a certain time range by the number of users you had at the beginning of that period.
How to show users your product's value to increase conversion and decrease churn rates:
Improve your onboarding experience so users understand how your product will help them
Maintain strong communication with your users—for example, send an email to churned users with information about product updates to encourage them to re-engage
Continually improve and update the user experience
Get feedback from your users to find out what makes them convert
8. Abandonment rate
Cart abandonment rate tells you what percentage of online shoppers add items to their shopping cart but leave before checking out. It shows you the exact point when a user who's on the brink of making a purchase from your ecommerce store decides not to go ahead.
Calculate your abandonment rate by dividing the total number of completed sales by the number of initiated sales.
While your abandonment rate tells you how many users didn’t complete a transaction, it won’t tell you why. Use a PX insights tool like Hotjar to go beyond traditional web analytics and understand your users’ behavior.
💡Pro tip: watch Recordings of users who abandoned their shopping carts to understand their customer journey and uncover any glitches in the shopping experience.
For example, you might notice that users abandon their cart when they see that shipping times are longer than they expected. You could reduce cart abandonment by being more transparent about shipping times earlier in the checkout flow, or looking at ways to reduce them.
You can also send users who are about to abandon their cart an exit-intent Survey that asks them why they didn’t complete their purchase.
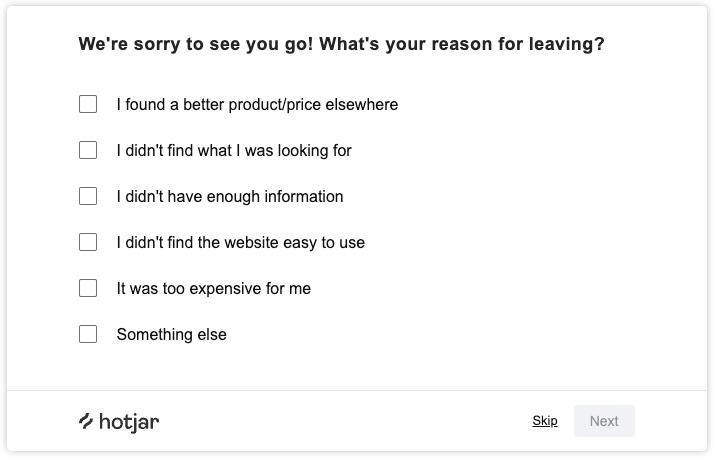
Hotjar helps you design your exit intent survey with a template that you can customize to suit your needs.
Staying on top of user engagement
Understanding which aspects of your product engage your users helps you optimize their experience and turn more new website visitors into repeat customers.
Traditional web metrics like bounce rates and page views give you a useful overview of how many users you have, whether they’re new or returning, and whether or not they sign up for your service or make a purchase.
This overview is important—but it’s only the first step in deeply understanding user engagement. Combine traditional metrics with user-centric insights to pinpoint areas to improve and create an enhanced experience that gives your users exactly what they want.
Find out what really engages your users on your site
Use Hotjar’s tools to make data-driven decisions to enhance user engagement