Learn / Guides / Website engagement tracking guide
10 website engagement metrics online businesses need to track, analyze
Running a successful website means tracking and analyzing key metrics that tell a powerful story about your users' behavior and engagement.
But getting the full picture of how your users are thinking, feeling, and interacting means measuring a wide range of website engagement metrics that reveal behavior patterns over time—and it can be hard to know which ones to focus on.

Our guide to the top website engagement tracking metrics shows you exactly how to measure engagement on your site—so you can spot potential growth opportunities and make changes to your site to better meet user needs.
Learn how users really engage with your website
Use Hotjar's product experience insights to see exactly how users interact with every aspect of your site, so you can optimize brilliantly.

Top 10 engagement metrics to track to build a better website
Website engagement tracking is the process of tracking and measuring specific metrics that indicate how successful your site is at engaging and retaining visitors, and show you how users engage with your site.
Understanding how your visitors are engaging—and identifying blockers to website engagement—helps you improve your user experience (UX) and better meet customer needs.
Let's dive into the different types of engagement metrics you can use for website monitoring to track and analyze user engagement and understand your customers’ experiences on your site:
1. Average time on page
Average time on page measures the amount of time your users spend on specific web or product pages. It’s a key metric to understand user engagement as it gives you insights into your top-performing web pages, and shows you which ones need to be optimized for a more enticing customer experience (CX).
For example, let’s say you’ve created a new page featuring product demos and descriptions—but your users' average time on page is below 10 seconds. This is a good indicator that either your page content or messaging isn’t engaging customers, or that they’re having problems using it. You can then redesign your webpage to break up product information chunks into smaller, more visually appealing segments, or check that all the page media is working correctly and make any necessary fixes.
Calculate average time on page by taking the total time users spend on a page and dividing it by the total number of page views, minus the number of page exits—or let website analytics tools do the math for you😉.
Then, get deeper insights into exactly what users are drawn to or where they get distracted on the page by watching recordings of user sessions that show you how they are really engaging with your web pages.
2. Average session duration
Average session duration measures the average length of user sessions on your website. A low average session duration may indicate that your website content, design, or product offering is failing to fully engage your users— causing them to drop off and possibly continue their search elsewhere.
Measure average session duration with standard web analytics tools like Google Analytics, which tracks the time from when a user lands on your site to when they exit or become inactive.
Then, combine your average time on page and average session duration metrics to go even deeper. For example, you might have a long average session duration, but notice a specific page has low time on page and high exit rates. This information lets you pinpoint where you need to take action, letting you optimize the pages that need it most to increase your average session duration—and engage users throughout their journey.
3. Page views
Page views are the number of times a page is loaded or reloaded by a user in a web browser, helping you understand if your individual web pages are getting clicks and how popular they are.
First, use web analytics tools to calculate your page views and gauge whether your pages are engaging users.
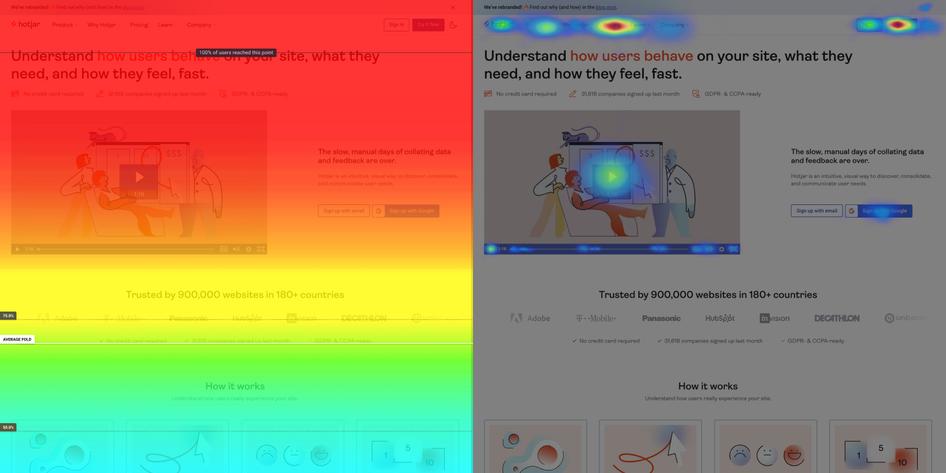
Then, look at Hotjar Heatmaps for an in-depth view of exactly where users click and how far down they scroll on a page, so you know which page elements really engage users and compel them to use your product offering. Use these insights to optimize your least engaging pages with user-centric content and UX design changes.
4. Pages per session
Pages per session is a metric that tracks the total number of pages visited on your website in a single user session. This helps you understand if your web pages are inspiring visitors to keep clicking, and whether you’re creating an engaging, intuitive user experience (UX) throughout their customer journey.
Calculate pages per session by dividing the total number of page views by the number of user sessions. Then, combine the insights you’ve gathered on page views with your pages per session data, to see where you can optimize your site with internal links, clickable images, and CTAs that will get more users clicking through to relevant pages.
For example, let's say you’ve recently posted a new product walkthrough video on a landing page that’s suddenly getting a large number of page views. This likely indicates that users are interested in your new video—so it’s an ideal opportunity to add a link in the video description that compels viewers to click on the corresponding product page for more information, promoting click-throughs to high-value pages.
5. Bounce rate
Bounce rate is the number of visitors who leave your website without performing a single action, like clicking through to another page or engaging with your content. A high bounce rate is a good indicator that your website isn’t delivering on user needs or that your content and messaging aren’t giving your visitors enough value.
Use Google Analytics to analyze your site’s bounce rate and get an overall idea of how well your website engages visitors. Then, use product experience (PX) insights tools to dive deeper into the customer experience and see exactly how users navigate your web pages and where they drop off to find out what’s driving your bounce rate.
🔥Pro tip: use Hotjar's Session Recordings tool to watch users as they bounce from your site, and see if they're 'rage clicking' or if there are any blockers on your page causing them to leave.
Combine these granular observations with direct user insights you collect with the Hotjar Feedback widget to stop guessing and actually learn why users are engaging or bouncing.
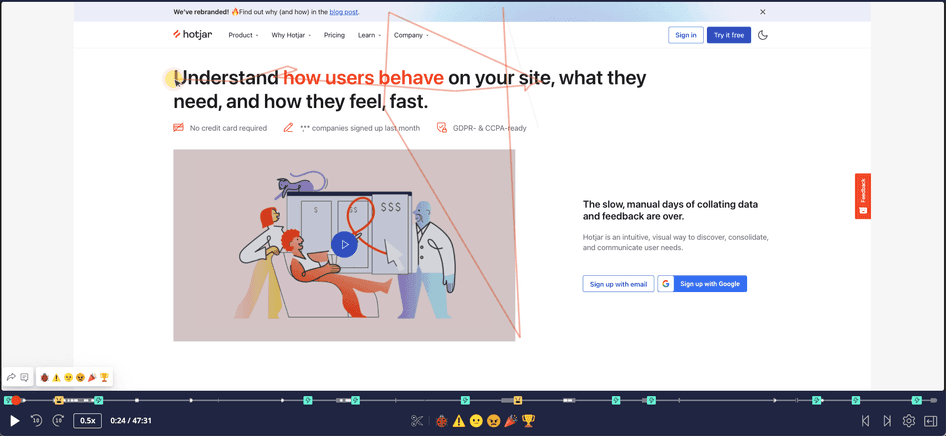
Hotjar Recordings give you access to key user insights as they navigate your website or digital product.
Source: Hotjar
6. Exit rate
Exit rate metrics tell you the total number of users who leave your website from a particular web page. If your web pages have a high exit rate, it could mean you need to optimize your product experience by paying attention to user behavior trends and responding to bugs and blockers.
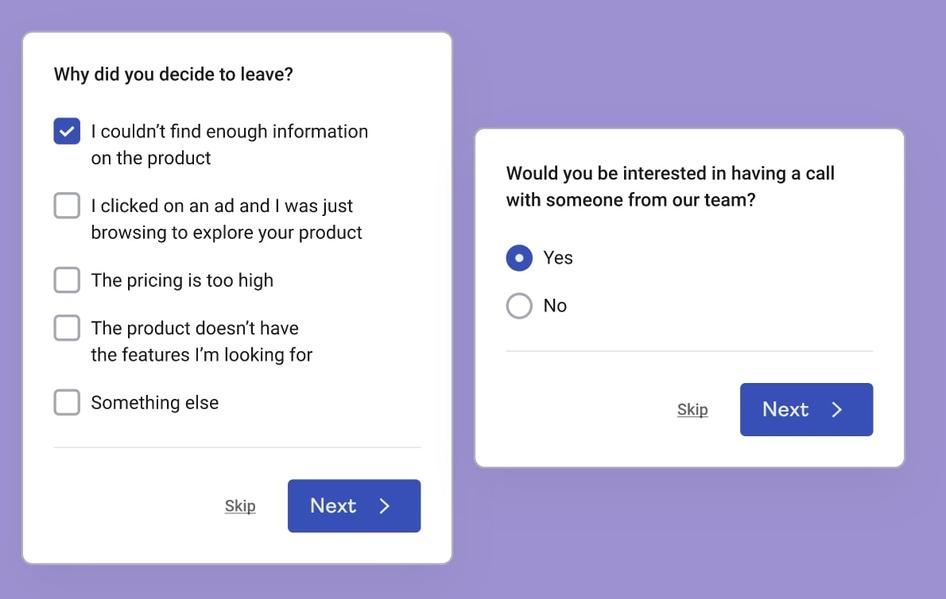
Calculate your exit rate by taking the number of exits and dividing it by the number of page views for a specific web page. Then, use Hotjar exit-intent Surveys to get granular, voice-of-the-customer (VoC) insights that help you understand your customers and their motives for leaving your site.
For example, if you see your checkout page has a high exit rate, use a Survey to find out what’s blocking users from completing their purchase. This exit survey—delivered at the key moment—will show you exactly which web page elements you need to optimize to boost engagement and get sales.
7. Clicks and scroll depth
Measuring clicks and scroll depth tells you how many times a user clicks on your website, and how far down a page they scroll, which is a good indicator of how active your visitors are and whether you’re creating an engaging onsite experience that drives them to perform key actions—like signing up for a trial or converting into a paying customer.
Start by tracking first clicks, then use Hotjar Heatmaps to see an aggregate of all user clicks across any given page, as well as interaction and scroll depth, and see which CTAs, videos, or content are driving engagement. Next, use Recordings to see how deeply users are engaging during their sessions, and spot opportunities to improve the customer experience and captivate your visitors.
8. Returning users
Tracking returning users means measuring how many visitors have previously logged visits to your site, within a specific timeframe, which helps you understand how strong your website is at customer retention.
Measure your returning user rate by dividing the number of repeat visitors by the total number of unique (or new) visitors within a certain time period, or automatically track it with a tool like Google Analytics.
9. New user sessions
New user sessions measure the number of new visitors who click on your website from a new device, helping you understand whether your marketing, content strategy, and reviews are successfully attracting potential customers.
First, calculate new user sessions with an analytics tool—then, check the difference between your new visitors and returning visitors to see how many users you’re retaining after their first visit. This will give you a sense of whether you’re not only attracting but also engaging users.
10. New contacts & subscribers
Monitoring the number of new contacts and subscribers your website gets, either through form submissions or product signups, helps you understand if you’re engaging potential customers with valuable content and offers tailored to their unique needs.
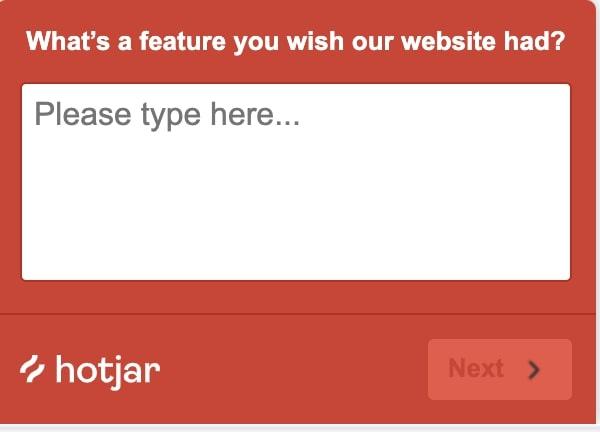
Use your website’s CMS dashboard to see how many new contacts and subscribers you’ve gained within a given time period. Then, use Surveys to ask them what made them subscribe, or what they’d like to see throughout their product experience, so you can make sure you’re engaging users at every stage of their customer journey.
Supercharge your website engagement by putting your metrics in context
Tracking metrics like time on page, session duration, and bounce and exit rates will give you an overview of how users are interacting with your site, so you can optimize their product experience and increase engagement.
It’s a good idea to stack your website engagement metrics against industry benchmarks to check the success of your efforts in context. But it’s also important not to get too caught up in industry averages, as they'll vary depending on your unique user base and business model. It’s even more impactful to weigh your metrics against your past performance and customer behavior trends specific to your user and organizational goals.
Use our guide on the top website engagement metrics to identify and track the right metrics to meet your specific engagement needs over time. Then, go deeper into understanding the context behind the numbers by gathering granular, qualitative user insights that show you how users are engaging with your site and what they’re thinking and feeling—which shows you what to improve.
Learn how users really engage with your website
Use Hotjar to see exactly how users interact with every aspect of your site, so you can optimize brilliantly.