Learn / Guides / Website monitoring guide
6 website performance metrics worth tracking
Everyone wants a high-performing website that gives new users an ideal first impression and motivates loyal customers to keep coming back. The key is to guarantee a great customer experience (CX) at every stage. Visitors land on your site with a goal in mind, and if they can’t accomplish it, they’ll navigate away unsatisfied.
That’s why tracking UX-related website performance metrics like page speed, conversion rate, and session duration are so crucial.

If you want to learn more about which website metrics to track, you’re in luck. We’ll take you through the six most critical performance metrics and give you tips on how you can improve them to optimize your site. Let’s get started.
Use Hotjar to dive deeper into website performance metrics
Complement quantitative website metrics with key qualitative insights from Hotjar’s Observe and Ask tools.

Why tracking metrics is essential for website monitoring
To provide your customers with an excellent online experience, you’ll need to know specific details about what’s working well on your site—and what isn’t.
When you continually check website metrics, you can zero in on issues quickly and take data-informed actions to resolve them, preventing damage to your reputation, customer experience, and your business’s bottom line.
Imagine you own a SaaS company, and you’ve set up your website homepage to prompt visitors to sign up for a free trial, but conversions are lower than expected.
If you don’t investigate website metrics like bounce rate, scroll depth, and session duration, it’ll be impossible to figure out why people aren’t signing up, which blocks you from finding a fix for conversion rate optimization.
In addition, you won’t be able to set objectives or determine what a ‘good’ conversion rate is if you aren’t tracking key metrics, which let you establish benchmarks for your site that you can improve upon in the future.
6 metrics to track for optimal website performance
Let’s look at the key metrics to include in your website monitoring checklist.
Before we dive into the details, it’s worth pointing out that many of these metrics are quantitative and numbers-heavy. Anayzing technical data is crucial if you want to get your site into tip-top shape—but don’t forget about qualitative data, too.
Quantitative data uncovers what’s happening, but it doesn’t account for how or why. Use product experience (PX) insights tools like Hotjar’s Session Recordings and Heatmaps to explore how customers are experiencing your site and collect qualitative insights.
"The best way...is to layer in qualitative insights too, so that you can get a fuller picture of the user experience. Combined together, you can then take better judgments that ultimately help you deliver a better website experience."
1. Page speed
Page speed measures how quickly your pages load when someone visits your website. Your homepage speed is the most important, but any slow-loading web page can negatively affect the user experience.
Why page speed is important
Page speed is important because people’s attention spans are short. A slow-loading site can result in users navigating away without looking at anything at all. That means fewer customers, less engagement, fewer conversions, and lower sales.
Website conversion rates have been shown to drop by an average of 4.42% with each additional second of load time. Even worse, 62% of consumers are less likely to purchase from a business after having a negative online experience.
If you need any more convincing as to why page speed metrics matter—they’re also vital for search engine optimization (SEO). Page speed is a key ranking factor for search engines like Google, and your position in the search engine results pages (SERPs) will take a hit if your site takes too long to load.
How to establish a benchmark for page speed
To determine page speed objectives, research your industry’s norms. Different kinds of customers have different expectations, and some are more demanding than others.
Generally speaking, your site should take between zero and four seconds to load. Anything over five seconds is downright harmful.
If you work in ecommerce, your site needs to load even more quickly—between two to three seconds is optimal.
How to improve page speed
Improving page speed can be tricky. In the end, it comes down to getting rid of code bloat and reducing unnecessary elements on your site.
Here are some basic ways to do so:
Images: only use images that benefit your users, and make sure they’re sized, compressed, and optimized correctly
Videos: host videos externally rather than directly on your website
Integrations and plug-ins: remove all unnecessary plug-ins and integrations, including those that are built into your CMS
External web fonts: use these sparingly and opt for safe web fonts like Arial and Times New Roman. Not everyone can see external web fonts and they take up lots of space.
2. Bounce rate
Bounce rate is the percentage of people who visit your visit and leave almost immediately after, rather than continuing to view other pages.
High bounce rates are particularly damaging if your website depends on users navigating through multiple pages.
Why bounce rate is important
Bounce rate is a great indicator of how valuable, relevant, or functional the content presented on your homepage is. When it’s high, it can mean:
Users who land on your homepage are confused by—or uninterested in—what they see
Users who land on your homepage are encountering UX issues like glitches and bugs
Users who land on your homepage are immediately turned off by something—loud audio, over-the-top media elements, or aggressive pop-ups
Landing page bounce rates are often higher than website bounce rates because they normally only require single-page sessions. It’s always a good idea to look at conversion metrics alongside bounce rate to get a well-rounded idea of how your page is performing.
How to establish a benchmark for bounce rate
Establishing a typical bounce rate for your site is essential so you can identify when something’s amiss in the future. If your average website homepage bounce rate is 30% and one day it jumps up to 60%, something’s probably not working correctly.
Make good use of website monitoring tools and calculate your site’s average bounce rate over a month’s time for future reference.
It can also help to keep your industry’s average bounce rates in mind, but proceed with caution: a percentage doesn’t tell the full story behind a bounce rate. In general, a bounce rate of less than 20% is considered exceptional for ecommerce businesses, but the average is closer to 20-50%.
How to improve bounce rate
To improve your bounce rate, you need to understand why it's high in the first place. Figuring this out may require additional research with tools that dig deeper into the user experience like Hotjar.
In the meantime, here are a few tactics you can try to keep users on your site for longer:
Improve website loading time
Investigate and resolve UX problems
Adjust copy placement & messaging
Optimize product pages
Make your website look professional
Integrate design elements that prompt visitors to browse
Pro tip: bounce rates are helpful metrics, but you’ll need complementary tools to connect the dots. Use Session Recordings and on-site Surveys to pinpoint exactly how customers are interacting with your site and figure out what might have caused them to navigate away.
Recordings will show you if people bounced because of bugs, distracting design elements, or something else altogether. You can then add Surveys to your site and ask your customers how their experience can be improved and what motivated them to end their session so soon.
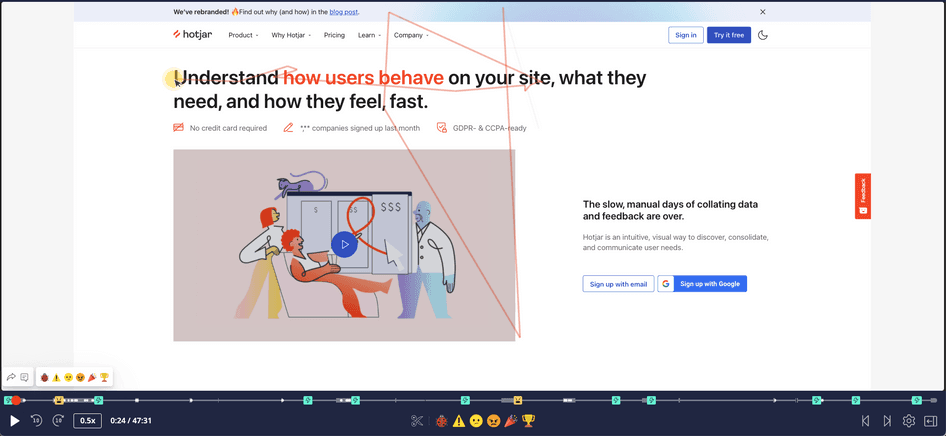
Hotjar Session Recordings help you go deeper into how users experience your product
3. Conversion rate
Website conversion rate is the percentage of site visitors that successfully complete an action you want them to do, like making a purchase, opting into an email list, or signing up for a free trial or demo.
Why conversion rate is important
Conversion rate tells you how much of your website traffic you’re turning into leads or paying customers.
This is essential because it helps you:
Explore whether visitors are doing what you want them to: your website is one of the best lines of communication you have with your customers. It’s also your best salesperson, so you need to ensure it’s effectively guiding visitors towards converting.
Investigate your digital marketing strategy’s profitability: if your site has a low conversion rate, you’ll need to bring in a lot more traffic to get the same number of leads and sales as a site with a higher conversion rate.
Understand your customers’ wants & needs: a low conversion rate can be a sign that you aren’t connecting with your users effectively. Use Hotjar Ask tools like Feedback and Surveys to dig deeper into customer problems and pain points, get to know them better, and optimize your website content accordingly for better conversions.
How to establish a benchmark for conversion rate
Establish your conversion rate benchmark by looking at your site’s historical data.
Perhaps you work for a SaaS company and want your site visitors to sign up for a free trial on your homepage. Your conversion rate over the last month was 10% traffic-to-trial. Set that as your current average and work to improve upon your own metric.
You can also research average conversions, but they vary a lot between different industries, demographics, and conversion goals. However, anything between 2-5% is considered good.
How to improve conversion rate
Some developers forget that websites help generate leads as well as communicate information. As a result, they don’t include explicit enough calls-to-action (CTA), which can impact conversion rates.
Hotjar’s Observe tools like Heatmaps show you whether users are clicking on your CTAs—follow up with Ask tools to find out why or why not. You might find that a quick change to CTA positioning can boost conversions without the need for a full redesign.
Your website is also a lead generation tool, so you want your visitors to do an action that will ultimately lead to a sale. It’s important to have a clear call to action, which refers to the next step you want your visitors to do. That includes signing up for your email newsletters, downloading a freebie, or registering for your service or product.
It’s also important to look at the big picture if you want to significantly improve your conversion rate:
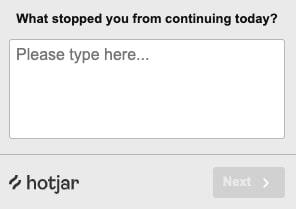
Understand why people visit your site in the first place: you can do this by talking to your customers right on your homepage. Ask them what initially brought them to your site with a Hotjar Feedback widget.
Determine blockers that are stopping people from converting: use a website monitoring tool to single out low-performing pages. Then, put Hotjar Session Recordings and Heatmaps to work and uncover what usability problems are going on.
Investigate exactly what prompts conversions: conduct customer research with users who’ve converted on your site and ask them what influenced their final decision by using Hotjar's off-site Surveys.
4. Scroll depth
Scroll depth examines how far down users scroll on one of your webpages. It can be represented horizontally or vertically.
Why scroll depth is important
If you’re wondering which site elements users actually engage with and when you lose their attention, scroll depth is a fantastic metric to track. It’s useful if you want to determine what information to place above the fold, optimize your page layout, or adjust your web page copy.
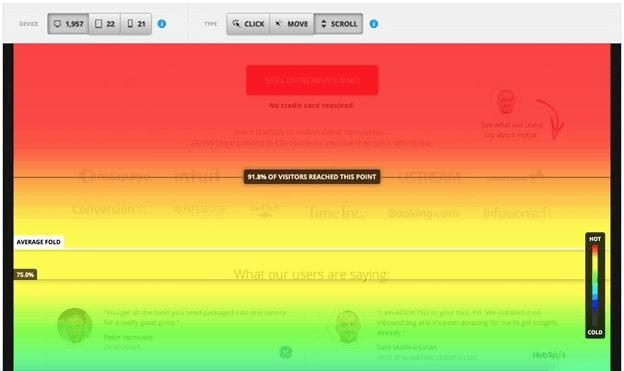
For instance, the Hotjar scroll map above shows which areas are reached by most of your site users—91.8% and 75% in this case—which tells you where your most important content should go.
Having this kind of intel helps teams make design decisions that foster great UX, highlight the right information, increase clarity, and boost conversions.
How to establish a benchmark for scroll depth
Benchmarks aren’t as important for scroll depth as they are for other metrics. Most website monitoring tools that measure scroll depth show where ‘above the fold’ and ‘below the fold’ starts and ends.
If you aren’t already aware, ‘above the fold’ refers to what people can see on a webpage or screen without scrolling down. Users need to scroll down to see content ‘below the fold’.
Understanding what’s above and below the fold, along with metrics on how far your users scroll on a given webpage, lets you optimize your layout accordingly.
As a general rule, longer web pages should have deeper scroll depths.
How to improve scroll depth
After measuring scroll depth, make sure your most important content is placed in the high-visibility areas you’ve identified.
To encourage people to scroll down further on your site, particularly on your homepage or landing pages, try the following:
Determine whether your site is consistent with the principles of visual hierarchy
Run A/B testing and play around with elements like headings, colors, button placement, image placement, and menu size
Compare webpage scroll depth on desktop and mobile devices to determine if one is performing better than the other
Talk to users through interviews or Hotjar Surveys to gather their feedback and pinpoint why they stopped scrolling when they did
5. Page views
Page views measure the number of times visitors land on specific pages of your website.
Why page views are important
Tracking page views is critical because it helps you determine the most popular content on your website. It can also help uncover patterns in user behavior to inform decisions on how to design your webpage menu and layout.
Pageviews are particularly handy for ecommerce website analysis because they let you see which of your pages attract traffic and which get overlooked.
Imagine you’re evaluating your ecommerce clothing website’s analytics during a given month. You realize your overall website traffic was pretty typical but there was a significant traffic leap on product pages for dresses and skirts.
Page views can increase for many different reasons, including:
More people are interested in a certain page (maybe the weather is heating up and customers are looking for spring and summer clothing)
Something on your website is enticing users into repeatedly clicking on certain pages during a single session (maybe you’ve launched new items that are attracting attention)
You’ve recently optimized a page (maybe implementing SEO stategy has made your ‘summer dresses’ page more prominent in SERPs)
Whatever the case, once you realize that more people are clicking on a particular page, you can investigate why and take appropriate action. For instance:
Update more web pages with seasonal or in-demand products
Recreate what’s attracting attention on high-traffic webpages on other parts of your site
Optimize your other webpages with a similar SEO strategy
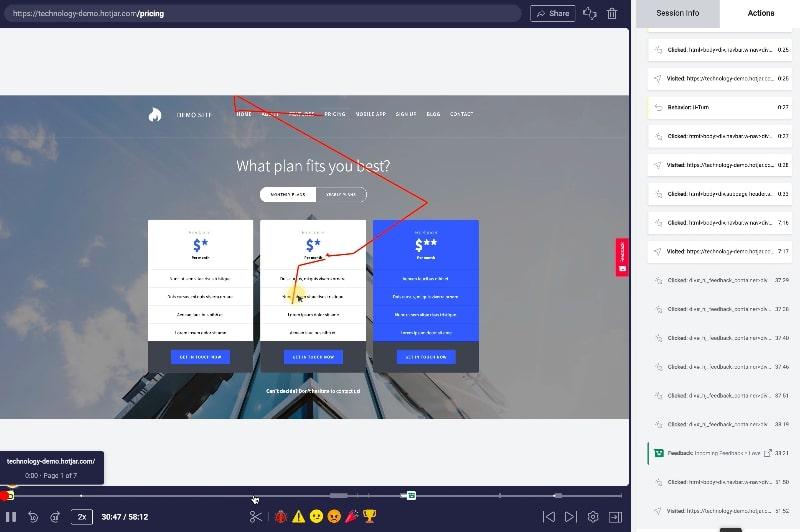
Pro tip: dig deeper into which web pages your customers are most attracted to, where they click, and how they interact with your content with Hotjar's Observe tools like Session Recordings and Heatmaps. You’ll gain qualitative insights into exactly why people are gravitating toward certain web pages so you can optimize conversion elements like images, buttons, and link placements accordingly.
How to establish a benchmark for page views
Investigate your website’s historical data to get an average of views across all your different pages. Once you’ve recorded that, it’ll be obvious when specific webpages experience significant boosts in traffic.
It can be helpful to measure both website traffic and page views over a specific period of time so you can understand how many people are visiting your site and where they end up during their sessions.
How to improve page views
A great way to increase your overall page views is by studying your best-performing pages, determining why they prompt such great results, and mimicking that approach across your site.
Here are three more best practices you can implement to give your page views a boost:
Make sure your website is easy to navigate: your customers might be missing out on important areas of your website because you’re not effectively guiding them through different pages. Make sure your tab menu is well-located, clear, and only contains essential information, which brings us to our next point…
Get rid of clutter: if your site has too much going on, users will find it difficult to navigate. If they’re overwhelmed or confused, they’ll decide to click away. Remove pages and elements that aren’t useful to your customers.
Be smart about linking: great websites have lots of internal links that connect different pages, prompting more views. But linking for the sake of it will frustrate your website visitors. Whenever you link, make sure you’re answering customers' questions, expanding on an idea, or providing users with valuable information.
6. Average session duration
Average session duration measures the average length of user sessions on your website. Basically, they tell you how much time people are spending on your site during one visit.
Why average session duration is important
Average session duration provides a pretty good idea of how engaged visitors are while scrolling on your website.
It’s safe to say that users who spend at least a few minutes browsing your site are interested in your content or what you’ve got to offer. When users bounce right away or after a brief session, they probably:
Don’t have a good first impression of your homepage or landing page
Aren’t captivated by your website
Aren’t interested in what you’ve got to offer
Are running into site issues
Were misled when they landed on your site in the first place
As you can see, average session duration is a tricky metric to track. On their own, session duration metrics won’t really tell you why people are spending a long or short time on your site.
To take full advantage of insights based on user sessions, you’ll need to go further. Tools like Hotjar Session Recordings can show you exactly what your customers are doing throughout their sessions, diving into why they’re spending so much (or so little) time on your site.
How to establish a benchmark for average session duration
To determine a useful average session duration benchmark, investigate industry averages and pair them with your own historical data.
For instance, 2-3 minutes is considered a good average session duration in the ecommerce world.
But only you know the specifics of how long your ecommerce website takes to navigate. It might be designed with quick sessions in mind, or it might have many different pages to view and elements to interact with, leading to longer sessions. Your historical data could show you averages as low as one minute or as high as twenty minutes.
How to improve average session duration
To improve your average session duration, you’ll need to:
Ensure your site delivers a great UX
Understand your users so your site addresses their likes and dislikes and solves their problems
Engage users so they'll stay on your site for longer
The best way to accomplish all of the above is by conducting different kinds of user and product experience research. For example:
Usability research with Hotjar Observe tools like Session Recordings uncovers barriers to your customers having seamless navigation experiences like confusing layouts, broken elements, and glitches
User research with Hotjar Ask tools like Surveys helps you get to know your customers on a deeper level so you can make sure your site aligns with their needs and pain points
A/B testing stacks different webpage layouts and content options against each other to uncover which performs better with customers
Track performance metrics to offer an optimal website experience
All in all, monitoring key website performance metrics is essential if you want to maintain an excellent site.
Tracking metrics helps teams zero in on the good, the bad, and the ugly of their website, showing them what’s running smoothly, what needs improvement, and what actions they need to take.
Whether you choose to focus on improving page speed, bounce rate, conversion rate, scroll depth, page views, or average session duration, you can be sure that it’ll make a big difference in your website’s overall performance and quality.
Dive deeper into website performance metrics
Complement quantitative website metrics with key qualitative insights from Hotjar’s Observe and Ask tools.