Learn / Guides / A/B testing guide
The A/B testing handbook: understanding the basics and optimizing results
To build a website your customers love, you need to understand which features give them a thrill—and which put them to sleep. A/B testing takes the guesswork out of engaging with users, providing real insights to help you identify and optimize your website’s best features.

When you run A/B tests regularly, you can measure your team’s theories against real-world data and develop better products for your customers—a win-win situation!
This guide covers the fundamentals of A/B testing on websites and why they're important for you, your business, and the people who matter most: your users. As you go through each chapter, you’ll be able to develop, evaluate, and optimize your A/B tests, and make sure every change produces positive results.
Get the most out of your A/B tests
Hotjar’s digital experience insights help you understand A/B testing results and use them to optimize the user experience.

What is A/B testing?
A/B testing is a research method that runs two versions of a website, app, product, or feature to determine which performs the best. It’s a component of conversion rate optimization (CRO) that you can use to gather both qualitative and quantitative user insights.
An A/B or split test is essentially an experiment where two test variants are shown to users at random, and statistical analysis is used to determine which variation performs better for a given conversion goal.
In its simplest form, an A/B test validates (or invalidates) ideas and hypotheses. Running this type of test lets you ask focused questions about changes to your website, and then collect data about the impact of those changes.
By testing your assumptions with real users, you save a ton of time and energy that would otherwise have been spent on iterations and optimizations.
What A/B testing won’t show you
An A/B test compares the performance of two items or variations against one another. On its own, A/B testing only shows you which variation is winning, not why.
To design better experiments and impactful website changes, you need to understand the deeper motivations behind user behavior and avoid ineffective solutions like guesswork, chance, or stakeholder opinions.
Combining test results with qualitative insights—the kind you get from heatmap, session recording, survey, and feedback tools—is a ‘best of both worlds’ approach that allows you and your team to optimize your website for user experience and business goals.
Why is A/B testing important?
A/B testing is a systematic method used to determine what works (and what doesn’t) for any given asset on your website—a landing page, a logo, a color choice, a feature update, the entire user interface (UI), or your product messaging.
Whether you're using split tests in marketing campaigns and advertising or A/B testing for product management and development, a structured testing program makes your optimization efforts more effective by pinpointing crucial problem areas that need improvement.
Through this process, your website achieves its intended purpose—to drive maximum engagement or revenue—along with other valuable benefits:
A better user experience: performing A/B tests highlights the features and elements that have the most impact on user experience (UX). This knowledge helps your team develop ideas and make customer-centric, data-informed UX design decisions.
Improved customer satisfaction: gaining insights into what users enjoy helps you deliver a website and product that customers love. Whatever their goal is on your site, A/B testing helps address users' pain points and reduce friction for a more satisfying experience.
Low-risk optimizations: A/B testing lets you target your resources for maximum output with minimal modifications. Launching an A/B test can help you understand whether a new change you’re suggesting will please your target audience, making a positive outcome more certain.
Increased user engagement: A/B testing removes the guesswork from CRO by directly engaging and involving users in the decision process. It lets the users decide—they vote with their actions, clicks, and conversions.
Less reliance on guesswork: A/B tests challenge assumptions and help businesses make decisions based on data rather than on gut feelings—about everything from email subject lines and website information architecture to a complete website redesign
Increased conversion rates: by learning how and why certain elements of the experience impact user behavior, A/B testing lets you maximize your existing traffic and helps you increase conversions
Optimized website performance: A/B testing lets you make minor, incremental changes that significantly impact website performance—like testing APIs, microservices, clusters, and architecture designs to improve reliability
Validated decision-making: use A/B testing to validate the impact of new features, performance improvements, or backend changes before rolling them out to your users
Keep in mind: A/B testing starts with an idea or hypothesis based on user insights.
Hotjar is a digital experience insights platform designed to give you actionable user data so you can spot common areas of friction in the user experience, get ideas for improvements, and find out if your fixes are working (and why or why not).
These four tools help you collect user insights and understand why winning A/B tests succeed, so you can double down on what works:
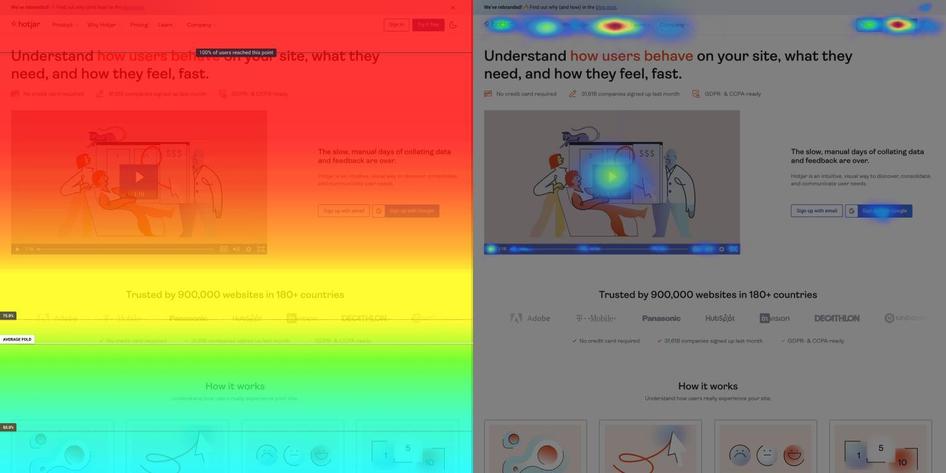
Heatmaps: see where users click, scroll, and move their mouse on individual pages
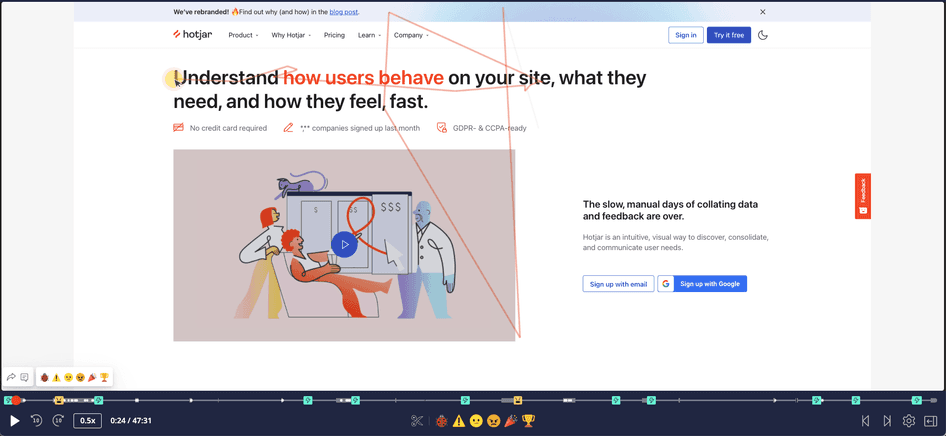
Recordings: view how users browse and interact with your pages across an entire session
Surveys: ask users direct questions about their experience
Feedback: let users tag, rate, and comment on any web page element
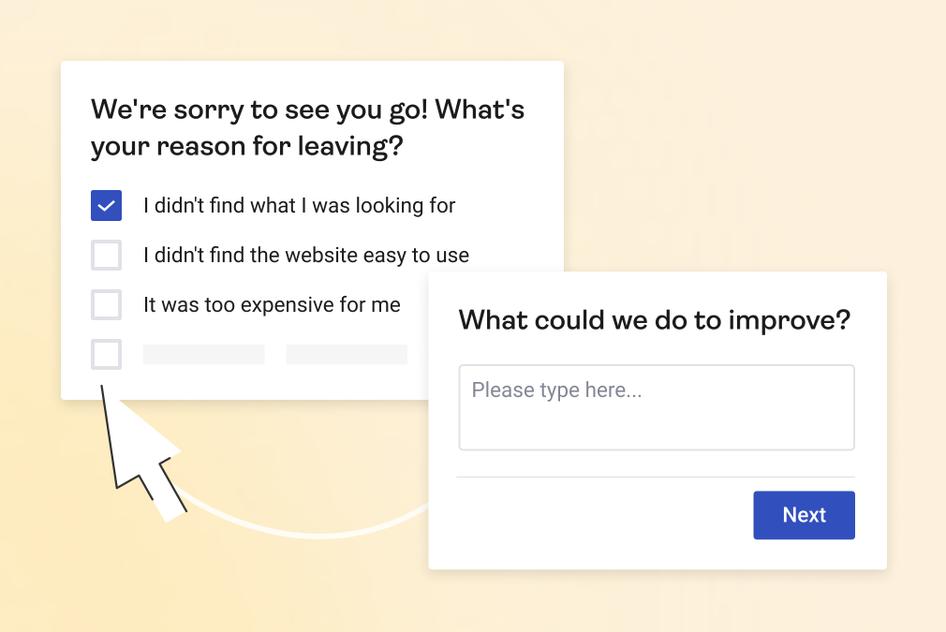
Hotjar Surveys are a way to engage your users in conversation directly
How do you run an A/B test?
Running A/B tests is more than just changing a few colors or moving a few buttons—it’s a process that starts with measuring what’s happening on your website, finding things to improve and build on, testing improvements, and learning what worked for your customers.
Check out our comprehensive guide on how to do A/B testing for your website—everything on developing, evaluating, and optimizing A/B tests. Until then, here’s a quick framework you can use to start running tests:
Developing and setting up A/B tests
From getting a clear understanding of user behavior to connecting problems to opportunities for improvement, the A/B testing process for websites is all about your users.
Researching ideas
A/B testing focuses on experimenting with theories that evolved by studying your market and your customers. Both quantitative and qualitative research help you prepare for the next step in the process: making actionable observations and generating ideas.
Collect data on your website's performance—everything from how many users are coming onto the site and the various conversion goals of different pages to customer satisfaction scores and UX insights.
Use heatmaps to determine where users spend the most time on your pages and analyze their scrolling behavior. Session recording tools also help at this stage by collecting visitor behavior data, which helps identify gaps in the user journey. This can also help you discover problem areas on your website.
Identifying goals and hypotheses
Before you A/B test anything, you need to identify your conversion goals—the metrics that determine whether or not the variation is more successful than the original version or baseline.
Goals can be anything from clicking a button or link to purchasing a product. Set up your experiment by deciding what variables to compare and how you'll measure their impact.
Once you've identified a goal, you can begin generating evidence-based hypotheses. These identify what aspects of the page or user experience you’d like to optimize and how you think making a change will affect the performance.
Executing the test
Remember, you started the A/B testing process by making a hypothesis about your website users.
Now it’s time to launch your test and gather statistical evidence to accept or reject that claim.
Create a variation based on your hypothesis of what might work from a UX perspective, and A/B test it against the existing version. Use A/B testing software to make the desired changes to an element of your website. This might be changing a CTA button color, swapping the order of elements on the page template, hiding navigation elements, or something entirely custom.
The goal is to gather data showing whether your test hypothesis was correct, incorrect, or inconclusive. It can take a while to achieve a satisfactory result, depending on how big your sample size is.
Important note: ignoring statistical significance is a common A/B testing mistake. Good experiment results will tell you when the results are statistically significant and trustworthy. Otherwise, it would be hard to know if your change truly made an impact.
How to generate A/B testing ideas and hypotheses
Identify where visitors leave your website: use traditional analytics tools to see where people exit your website and complement those insights with Hotjar’s conversion funnels tool
Collect customer feedback: use on-page surveys and feedback widgets to get open-ended feedback about what users really think about your website
Run usability testing: usability testing tools give you insight into how real people use your website and allow you to get their direct feedback about the issues they encounter and the solutions they'd like to see
Study session recordings: observe individual users as they make their way through your website, so you can see the experience from their perspective and notice what they do right before they exit
Tracking and evaluating A/B tests
Once your experiment is complete, it’s time to analyze your results. Your A/B testing software will measure data from both versions and present the differences between their performance, indicating how effective the changes were and whether there is a statistically significant improvement.
Analyzing metrics and interpreting results
A/B testing programs live, mature, evolve, and succeed (or fail) through metrics. By measuring the impact of different versions on your metrics, you can ensure that every change to your website produces positive results for your business and your customers.
To measure the impact of your experiments, start by tracking these A/B testing metrics:
Conversion rate: the number of visitors that take a desired action—like completing a purchase or filling out a form
Click-through rate (CTR): the number of times a user clicks on a link or call to action (CTA) divided by the number of times the element is viewed
Abandonment rate: the percentage of tasks on your website that the customer abandons before being completed—for an ecommerce website, this can mean users purchasing an item in their shopping cart
Retention rate: the percentage of users who return to the same page or website after a certain period
Bounce rate: the percentage of visitors to a website who navigate away from the site after viewing only one page
Scroll depth: the percentage of the page a visitor has seen. For example, if the average scroll depth is 50%, it means that, on average, your website visitors scroll far enough to have seen half of the content on the page.
Time on site: the average amount of time a user spends on your website before leaving
Average order value (AOV): the average amount of money spent by a customer on a single purchase
Customer satisfaction score (CSAT): how satisfied customers are with your company's products or services
Note: read our full chapter on A/B testing metrics to make sure you collect the most essential data to analyze your experiment
How to understand the ‘why’ behind your A/B testing results
In A/B testing, quantitative metrics are essential for identifying the best-performing variation of a site or product. But even the best-designed A/B tests can’t pinpoint the exact reasons why one variation succeeds over another. For example, why does one version of a CTA work better than the other? And how can you replicate its success across your website?
Quantitative and qualitative A/B testing metrics should work in harmony: quantitative data answers the what, and qualitative data tells you why.
Tools like Hotjar Heatmaps, Recordings, Surveys, and Feedback integrate with traditional A/B testing tools to help you better understand variant performance.
During a test, you can track user behavior and collect insights to understand how each variation affects the user experience on your website. Then, use these qualitative tools to explore more in-depth ideas, learn about common user pain points, or discover which product features are most interesting to them:
Session Recordings and Heatmaps let you visualize how users react to different variations of a specific page, feature, or iteration. What are visitors drawn to? What confuses them?
Surveys take the guesswork out of understanding user behavior during A/B testing by letting users tell you exactly what they need from or think about each variation
Feedback gives you instant visual insights from real users. They can rate their experience with a variant on a scale, provide context and details, and even screenshot a specific page element before and after you make a change.
Next steps to A/B testing
Like with any CRO process, you’re not only looking for the winning A/B test variation—you need actionable learnings that you can apply to your website to improve the customer experience.
If your variation is a winner, congratulations! 🎉 Deploy it, draw conclusions based on the data, and translate them into practical insights that you can use to improve your website. See if you can apply learnings from the experiment on other pages of your site to continue iterating and enhancing your statistically significant results.
Remember that inconclusive and 'failed' tests give you a clear idea of what doesn't work for your users. There are no losses in A/B testing—only learning.
Get the most out of your A/B tests
Hotjar’s digital experience insights help you understand A/B testing results and use them to optimize the user experience.