Learn / Guides / Customer analytics guide
10 customer analytics tools you need to improve CX and build better products
In today’s competitive market, there’s no room for guesswork when it comes to knowing who your customers are, what they want, and how you can help them achieve their goals.
Customer analytics software helps you understand your users to meet their needs more effectively, predict their future behavior, and, ultimately, design better products that will drive business growth.

Finding the right combination of tools to answer all your questions about your customers can be a challenge. You’ll need to use a range of tools to collect and analyze customer data, letting you monitor user traffic and behavior, get direct insights from your users, and find out how customers are responding to your product experience (PX) on social media platforms.
We’ve curated a list of the 10 best customer analytics software options available to help you understand your buyers more deeply. You’ll learn how these tools work, how to combine them, and how they can help you make good business decisions and achieve your goals.
Find out what your customers really think of your site
Collect powerful product experience insights with Hotjar

The 10 best customer analytics tools
Collecting metrics like page views and conversion rates gives you a useful overview to help you spot patterns in customer behavior and measure the impact of your marketing and design changes. But to really understand your customers and improve your product, you also need to find out what motivates your users' actions. To do this, you need tools that provide qualitative data on users’ opinions and feelings as they move through the customer journey on your site.
In this list, we’ll show you both qualitative and quantitative analytics tools, since both have an important role to play in understanding who your customers are and what they want.
Web analytics and product experience insights tools
Web analytics and PX insights tools collect customer engagement data. They provide data points on your customers’ interactions with your website or product. The best options help you understand their behavior and motivations.
1. Hotjar
Hotjar’s Observe tools make it easy to see exactly how your customers are interacting with your product.
Heatmaps aggregate user behavior and show you whether your visitors reach key content or get distracted along the customer journey through visual, color-coded representations of clicks, moves, and scrolls on your web pages.
With click maps, quickly spot where your users click (or don’t click)
With move maps, understand what attracts your users’ attention, and what they miss
With scroll maps, learn how far users scroll down the page and what gets ignored
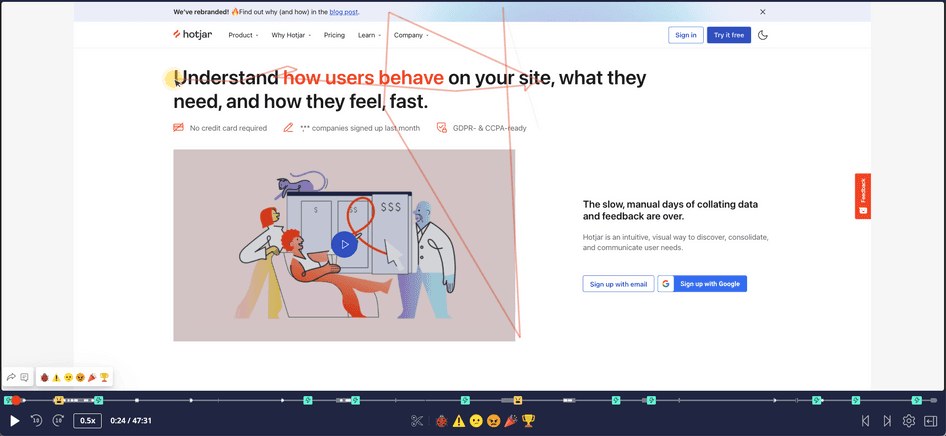
Hotjar’s Session Recordings show you a complete playback of a user’s mouse movements, hovers, u-turns, and clicks as they travel through your site, helping you understand and identify blockers in the customer journey.
Hotjar’s Ask tools make it a breeze to collect customer insights directly from your users.
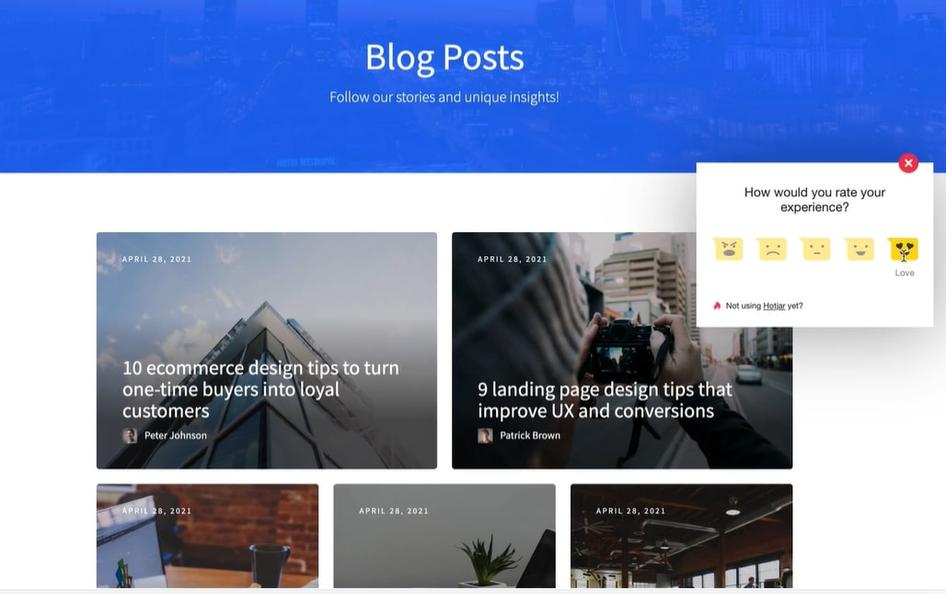
Use Feedback to understand how your visitors feel about different pages and site elements, gauge their overall user satisfaction, and hear their suggestions for improvements.
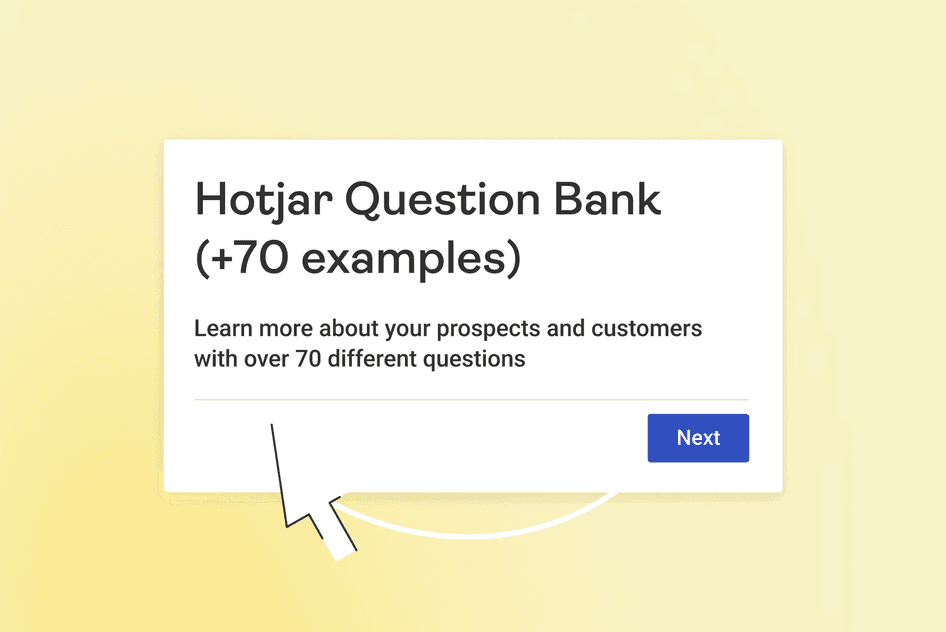
Surveys let you capture the voice of the customer either on- or off-site. The best part? We've created survey templates for customer retention and customer satisfaction surveys, product feedback, traffic attribution, market research, and more.
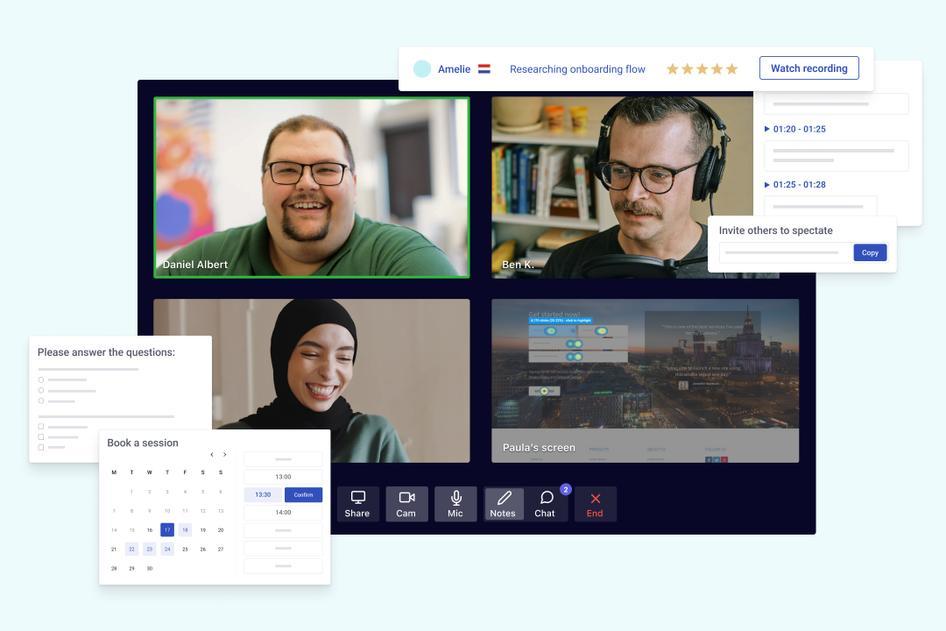
Connect with your users with Hotjar Engage
Need to go even further with your customer data collection? Hotjar Engage lets you recruit and interview users. The meetings are hosted, recorded, and transcribed, so you can focus on gathering key insights from your users.
Key features and benefits
Hotjar’s product experience insights tools are great for collecting granular insights about the customer experience (CX). They add depth to traditional, quantitative analysis software, by providing the why behind the what at every touchpoint during your customer journey analysis.
Combine Hotjar with traditional analytics: have you identified a high churn rate on one of your pages? Watch a session replay to spot what prompted this rage click.
Take advantage of how Hotjar's tools work together: are scroll heatmaps showing you that users don’t scroll all the way down the page before they leave? Set up an exit-intent survey to learn what they were hoping to find.
Use filters and segments when conducting data analysis: filter by events, URL, demographic data, errors, and more, to sort out the data and find exactly what you need.
Discover even more customer analytics tools included in the Hotjar platform
Hotjar integrations let you connect with hundreds of apps to help you with your work. These automations help you communicate insights with your team, complement your A/B tests and experiments with qualitative data, segment users, and more.
Funnels tell you where (and why) users drop off. Identify at which step of journey they leave your funnel, understand why (with recordings and heatmaps), then optimize your conversion funnel.
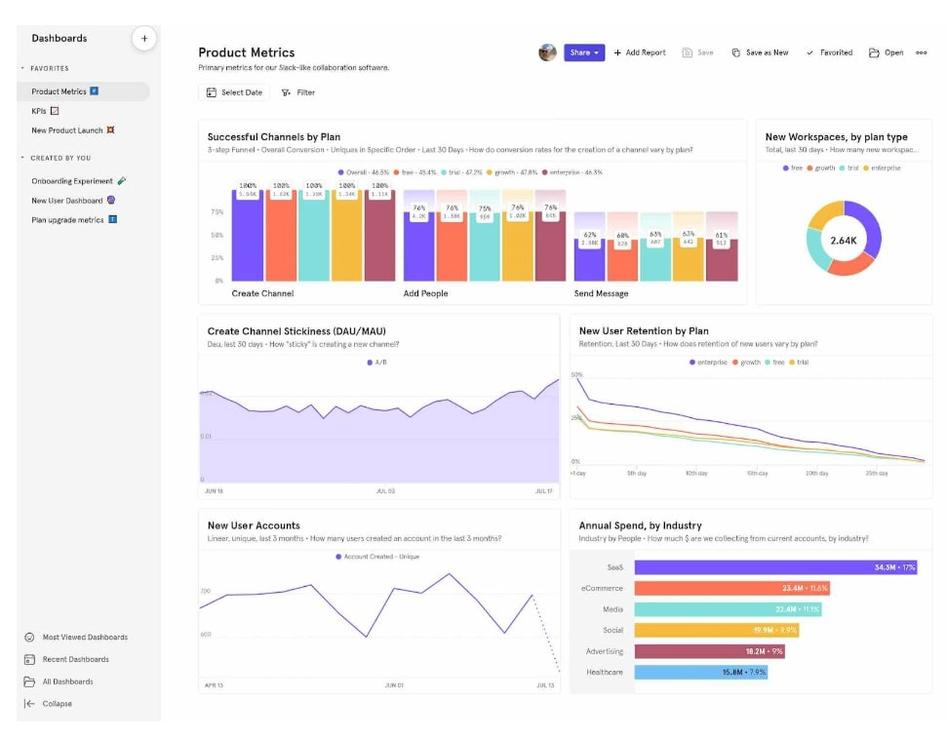
Hotjar’s Dashboard provides intuitive, easy-to-analyze visualizations to help you effectively communicate key information and customer insights to stakeholders, and get buy-in on product improvements.
Hotjar Highlights help teams curate and share the information they need to enhance cross-functional collaboration. For example, customer-facing teams can use Highlights to share feedback with product teams, to find fixes to bugs identified by users.
Note: Hotjar’s tools are privacy friendly and protect users’ data.
Pricing and plans
Observe Plan (Heatmaps and Recordings)
Basic: free
Plus: $32/month
Business: from $80/month
Scale: contact the sales team
Ask plan (Feedback and Survey tools)
Basic: free
Plus: $48/month
Business: from $64/month
Scale: contact the sales team
Engage
Pay as you go: $90/credit
Basic: free
Plus: $72/month
Business: $112/month
2. Mixpanel
Mixpanel is a self-service product analytics platform for web and mobile. It tells you how your customers are interacting with your website and which features and tools they use most, to help you convert, engage, and retain users.
Mixpanel tracks actions that your customers perform—like signups or purchases—and user profiles that show data—like the number of purchases made.
Key features and benefits
Mixpanel helps maximize business resources and saves time by giving all teams access to real-time customer and product data to help them make quick decisions based on user behavior.
It’s great to understand how customers interact with your website both before and after a conversion action. This helps you identify customers most at risk of dropping off or churning, so you can check in with them and give them prompts to continue using your site or complete their purchase.
You can also use Mixpanel to understand a particular stage of the customer journey, like the steps right before a purchase, to help you identify trends and spot problems so you can correct them.
Pricing
Mixpanel has 3 pricing levels:
Free: for up to 100,000 tracked users
Growth: starting at $25.00 per month
Enterprise: contact Mixpanel
Pro tip: combine Mixpanel’s quantitative data with Hotjar’s qualitative insights to improve your site’s UX and increase conversions.
3. Google Analytics
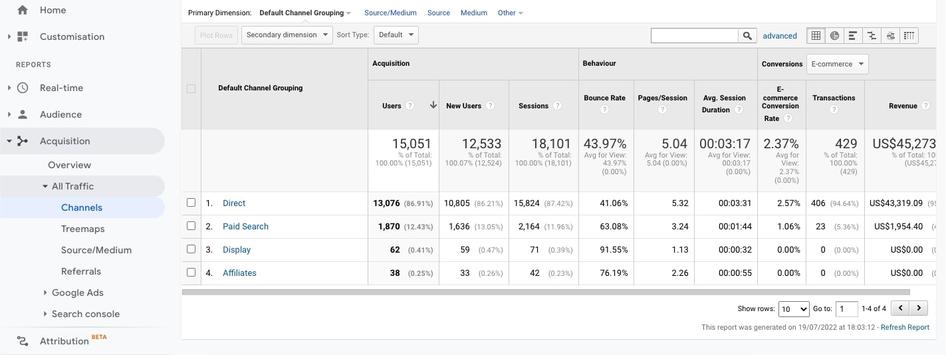
Google Analytics (GA) is a web analytics platform used by over 28 million sites that provides key statistics about how many users are visiting your website, how they got there, and who they are.
GA helps you track and measure metrics such as session duration, pages per session, and bounce rate, and also gives you user insights, like their location, language, age range, and gender.
Key features and benefits
Google Analytics also helps you understand which advertising campaigns are effective as it shows you which sites your users are coming from.
Furthermore, GA tells you which pages your users spend the most time on, and where they’re dropping off. If you have several landing pages, you can see which ones are better at converting users into paying customers.
Pricing
The standard version of Google Analytics is free
Google Analytics 360 is an enterprise version with advanced features that costs $12,500 per month
Pro tip: using both quantitative and qualitative data will give you a complete picture of your customers’ experience and help you identify the best next action to improve their journey.
Use Hotjar’s integration with Google Analytics to help you get the most out of your insights and learn why you need to use both tools together.
4. Kissmetrics
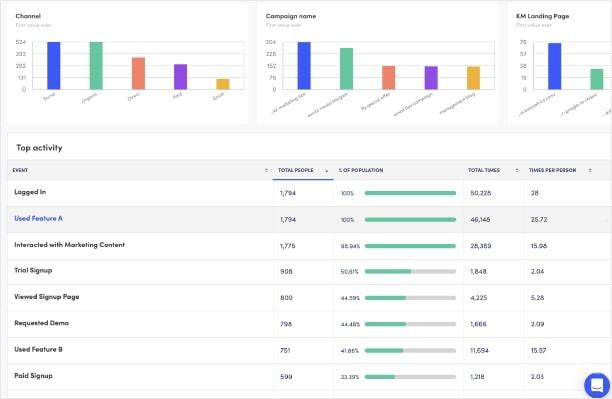
Kissmetrics is a customer behavior analytics tool that focuses on the user, providing in-depth data about the user experience by connecting the data it collects to a real person. Kissmetrics lets you view a user’s full customer journey and identify the drop-off points for every flow on your site.
Key features and benefits
For SaaS companies, Kissmetrics lets you segment different types of customers based on their usage of your product. Its customer segmentation metrics show you who your best customers are, how you originally acquired them, and which features they prefer. This will help you design future versions of your product with these customers in mind.
For ecommerce businesses, in addition to helping you identify who your big spenders or regular customers are and seeing how you acquired them, Kissmetrics helps you find out whether your first-time and repeat purchaser populations are growing or shrinking and discover the lifetime value of your customers by segment. You can also check where customers drop off during checkout, and take action to prevent drop-offs—like sending your customers a targeted email just as they leave to encourage them to continue their purchase.
Pricing
Free trial available
Pricing editions start from $500 per month
⚡Get more out of your data with the Hotjar and Kissmetrics integration:
Filter recordings and heatmap data by Kissmetrics IDs to see how customers interact with your site or product
Target surveys and feedback widgets using Kissmetrics IDs so they display to specific customers
By combining the detailed user behavior data and customer segmentation in Kissmetrics with visual insights and user feedback through Hotjar, you’ll get a more comprehensive understanding of what customers do—and why.
5. Woopra
Woopra tracks how customers interact with your website. Similar to Kissmetrics, the focus is on individual users, and Woopra gives you insights throughout the customer journey, building up a detailed profile for each customer in real-time. You can view data about the most recent pages users have visited and their social media profiles.
Key features and benefits
Woopra helps you segment users by behavior and engagement to build a picture of your best customers and discover their preferences to design for their needs.
Find out which marketing campaigns are most successful and which geographical area accounts for most of your signups, helping you make your site and advertising more effective and targeted in the future.
You can even set up Woopra to send messages to users encouraging them to re-engage with your site when you notice they’re about to drop off.
Pricing
Free version with limited functionality
Paid for versions from $349 per month
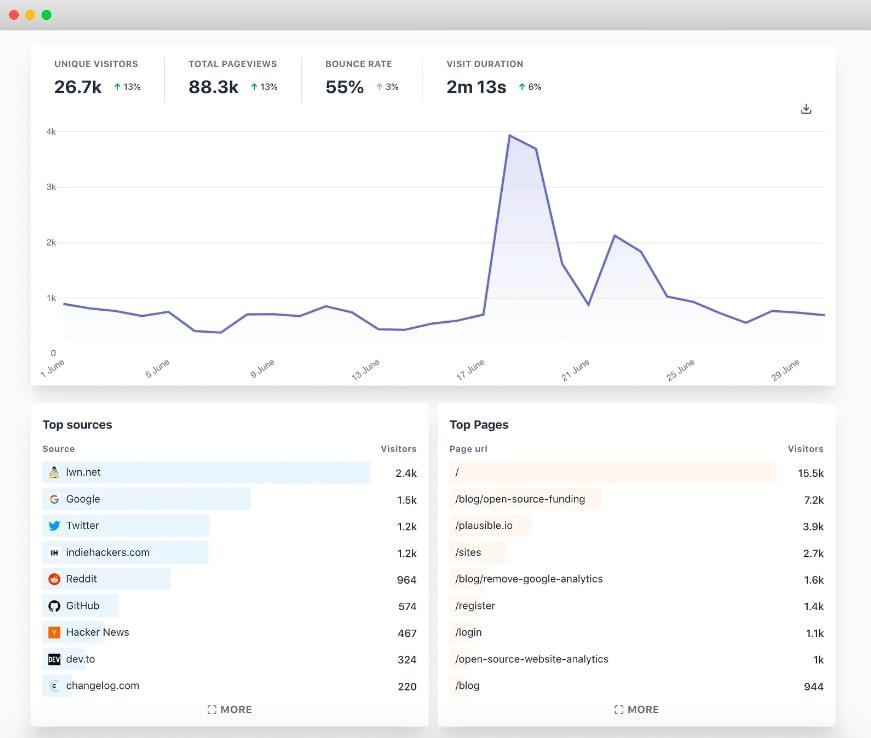
6. Plausible
A privacy-friendly alternative to Google Analytics, Plausible offers open-source web analytics without cookies. It tracks unique visitors, total page views, bounce rates, visit duration and tells you where your users are coming from.
Key features and benefits
One of Plausible’s main advantages is its lightweight script, which is 45 times smaller than the one used by Google Analytics, for example. This means your site will load faster as you reduce your carbon footprint.
You can use Plausible metrics in much the same way as Google Analytics to track events, goal conversions, and campaigns, segment your audience, and track outbound links. Since all site measurement is anonymous, you won’t need cookie banners or GDPR consent opt-ins.
Pricing
From $9 per month for 10,000 page views
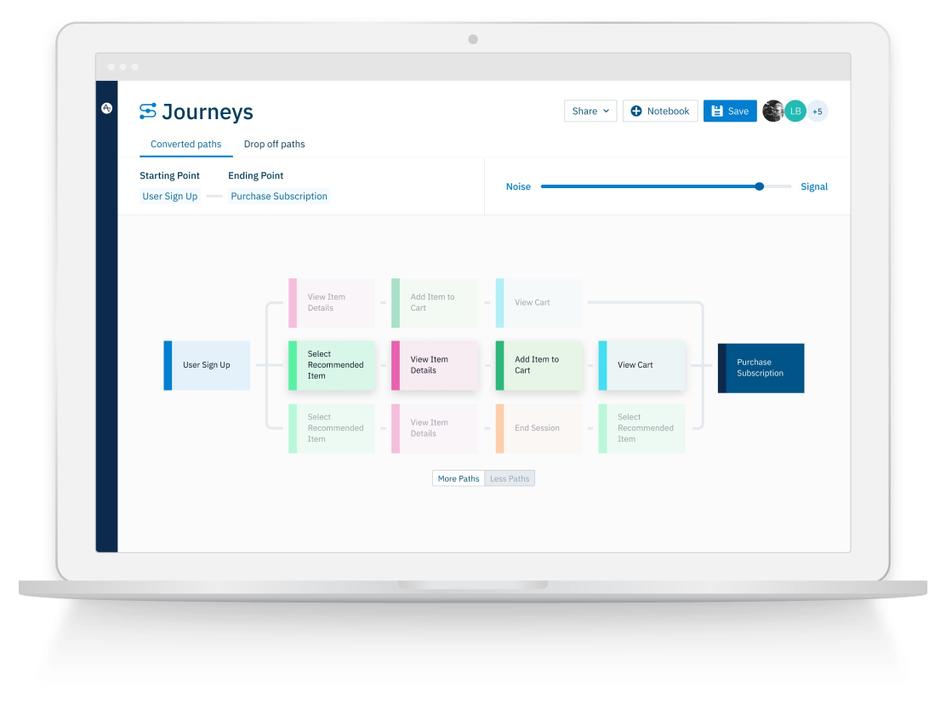
7. Amplitude
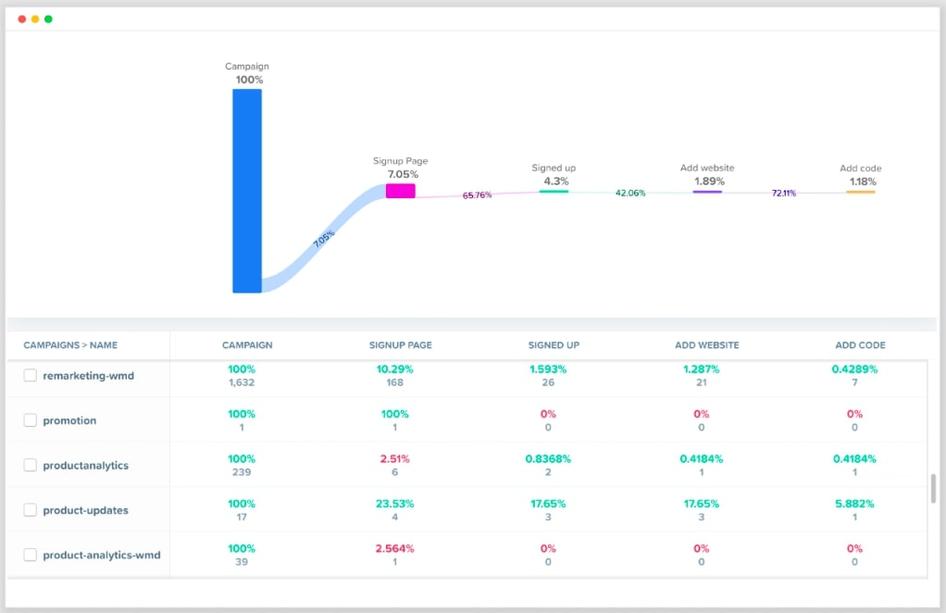
Amplitude is a product analytics tool that helps you create customer journey maps to understand your user's experience. It tracks all the main events in a customer’s journey—from feature engagement to shopping cart abandonment—and lets you analyze user behavior across different devices.
Key features and benefits
Amplitude’s insights help you predict combinations of user actions that translate to customer purchases and loyalty.
Amplitude also lets you see individual-level user behavior to help you target users with action-dependent messages to lower dropoffs.
Pricing
Free starter plan
Paid-for growth and enterprise plans
Social media customer analytics tools
8. Brandwatch
Brandwatch is an AI-powered analytics tool that helps businesses understand how consumers feel about their products and customer experience. It tracks mentions of brands, products, and keywords, so you can monitor online chatter about your own brand and products, along with those of your competitors.
Key features and benefits
Brandwatch helps you analyze online conversations in your sector to benchmark your product's or website's performance against your competitors to see how you compare, and spot ideas for improvement and opportunities for growth.
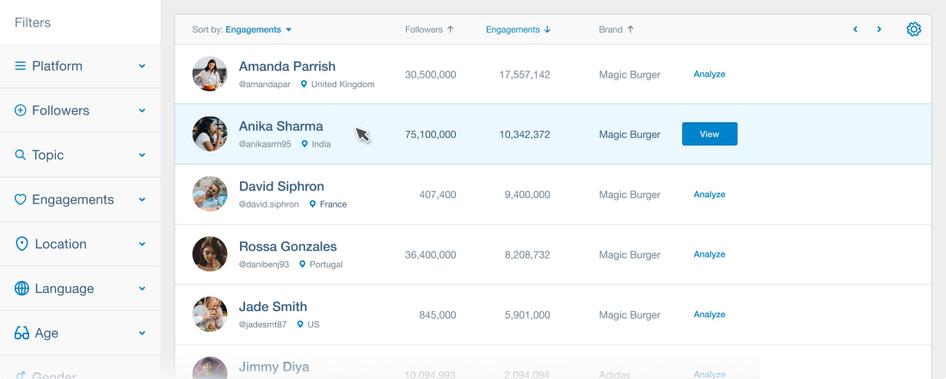
The tool also lets you quickly identify negative reviews about your product experience and respond to customers to turn the conversation around. Another feature of Brandwatch is that it helps you find social media influencers that can help you build trust and credibility with your users.
Pricing
Pricing on request
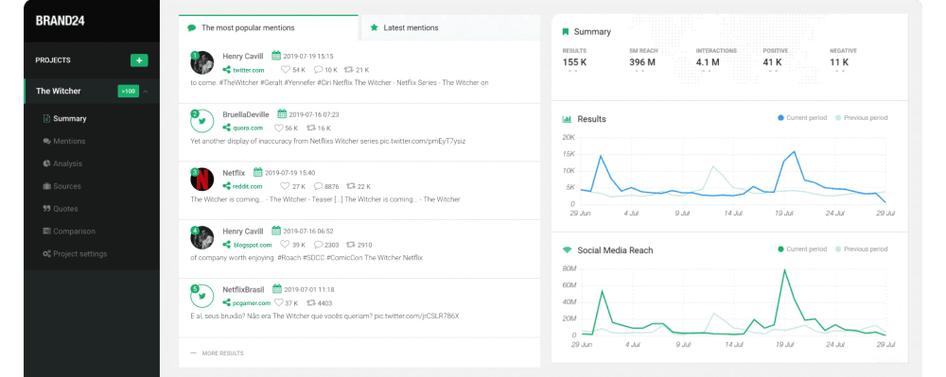
9. Brand 24
Brand24 is another online reputation tool that lets you track customer analytics for your product and the user experience you offer across the web and social media. It also tracks hashtags and keywords relevant to your industry to see how users react to mentions of your brand, including likes, shares, and comments.
Key features and benefits
Use Brand 24’s advanced sentiment detection to segment positive, negative, and neutral mentions of your website and product experience to quickly follow up on online feedback, convert leads into customers, and respond to dissatisfied customers.
You can also the software to test social media campaigns to see which hashtags and posts are most effective in building better product awareness and a stronger social media presence.
Pricing
Individual: $49 per month
Team: $99 per month
Pro: $149 per month
Enterprise: $249 per month
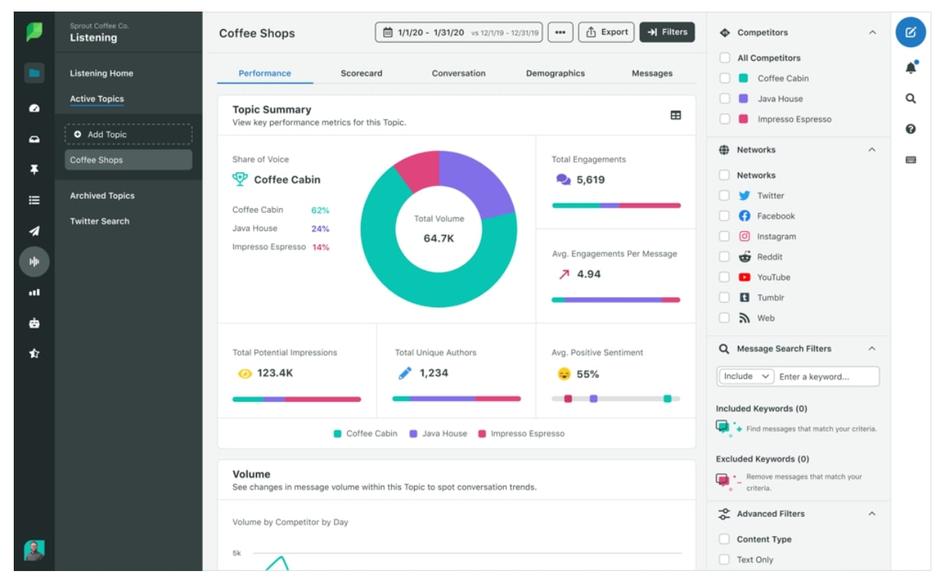
10. Sprout Social
Sprout Social provides analytics for your brand’s presence on social media platforms. It tracks mentions, hashtags, likes, and comments so you can evaluate the success of your social media campaigns among customers and potential customers.
Key features and benefits
Sprout Social uses a centralized inbox that allows you to monitor and reply to messages across different social media platforms. It also generates content suggestions with fresh ideas to help you add to the discussion around trending topics.
Another useful Sprout Social tool is its chatbox function, which you can use to communicate with your customers via Twitter DMs or Facebook conversations.
Pricing
Standard: $89 per user/month
Professional: $149 per user/month
Advanced: $249 per user/month
Combine top customer analytics tools to create an amazing product experience
Collecting reliable data about your customers is the best way to understand who they are and what they want from your business.
But there isn’t a single tool that can deliver all the customer insights you need. Instead, put together a varied tech stack that includes web metrics and social media metric tools, and product experience insights tools, like heatmaps and session recordings.
This combination of quantitative and qualitative data will give you a complete picture of your customer's experience and help you identify the next action you need to take to help them achieve their goals and create satisfaction.
Find out what your customers really think of your site
Collect user behavior insights with Hotjar