Learn / Guides / Product-led growth guide
9 product-led growth metrics to track PLG success
In product-led growth (PLG), the product itself is your primary way to attract, convert, and retain users. Tracking the right PLG metrics will help you align your product-led approach with larger business goals and make data-driven decisions about what to work on next.

In this chapter, we take you through nine essential metrics you should consider tracking to measure the effectiveness of your PLG strategy.
Insights to power product-led growth
Hotjar Heatmaps, Recordings, Feedback, and Surveys help you fuel product-led growth by putting users first.

What are product-led growth metrics?

Product-led growth metrics are qualitative and quantitative KPIs (key performance indicators) that measure the impact and success of a PLG strategy.
PLG metrics matter to any team or company aiming to scale using product-led growth. They:
Provide a common language for teams to measure and report progress company-wide
Keep cross-functional teams working toward the same product-led goal
Help drive decision-making by focusing on the most meaningful and impactful opportunities
To make it easier to find the metrics you need, we've grouped them into two sections: revenue metrics (to measure and forecast financial growth), and customer and product experience metrics (to measure how valuable your product is to users).
You’re not expected to track or focus on all the metrics in this list—pick the ones that align best with your product and business goals.
PLG revenue metrics
While PLG companies often offer freemium accounts (like we do here at Hotjar 👋), driving revenue is still the end goal for most businesses.
These five revenue metrics will help you measure how efficiently your product attracts, retains, and grows paying customers.
1. Customer acquisition cost (CAC)
Product-led growth is about bringing your customer acquisition cost as close to zero as possible.
Customer acquisition cost (CAC) is the cost of getting a new customer, including all sales and marketing costs.
Calculate CAC by dividing the total amount spent on sales and marketing by the total number of paying customers. CAC is also measured as a ratio of LTV (see below—a typical SaaS LTV:CAC benchmark is 3:1).
CAC is typically very low for product-led companies, as new customers self-serve and find the product via word-of-mouth referrals or low-cost organic channels.
2. Customer lifetime value (LTV)
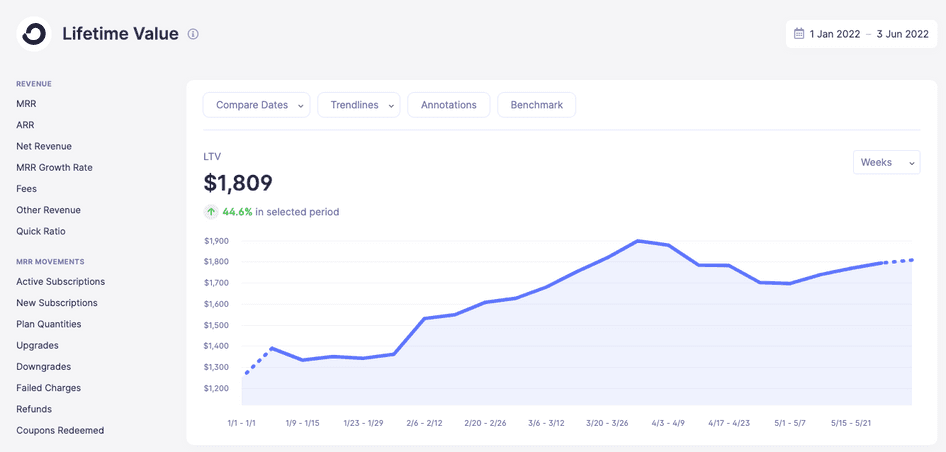
LTV at ConvertKit is over $1800
Customer lifetime value (LTV, or CLV, or CLTV) is the average revenue a customer is expected to generate.
Calculate LTV by dividing the monthly average revenue per account (ARPA) by your user churn rate (see below). ARPA is MRR (monthly recurring revenue) divided by the total number of customer accounts.
LTV helps product-led teams forecast how valuable customers will be to the business over time, compared to metrics like MRR and ARR (annual recurring revenue) that only represent revenue as it stands today. Product-led LTV is expected to be high as effort is made to offer consistent value to users, making them less likely to churn and more likely to bring revenue to the business over time.
3. Revenue per employee (RPE)
Revenue per employee is a company’s ARR divided by the number of full-time employees.
Product-led companies can achieve higher RPE because PLG marketing and development requires less staff than traditional sales teams. For example, Buffer is a primarily product-led company that brings in over $220,000 in annual RPE, far exceeding industry benchmarks.
Note: revenue per employee doesn’t take into account contractors, agencies, or freelancers, so if those are a large part of your business model, RPE may not be a good indicator of product-led success.
4. Free trial conversion rate
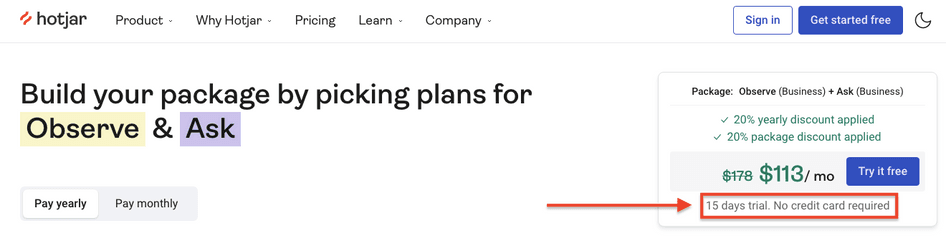
Free trial conversion rate measures the number of users who become paying customers during a free trial period.
Free trial conversion rate is calculated by dividing the number of successful trial-to-paid users by the total number of free trial users in any period.
Since following a product-led growth strategy builds a positive product and user experience, the free trial conversion rate for PLG companies should be high because users can quickly receive value from the product (see TTV below) and understand how they can use it to succeed.
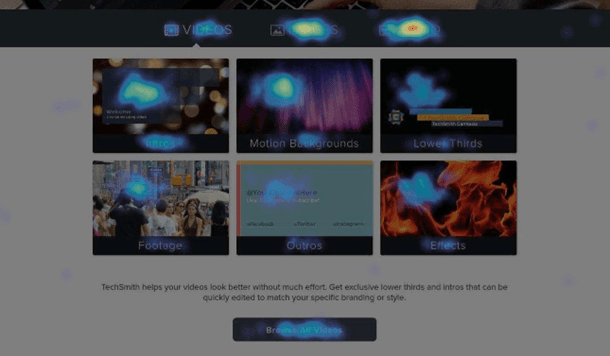
Try it yourself: improve free trial conversion rate with heatmaps.
Look at heatmaps on key pages (e.g. your pricing page or product dashboard) to see how free trial users move, click, and scroll, so you can spot what’s delivering value and what is being ignored.
How can you know which clicks are made by trial users? If you’re using Hotjar Heatmaps, you can filter heatmaps by the ‘on_trial’ User Attribute to generate a visual overview of how trial customers behave—share it with stakeholders and teams to get buy-in and ideas for improving the free trial conversion rate.
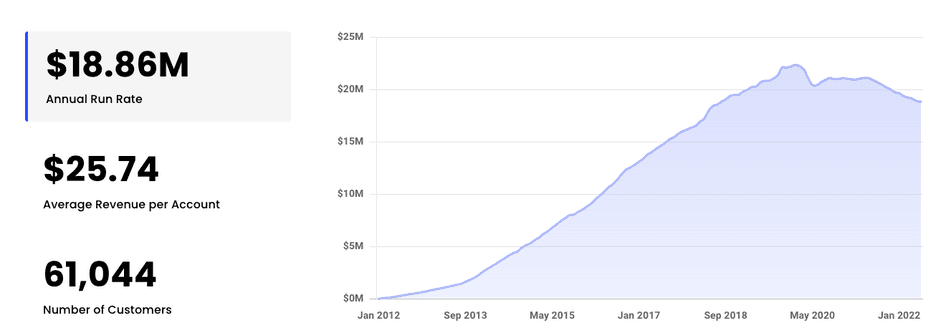
5. Expansion MRR
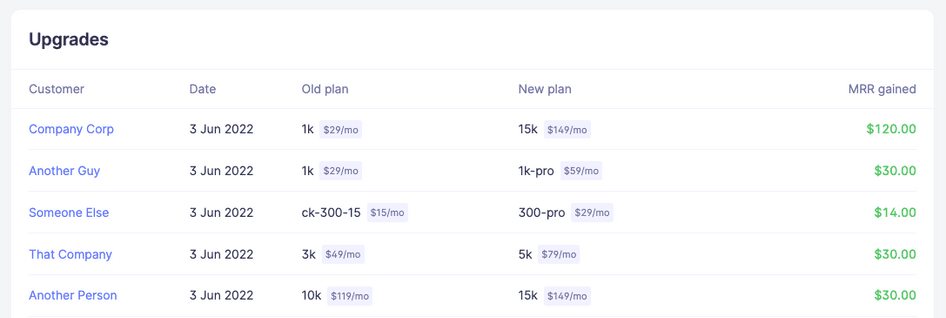
Expansion revenue at ConvertKit
Expansion MRR (also known as expansion revenue or negative churn) is the additional monthly revenue generated when existing customers upgrade plans or purchase extra products or services.
Calculate expansion MRR by totaling revenue from customer upgrades and additional purchases in a month.
Expansion revenue is more cost-effective than attracting new customers (see CAC above) and demonstrates product value for existing customers, making it a key indicator of product-led success.
Pro tip: use surveys to find out what leads people to upgrade and downgrade.
To increase expansion MRR, you need to know what’s going well for your upgrading customers, and what’s gone wrong for those who are downgrading. Find out by:
Adding a survey to your upgrade confirmation page to ask what prompted users to upgrade
Adding a survey to your downgrade flow to see what’s causing people to leave
If you’re using Hotjar Surveys, you can combine responses with Recordings to get a big-picture understanding of how a user’s product usage led to an upgrade or downgrade.
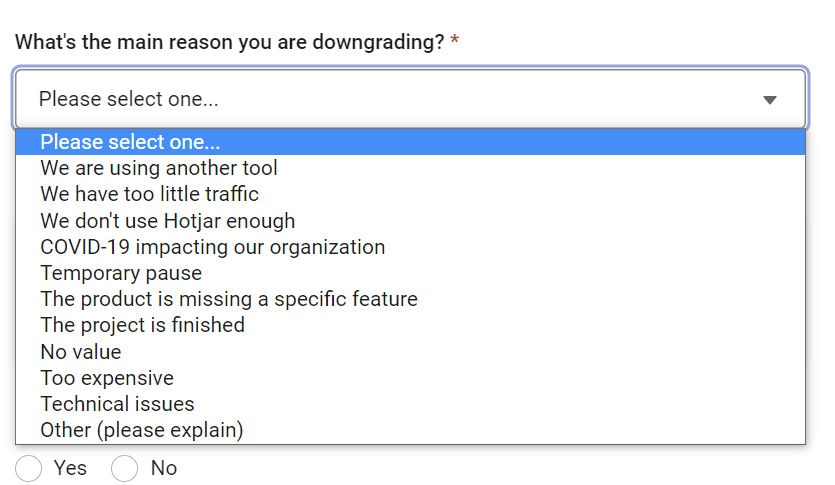
Hotjar’s downgrade survey helped the team learn that most users intend to upgrade again in the future
PLG customer and product experience metrics
Delighting customers is the most important part of a product-led growth strategy: when customers achieve success with a product, they're likely to keep using it, expand their business, and recommend it to others—all essential ways PLG companies grow.
The next five product metrics will help you measure how important your product is to users, and what’s keeping them engaged.
6. Time to value (TTV)
Quick time to value is very important for product-led growth, so we look at time to first value, as well as engagement and user retention within the first 14 days.
Time to value (TTV) is how long it takes users to get value from your product. Time to first value (TTFV) measures the length of time between a user signing up and completing the onboarding process.
For a product-led strategy to work, TTV needs to be short because users must quickly derive value from a product (often while on a free plan or trial) before they subscribe, upgrade, or share their positive experience with others (part of the product-led growth flywheel).
Optimizing for quicker TTV is a two-step process:
Understand customers’ JTBD, i.e. what they need from the product
Onboard customers so they can get value ASAP
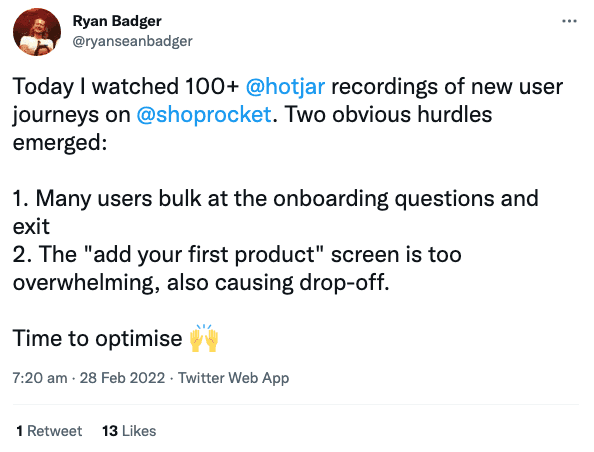
Try it yourself: watch recordings of new customer journeys to improve your onboarding flow.
Use session recordings to watch where new users are getting stuck; filtering recordings for rage clicks will show you where users click repeatedly in a short period, letting you know something isn’t right.
Once you see what’s causing frustration, you can implement a fix to remove friction and barriers from the onboarding process, improving time-to-value.
7. Churn rate
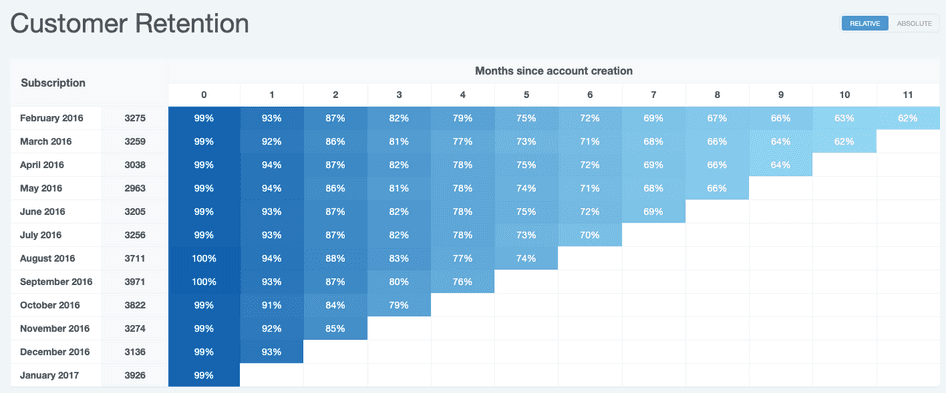
Churn (or customer attrition) is the rate at which customers leave, either by unsubscribing or not renewing subscriptions.
Calculate churn rate by dividing the number of customers lost in a month by the number of customers you had at the start of the month, and multiply by 100.
High churn—and its counterpart, low retention—is a problem for SaaS companies, as it can mean customers no longer see value in a product. With a product-led approach, churn should be low, because delivering consistent user value is a business priority. For example, user churn at Buffer was around 3.2% when they used to publicly report the metric, which is lower than the SaaS average of around 5%.
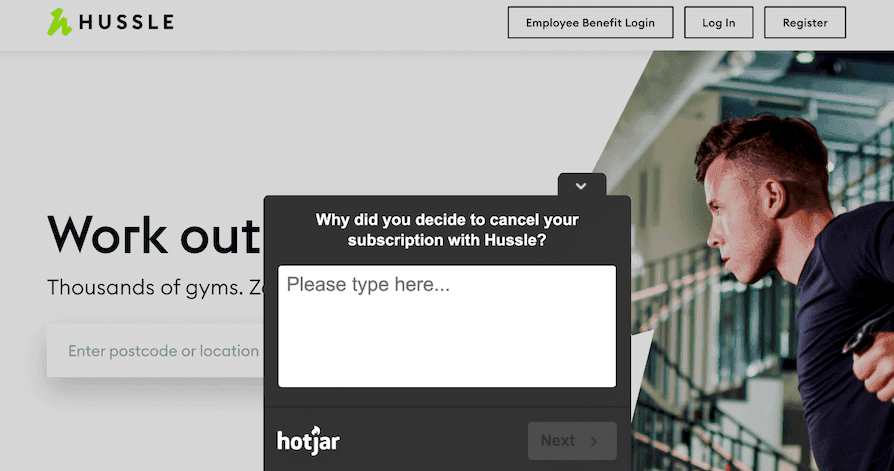
See it in action: Hussle, a gym pass platform in the UK, reduced churn with one question.
The team at Hussle used a Hotjar Survey to get feedback from users who canceled their subscriptions, by simply asking: why did you decide to cancel your subscription?
Luke Calton, Hussle’s Product Lead, exported survey data as a CSV file, grouped similar responses into themes, and found that 26% of churning users chose to buy membership directly from a local gym. The insight led the team to prioritize a new product feature and allow users to buy gym memberships directly through Hussle, leading to a reduction in churn and an increase in customer retention.
Not bad for a single survey question!
8. User feedback
User feedback is any information collected directly from users or customers about their reactions to a product, service, or website experience.
Measure user feedback using quantitative survey metrics like:
Net Promoter Score® (NPS): how likely users are to recommend your product on a scale of 0–10
Customer Satisfaction Score (CSAT): a yes/no measure of user satisfaction with a product or feature
Customer Effort Score (CES): how much effort it took users to complete an action, e.g. signing up
Collect qualitative feedback using open-ended survey questions, for example:
Point-of-conversion survey: to find what almost stopped people converting
Retention survey: to find out why customers are downgrading
Churn survey: to ask why users are leaving
Live feedback: to give users the chance to leave feedback any time they need to
Pro tip: collect product feedback from anywhere in the user journey.
Putting users first means always being open to feedback—something that’s easy to collect with Hotjar’s Feedback tool, a discreet, always-on widget to get feedback wherever users want to leave it.
Users can rate their experience by clicking love/hate emojis, adding a text comment, and even highlighting page elements to provide context. They’ll have the chance to leave their email if they want you to follow up on an issue, and you can dig deeper by combining feedback responses with Hotjar Recordings to see how users browsed before and after leaving a comment.
9. Product qualified leads (PQL)
A PQL is a trial or free plan user who matches your ideal criteria for converting into a paid customer. For example:
The user fits your ICP (ideal customer profile)
The user reaches a value threshold (e.g. collecting 100 survey responses)
The user shows purchase intent (e.g. visiting the pricing page)
To find out what a PQL is for your product, look at existing paying customers and see what they have in common and what actions they took before converting (pro tip: look at session recordings to see what paying customers did just before they converted).
PQLs are valuable to product-led teams because they’re closer to conversion than marketing and sales qualified leads (MQLs and SQLs). Instead of guessing their needs, you can already see how they’re using your product with tools like heatmaps and session recordings.
PQLs are also great candidates for surveys: try triggering a survey when PQLs exit a pricing page to ask them what’s stopping them from continuing.
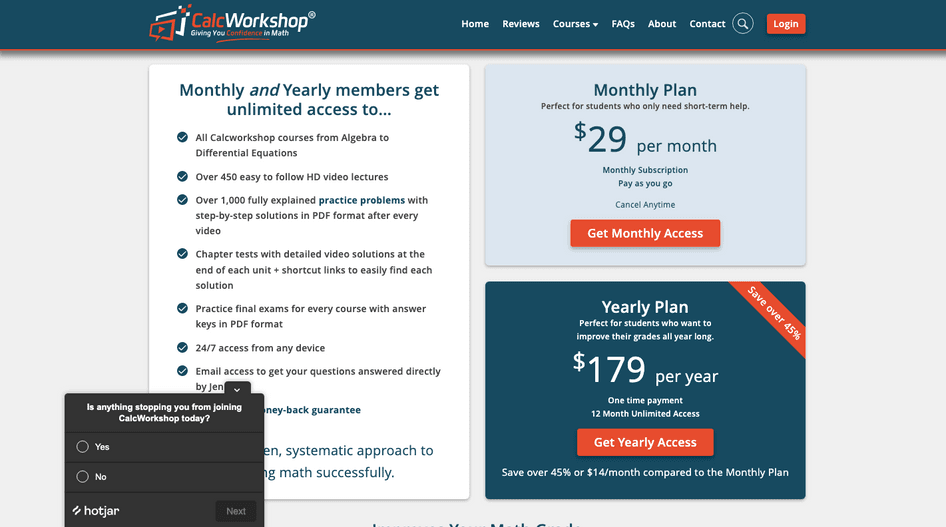
Try it yourself: add a pricing page survey to see what’s holding people back.
CalcWorkshop, an online math tutoring subscription service, uses a Hotjar survey on their pricing page to ask one simple question: is there anything stopping you from joining today?
You can do this yourself by using Hotjar’s free pricing feedback survey template to find out if potential customers have all the information they need, and if there’s any confusion or reservation about pricing.
2 ways to use tools to track and improve PLG metrics
Now you know which product-led-growth metrics to track, start tracking them using product-led growth tools:
Use product tracking tools like Mixpanel, ChartMogul, and Baremetrics to automatically monitor PLG metrics like churn and expansion revenue, and identify cohorts for further investigation.
Use product experience insights platforms like Hotjar to see the user behavior behind the metrics—how users navigate your product, what annoys them, and what’s giving them joy—so you can optimize their product experience.
We know it works: the product team at Hotjar uses Mixpanel, Tableau, and Hotjar (of course!) to ensure we deliver user value and fuel product-led growth.
Insights to power product-led growth
Hotjar Heatmaps, Recordings, Feedback, and Surveys help you fuel product-led growth by putting users first.