Learn / Guides / Website tracking guide
15 best website tracking tools to measure traffic, user behavior, and performance
A website tracking tool will track, measure, and report on website activity and visitor behavior including traffic, user clicks, and performance (e.g. conversion rate). Tracking tools show you what’s happening on your website so you can learn what is (and isn’t) working and optimize for improved UX and business goals.
5 popular free website tracking tools
If you’re looking for free web tracking tools, here’s a cheat sheet of the most popular ones covered in this guide:
Google Analytics: measure website traffic and find your best (and worst) performing pages
Hotjar: track user behavior and gather digital experience insights with heatmaps, session recordings, surveys, and user feedback
Google Optimize: A/B test page variations to find the best-performing designs
Google Search Console: measure SEO performance and check for crawling and speed errors
Mixpanel: monitor product metrics like activation, retention, and churn
⚠️ Google is sunsetting Google Optimize in September 2023. While you can still use the tool until then, you’ll need to switch over to an alternative afterwards. We included alternatives on this page.
Whether you’re new to website tracking or looking to get deeper insights than the usual traffic stats, you’ll find the best tools here, broken down into three categories:
💭 Understand your users with Hotjar
Use Hotjar to safely track user behavior and understand how people experience and interact with your website or app.

Website traffic tracking tools
Traffic is usually the first thing that gets tracked on a website or app, by using web analytics tools. Traffic metrics can tell you how many site visitors you have, how they found you, how long they spend browsing different pages, and how frequently they’re converting into customers.
What traffic metrics can you track?
Pageviews
User source and medium
Session duration or time on page
Visitor location
Device type (i.e. desktop, tablet, or mobile)
Event tracking
5 top website traffic tracking tools
1. Google Analytics
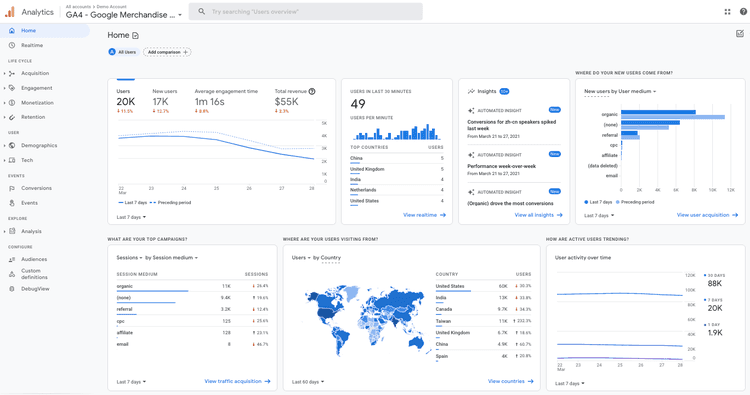
What it is: Google Analytics is the veteran of the list and the most popular website analytics tool.The latest version,GA4, puts more emphasis on how visitors use your site, not just traffic.
What you can track: new and returning users, engagement, revenue, retention, demographics, conversions, and events.
Price: free (with limits); upgrade to the paid version (Google 360) for more features and unlimited traffic.
💡 Complement Google Analytics’ quantitative user data with Hotjar’s qualitative intelligence to gather even more valuable insights. Use the Hotjar and GA integration to understand the user behavior behind GA’s numbers.
2. Adobe Analytics
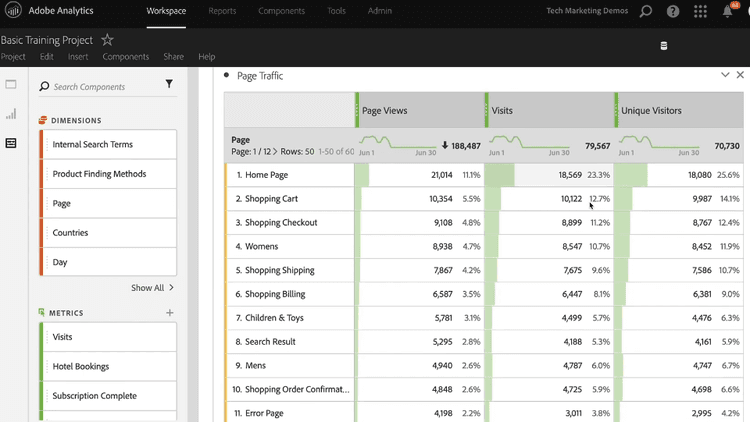
What it is: Adobe Analytics is a traffic analytics and multichannel data collection tool, designed for advanced users and enterprise companies.
What you can track: business intelligence (BI) and traffic data from websites, emails, and apps, including pageviews, unique visitors, purchases, order attribution, segmentation, and customer journey analytics.
Price: on request.
3. Matomo (formerly Piwik)
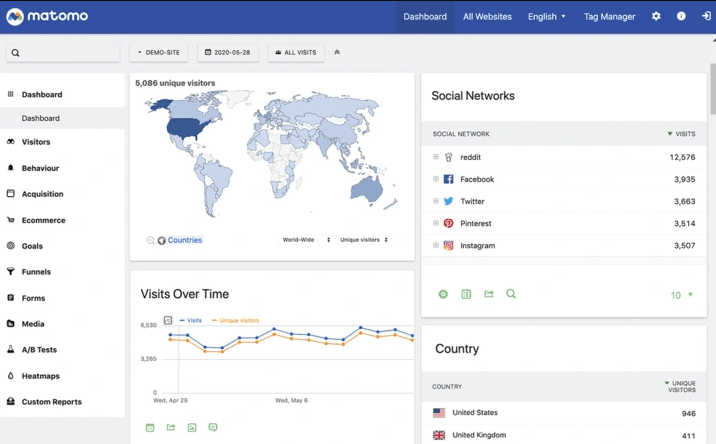
What it is: Matomo is an open-source web traffic analytics tool.
What you can track: unsampled traffic metrics, ecommerce and event tracking, custom dimensions, goals, and segments.
Price: free (self-hosted).
4. Clicky
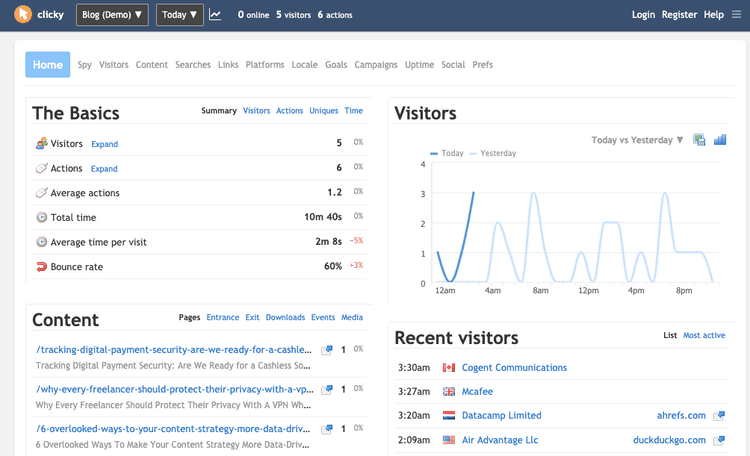
What it is: Clicky is a real-time website traffic analytics tool.
What you can track: real-time data, including visitors, pageviews, and events.
Price: from free for 3,000 pageviews/day.
5. Fathom
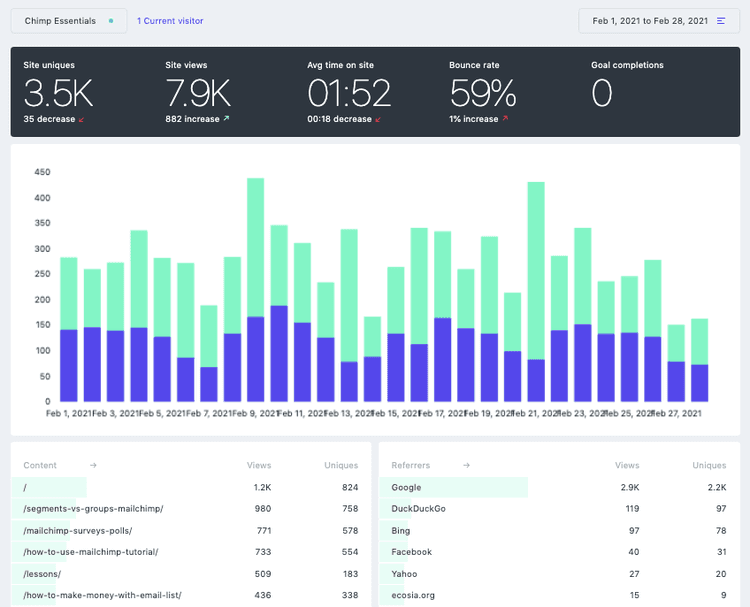
What it is: Fathom is a simple, privacy-focused analytics tool.
What you can track: site views, unique views, average time on site, bounce rate, goal completions, referrers, country, user device, and browser type.
Price: from $14/month for 100,000 pageviews.
💡 Pro tip: website tracking isn’t limited to websites you own; you can also track traffic on competitor websites with tools like SimilarWeb, Ahrefs, and Semrush. The data isn't 100% accurate but should give you a relative understanding of how your website traffic compares to other sites.
Website behavior tracking tools
By tracking traffic, you’ll get a good idea of what’s happening on your website—the most popular pages, where people leave from, and where they spend time browsing. Now, you’re ready to track how people interact with your pages.
What is behavior tracking?
Behavior tracking shows you where your users click and how they scroll or navigate between pages. The main goal behind user behavior tracking is to measure user experience, find opportunities to improve UX and, as a result, increase conversions and revenue.
What tools can you use to track user behavior?
Heatmaps: see an overview of where visitors click, tap, and scroll on a page.
Session recordings: view how each user browses across multiple pages.
A/B testing: create page design variations and test which performs better.
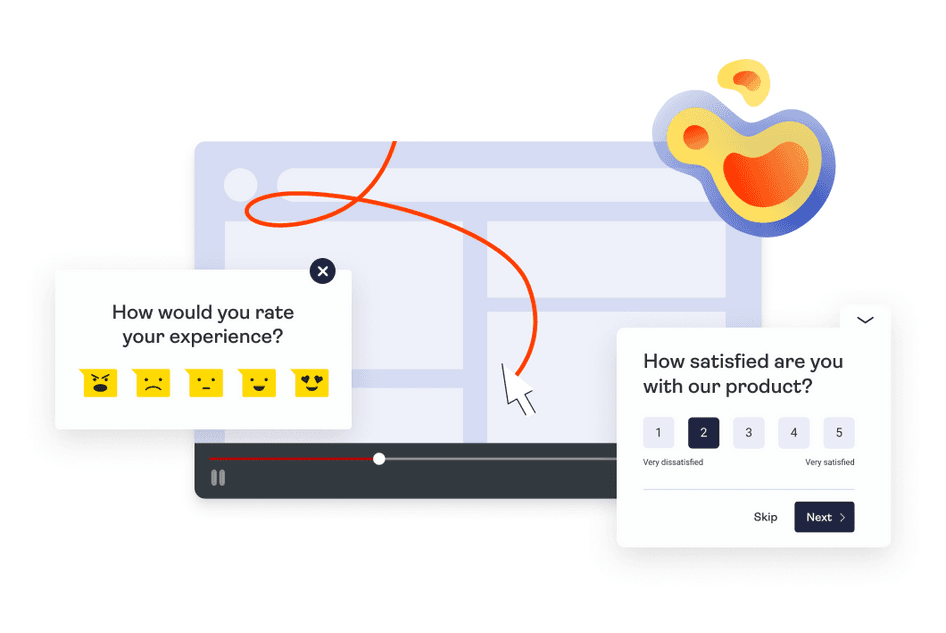
Surveys and feedback widgets: get direct feedback from users and track sentiment and satisfaction over time.
User testing: interview users as they navigate your site.
4 user behavior tracking tools to improve your website
1. Hotjar
What it is: Hotjar (that’s us, hi there! 👋) is a digital experience insights platform that helps you connect the dots between what your users do—and why—all in one place, so you can confidently create and optimize user experiences that convert..
What you can track: product experience insights like aggregated visitor clicks, scrolls, and mouse movement with heatmaps; individual user browsing behavior with session recordings; and user feedback with on-site surveys, a feedback widget, and user interviews.
Price: get started for free.
💡Pro tip: Hotjar isn’t technically a single website visitor tracking software, it’s five tools in one, all available on our free plan: Heatmaps, Recordings, Surveys, Feedback, and Engage.
And you can get even more out of the platform with features like Funnels and integrations with popular tools like HubSpot, Slack, Microsoft Teams, Mixpanel, Unbounce, and more!
3 ways to track and analyze user behavior with Hotjar
1. Visualize interaction patterns with Heatmaps Engagement zones
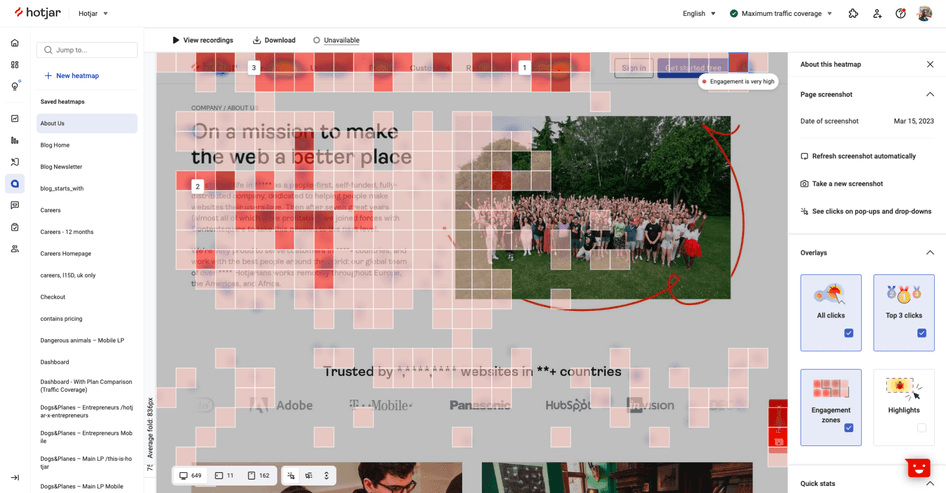
What is it: Heatmaps Engagement zones measure aggregated clicks, taps, scrolls, and mouse movement data on any page (from a website or single-page application).
When to use it: use Engagement zones to optimize the layout, content, or usability of any page based on user engagement patterns. See where users interact the most (or least) and get a visual overview of what content is getting seen and what’s being ignored. Use this insight to make changes to your pages and improve UX.
💡Pro tip: complement Engagement zone data with rage click maps to identify points of frustration, then reduce friction on your key pages.
Example of a rage click map
2. Watch session recordings of frustrated users
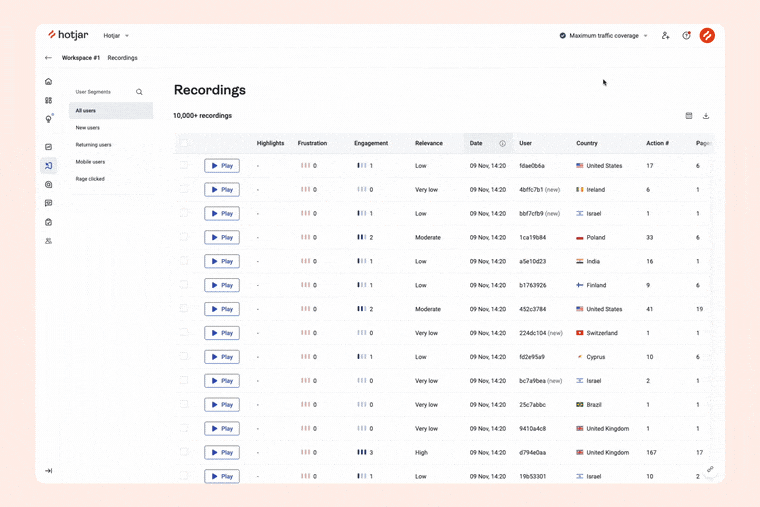
What is it: the Frustration score filter in Recordings lets you cut through the noise and surface only the recordings with the most valuable insights for you.
When to use it: use Frustration sorting to experience your frustrated users’ sessions from their eyes and understand exactly what went wrong, so you can fix it.
💡Pro tip: use Funnels to identify where your users drop off, then watch recordings of users who didn’t convert to understand why.
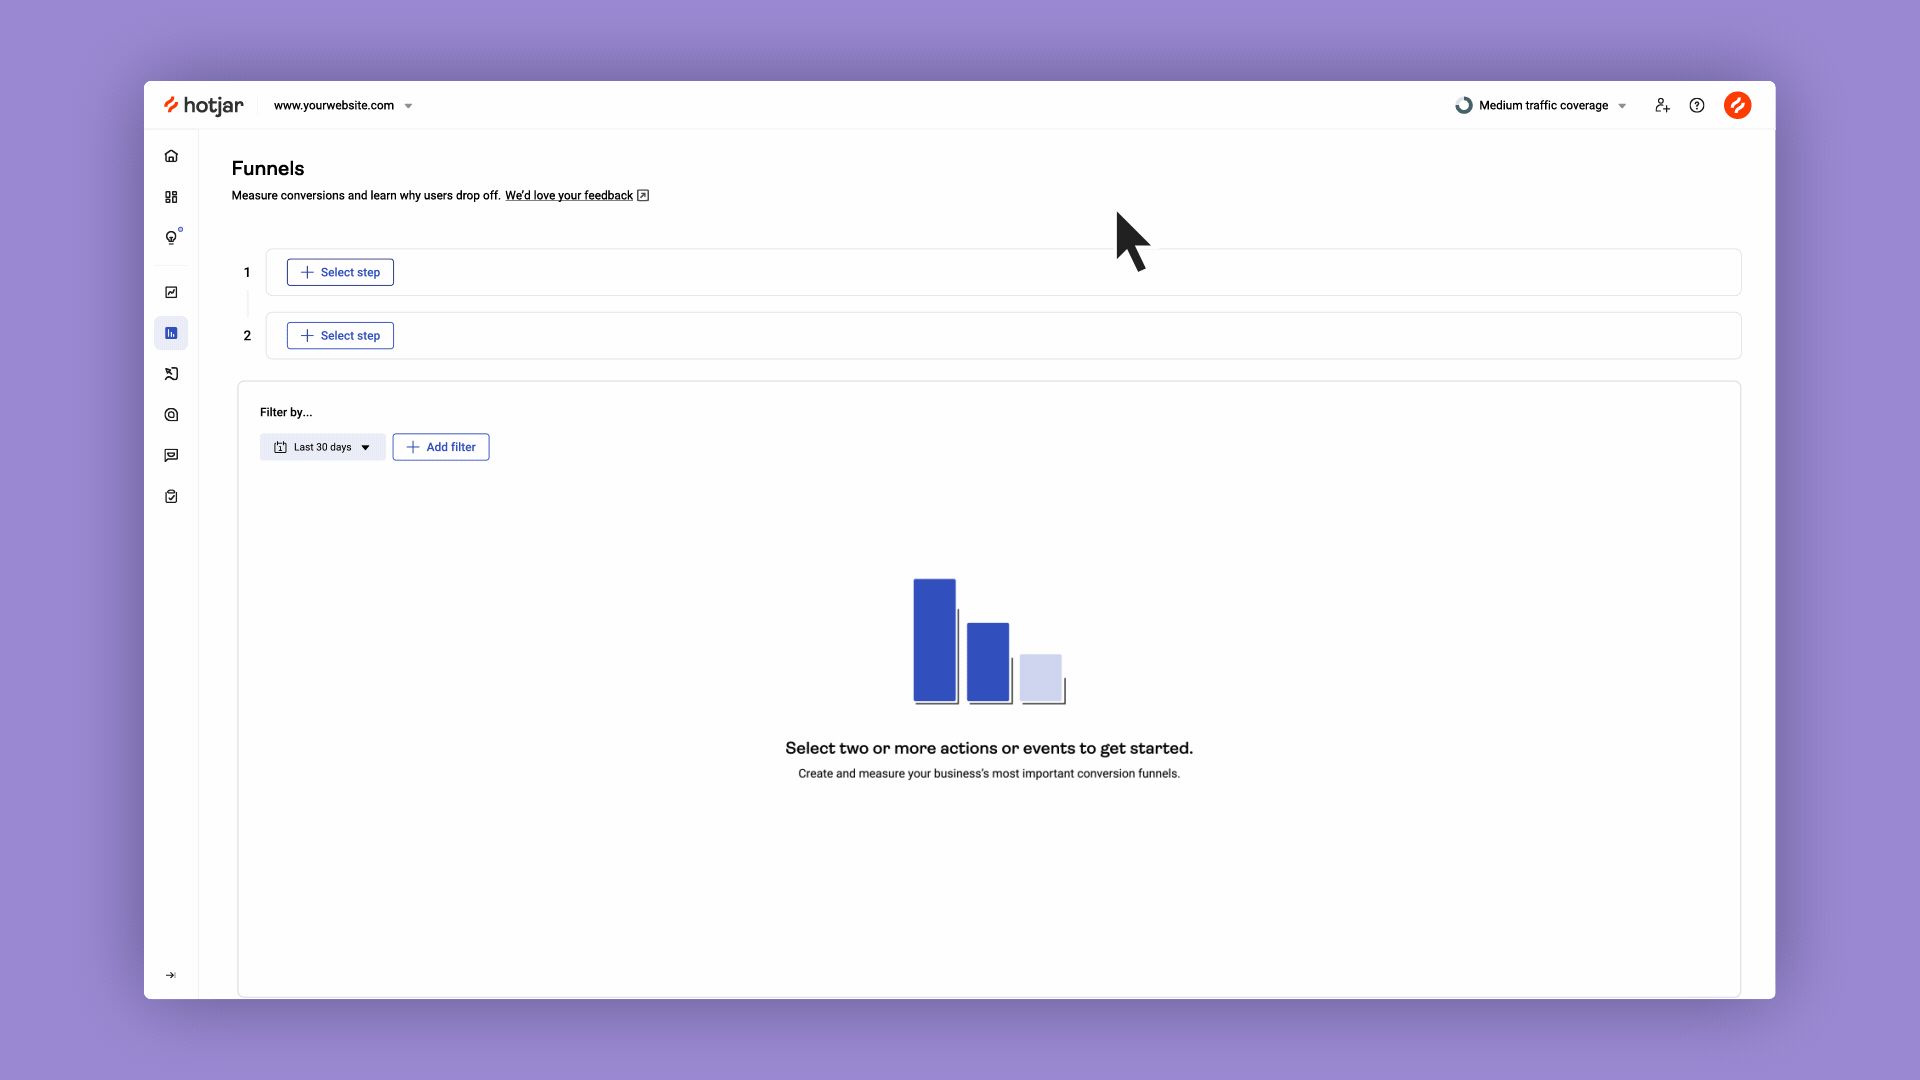
From Funnels to Recordings in just one click
3. Gather insights directly from your users with Surveys and Feedback
What is it: Hotjar Surveys and Feedback are voice-of-the-customer (VoC) tools that give you insight directly from the best source of data: your users. Collect in-the-moment feedback with floating or embedded widgets, or trigger surveys as popups, screen takeovers, buttons, or send them by email.
When to use it: use surveys to track customer satisfaction (CSAT surveys), how easy (or hard) it is to use your site or product (CES surveys), how likely they are to recommend your products or brand (NPS surveys) over time, and more, with 30+ survey templates.
💡Pro tip: with AI in Surveys, fast-track the creation of surveys. Whether you have user research experience or not, let artificial intelligence do the legwork: simply enter your goal and let AI create the survey questions for you.
💭 Understand your users with Hotjar
Use Hotjar to safely track user behavior and understand how people experience and interact with your website or app.
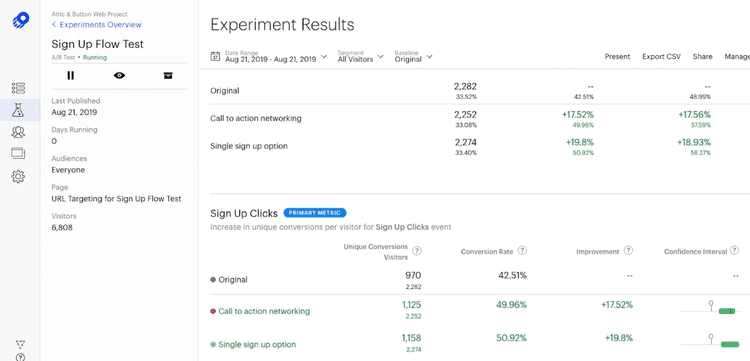
2. Google Optimize
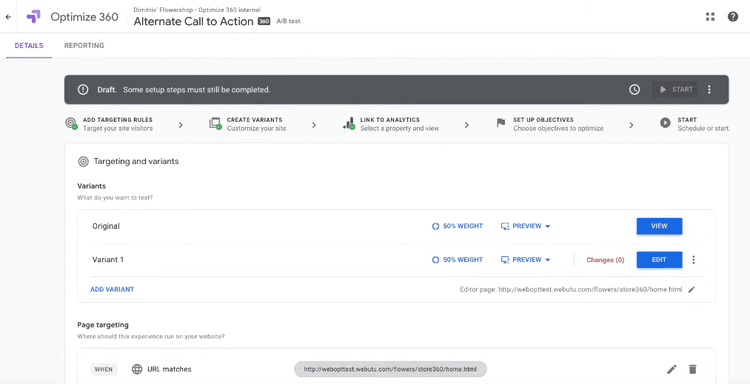
What it is: Google Optimize is a website experiment platform that integrates with Google Analytics.
What you can track: using A/B testing, split testing, and multivariate testing (MVT), you can test variations of different web pages and measure how they perform.
Price: free (with limits), upgrade to the paid version (Optimize 360) for more features.
⚠️ Google Optimize is sunsetting in September 2023! Here are some alternatives. But in the meantime…
Hotjar + Google Optimize = 🔥
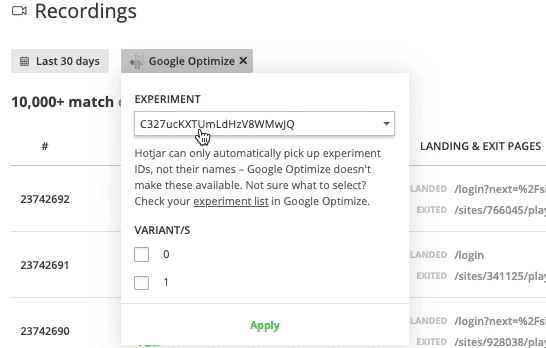
Hotjar automatically integrates with Google Optimize so you can filter Hotjar Session Recordings by Optimize experiment ID and see exactly how visitors browse, click, and scroll on each test page.
3. Optimizely
What it is: Optimizely is a website optimization tool that allows you to run website experiments.
What you can track: A/B, MVT, and split testing results to test variations of different landing pages and optimize performance.
Price: on request.
💡 Get more from Optimizely: Hotjar integrates with Optimizely so you can filter Session Recordings and trigger Surveys by page variant, giving you more data to understand why some pages outperform others.
4. UserTesting
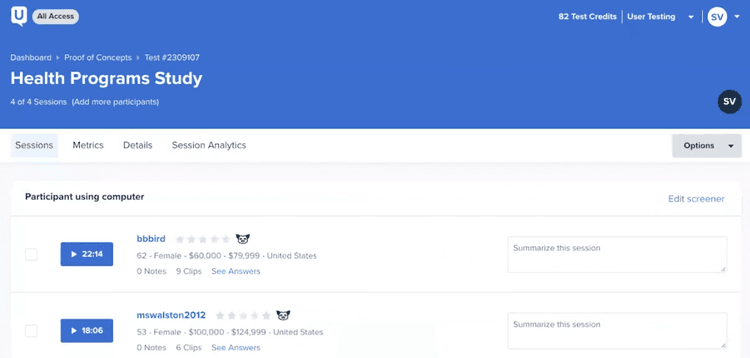
What it is: UserTesting is a usability testing platform that recruits people to test your website.
What you can track: measure qualitative user experience by watching test participants use your app, product, or website and answer questions.
Price: on request.
Use Hotjar Engage to run user tests

Interview users as they navigate your site in real time
Hotjar Engage is a user interview platform that lets you recruit and schedule interviews with users from a pool of 175,000+ participants (or you can bring your own). Engage records and transcribes your calls, automatically.
Use Engage to run user interviews and moderated usability tests to gauge the functionality of your site or product and get direct user feedback.
Website performance tracking tools
Once you’re tracking website traffic and user behavior, the only thing left is to measure how your website is performing in relation to your business goals.
Tracking website performance is about measuring the metrics that matter most to your business. For an SEO team, that might be website speed or keyword rankings; for a product team, it’s likely customer churn or retention.
Whatever metrics matter to your business, there’s a tool to track them.
What performance metrics can you track?
Churn
Retention
Page speed
Keyword rankings
Ecommerce sales
Backlinks
Social media shares
6 website and product performance tracking tools
1. Mixpanel
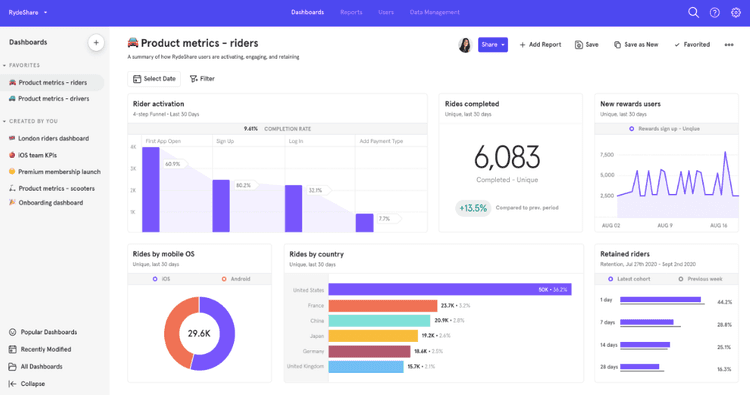
What it is: Mixpanel is a product analytics tool that tracks performance on mobile and web applications.
What you can track: product metrics like activation, retention, and churn.
Price: free for up to 100k monthly users.
💡Connect the what to the why with the Hotjar and Mixpanel integration: filter recordings, heatmaps, trends, funnels, and dashboard data by specific Mixpanel events—or trigger surveys when they happen.
Get a more detailed understanding of user behavior with combined insights that show you what’s happening behind the numbers by bringing Mixpanel events into Hotjar and using them as filters.
2. Google Search Console
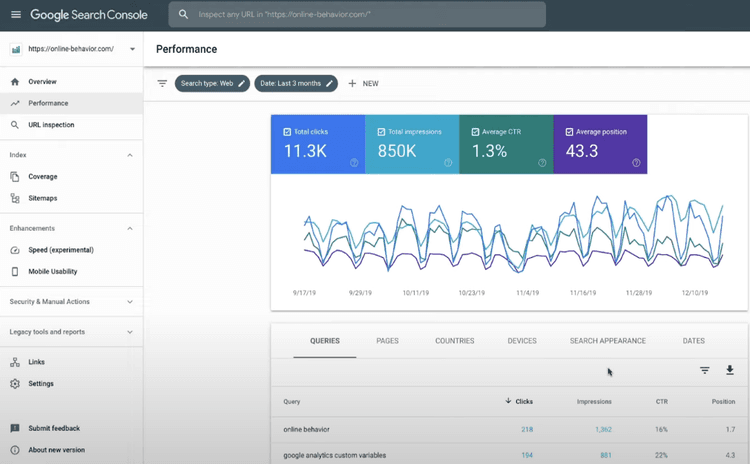
What it is: Search Console is a free search optimization tool from Google.
What you can track: measure SEO performance, view keyword impressions and clicks, see your backlinks, and check for crawling and speed errors.
Price: free.
3. ChartMogul
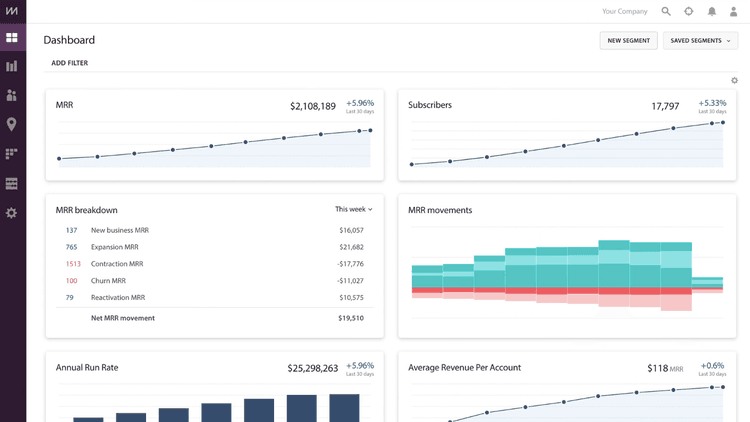
What it is: ChartMogul is subscription and revenue tracking software designed for SaaS companies.
What you can track: MRR, ARR, CLV, churn, revenue, sales, and subscriber numbers.
Price: from free for up to $10k MRR.
4. Ahrefs
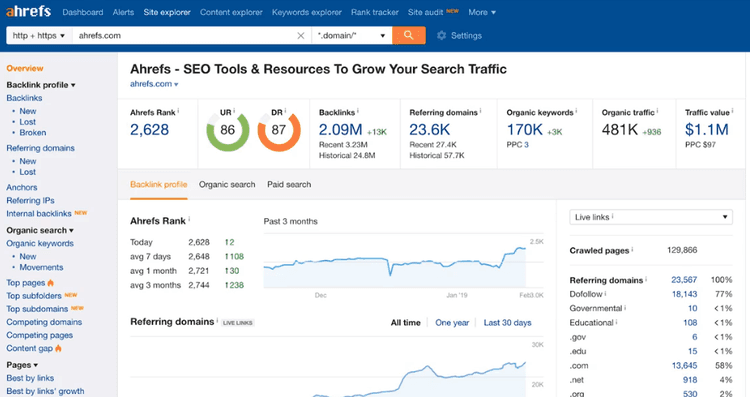
What it is: Ahrefs is a suite of SEO tools to monitor and grow website traffic from search engines. (We're big fans of Ahrefs, ourselves!)
What you can track: keyword rankings, backlinks, website speed, and broken links for your own and competitor websites.
Price: from $99/month.
5. Kissmetrics
What it is: Kissmetrics is product and marketing analytics software for SaaS and ecommerce websites.
What you can track: product metrics like sign-ups, churn, and MRR; ecommerce metrics like sales, revenue, and cart-to-purchase conversion rate.
Price: from $299/month.
6. Salesforce Marketing Cloud
What it is: Salesforce Marketing Cloud is an enterprise-level CRM (customer relationship management) analytics platform for marketers with several add-on tools, including Customer 360 Audiences, Loyalty Management, Social Studio, and Advertising Studio.
What you can track: email and ad campaign performance, key customer journey touchpoints, and website engagement.
Price: on request.
💭 Understand your users with Hotjar
Use Hotjar to safely track user behavior and understand how people experience and interact with your website or app.