Learn / Guides / Website tracking guide
How to compare website traffic and benchmark against your competitors
Tracking user activity on your site helps you measure growth and evaluate marketing performance over time—but website tracking isn't limited to the sites you own.
In this chapter, we show you how to use premium and free tools to compare traffic between websites. This helps you analyze competitor website traffic so you can benchmark against them, enhance your SEO strategies, and identify areas for improvement.
Summary
When you’re comparing site traffic with your competitors, there’s a lot of information you need to take into consideration. Your path to a more efficient website traffic comparison starts here. 👇
The benefits of tracking and comparing website traffic: the advantages of competitor website traffic analysis include tracking performance, discovering new opportunities, and setting realistic benchmarks for your business
5 tools to compare competitors’ traffic: tools like Google Analytics, Similarweb, Ahrefs, and more help you gather and leverage competitor website traffic insights to inform your own marketing strategies, content development, and product offerings
4 ways to get more from your existing website traffic: to get more value from the traffic you’ve already acquired, draw insights straight from the user experience (UX). Collect user feedback, analyze user interactions, create your own benchmarks, and optimize your customer journey.
What is website traffic?
Website traffic is a measurement of the number of visitors to any web page. You can record and monitor your traffic using a website tracking tool, like Google Analytics or Adobe Analytics, which tracks visitors using a JavaScript snippet.
These tools let you track sources for your own website and check competitor website traffic. To gain valuable insights into your competitors' online performance, focus on major traffic sources—like search engine, direct, referral, email, PPC—and key metrics, including:
Total traffic
Pageviews
Average session duration
Audience demographics
The benefits of tracking and comparing website traffic
Keeping a close eye on the competition in your website analytics tools helps you make better decisions for your users. By measuring your own and competitors’ web traffic, you can also
Track your website's growth over time
Measure seasonal popularity and peaks
Compare your website performance to previous years
Benchmark your performance against competitors
Comparing website traffic against a key competitor also helps you identify potential areas of growth. For example, if you see a competitor driving significantly more traffic from search engines, it might be a good strategy for you to invest more in search engine optimization (SEO) as a digital marketing channel, which also helps you improve your SERPs.

Why traffic can be a vanity metric
Unless you’re a publisher that earns revenue from ad impressions, focusing on traffic alone won’t add value to your business. A million extra visitors who don’t convert into leads or customers are less valuable to your business than an extra hundred who do. Look at traffic alongside other key engagement metrics like conversion rate to understand how your website is really performing, by using a web traffic analytics tool that also provides insights into user behavior.
Competitor website traffic analysis: 5 tools to track competitor traffic
Since you can’t just log in to your competitors’ analytics accounts, you’ll have to rely on the next best thing: big data estimates.
Here are five free and premium tools that make comparing website traffic simple.
1. Google Analytics 4
Google Analytics 4 (GA4) is filled with data and reports that give you and your team valuable insights to understand how your site is performing. But when it comes to competitor research, benchmarking reports are not available (yet).
For now, here’s what we know about benchmarking in GA4:
You can collect data for benchmarking, but can’t access specific reports for competitor research
Giving GA permission to use your data also means you’ll be able to access predictive metrics
Google Analytics won’t give you data on specific competitors, and the number of web properties data is aggregated from depends on how many websites in your niche opted into anonymous tracking
The resulting benchmarking data sets are bound to be broad, but good enough to get some general information about industry segments
As soon as these benchmarking reports become available, be prepared to dive into the data and see how you measure up. Here’s how to get ready.
First, some housekeeping: by default, GA4 only shows Explorations data from the last two months. You can extend this range to 14 months by going to the Admin panel of your property and then clicking on Data Retention.

Remember that this range only applies to custom reports, a.k.a. Explorations. Standard reports in GA4 (found under the Reports section) are not affected.
Next, you need to give Google Analytics 4 permission to collect data for benchmarking. To do this, log in as an Administrator or Editor, then head over to Admin → Account settings → Account → Account details. Once there, make sure the ‘Modeling contributions & business insights’ checkbox is ticked. Click ‘Save’ to start collecting data anonymously.

With these two settings activated, you’ll be able to access industry benchmark reports (once they become available) and compare your site's performance with those of other websites in your industry.
Pro tip: get more from your GA data by combining it with insights from Hotjar, part of the Contentsquare group.
Pairing Google Analytics with a digital experience insights tool like Hotjar lets you add context to your data. You can see both what visitors are doing on your website and how they’re doing it.
For example, GA4 tells you which pages have a high bounce rate or exit rate, but the Hotjar Recordings tool shows you exactly what users do just before leaving. Similarly, placing heatmaps on your top-converting pages shows you which calls to action (CTAs) drive clicks.
Here are five ways to use Google Analytics and Hotjar to grow your business.

An example Hotjar session recording showing user behavior during a session
2. Similarweb
Similarweb is a website analysis tool (with an optional Chrome extension) for comparing web traffic on sites you don’t have access to. Enter one or more websites and the free version lets you see a comparison of
Total monthly traffic
Average visit duration
Pages per visit
Bounce rate
Traffic percentage by country
Traffic sources
If you sign up and pay, you get access to more data, including category performance benchmarks and the average bounce rate in your niche or industry. Unfortunately, there’s limited data on smaller websites, so Similarweb is only good for comparing traffic between medium to large sites.
3. Ahrefs
Ahrefs is a premium SEO and keyword research tool you can use to compare organic search traffic volumes. Enter any domain, subdomain, or URL to see an estimate of
Monthly organic traffic
Traffic value (organic + PPC)
Traffic by country
Keyword rankings
Organic keywords
Referring domains
Backlinks
SEO tools also let you view traffic estimates for the top-ranking results for any keyword, which helps you estimate the traffic to expect for similarly targeted pages on your own site.
Ahrefs is a premium tool, and competitor data can only be viewed with a paid subscription. Since it only covers organic search engine traffic, you’ll need a different tool to compare traffic from other sources. Enter: Serpstat.
4. Serpstat
Serpstat is an all-in-one SEO platform designed to help you analyze not only your own website but also your competitors’ sites. Insights include traffic, visibility, number of backlinks, and other SEO metrics useful for competitor analysis.
Serpstat gives you access to traffic insights on your competitors, such as
Organic and PPC keywords
Domain visibility
Traffic share
Top pages
Backlinks
Meta tags
You can use their Rank Tracker tool to add competitor domains and evaluate the traffic share for your target keywords. This helps you understand how your site and sites belonging to competitors are performing in paid and organic search.
5. Semrush
Semrush is a premium marketing tool, but a free account allows you to generate 10 traffic analytics reports.
Enter any domain or compare up to five websites and you’ll get an estimate for
Visits
Unique visitors
Average visit duration
Bounce rate
Semrush uses clickstream data to estimate traffic metrics for all websites. For traffic comparisons, you’ll see an estimated accuracy score (high, medium, or low). Semrush’s free data is very limited, and you’ll need to pay if you want to access more than the metrics we mention above.
4 ways to get more from your website traffic
Comparing website traffic will never be 100% accurate since you’re looking at estimates, not real analytics data. For example, the average estimated bounce rate for Hotjar.com was wildly different depending on the tool we used.
Even your own traffic data will never tell you how people are experiencing your website. Are they getting stuck? Does your messaging resonate? Do they trust you enough to become paying customers? You can get more business value by answering these questions instead of just focusing on increasing traffic.
Instead of just passively monitoring traffic stats and hoping that more visitors will lead to more conversions (spoiler: it won’t), here are four methods you can use right now to get value from the traffic you already have.
1. Ask your users for feedback
While traffic analytics tells you what’s happening on your website, user feedback tells you why. Find out what's important to users, and use this insight to boost conversions, improve the customer experience, and reduce drop-offs.
You can collect feedback from both website visitors and product users logged in to your platform. For example, the Hotjar Feedback tool lets users tag any page element with a love-to-hate reaction and add their comments.

2. See how people interact with individual pages
Aside from being boring to look at, traffic data only shows you your most and least popular pages. But, you can see exactly what happens on those pages with two key digital experience insight tools: session recordings and heatmaps.
Session recordings reconstruct individual user journeys across every page they visit so you can observe how they navigate, what they click on or ignore as they browse, and whether they encounter any issues along the way
Heatmaps give you a visual overview of how people interact with an individual web page by displaying 'hot' and 'cold' spots, helping you spot trends and optimization opportunities to drive more engagement
What you need to know about Hotjar Heatmaps, in 60 seconds
Despite all the tools we used to measure traffic, such as Google Analytics, we didn’t really know what our users were doing on our website or how they were using our online tool. Our goal was to start optimizing based on data, not assumptions.
3. Create your own benchmarks
Instead of comparing website traffic against competitors, you can learn more about how your business is performing by creating your own benchmarks.
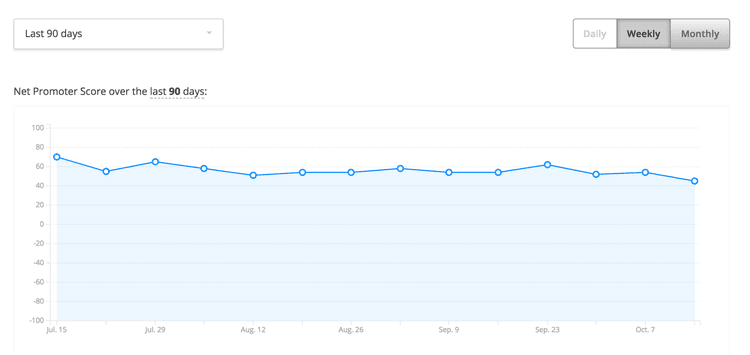
In addition to website traffic, you can benchmark user sentiment with surveys like
Net Promoter Score® (NPS®): measure how likely customers and users are to recommend you to others on a scale from 0 to 10
Customer Satisfaction Score (CSAT): measure your customers’ overall satisfaction with a specific aspect of your business
Customer Effort Score (CES): identify how much effort a customer had to exert to use your product or service, find the information they needed, or get an issue resolved
4. Optimize the customer journey
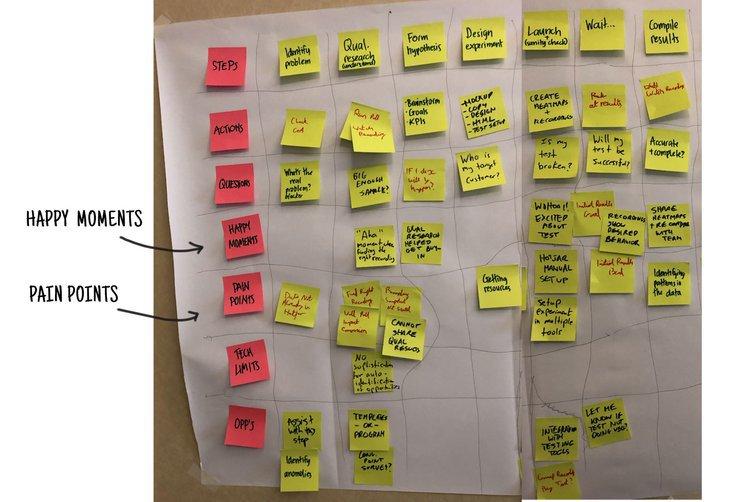
Customer journey maps (CJMs) give you a visual overview of how people interact with your website, product, or business, showing the positive and negative interactions that lead to a sign-up or purchase.
Even a basic CJM (like our sticky note map below) puts you in different users’ shoes so you can empathize with their pain points and happy moments and optimize for more joy and less frustration across the experience.
Create an effective customer journey map in just a couple of days by combining traffic analytics data with insights from the heatmaps, session recordings, and surveys we covered above.
Next steps to competitor website traffic analysis
Comparing your website to that of your competitors is a great starting point for boosting traffic. But this shouldn't complete your analysis. You need to dig deeper, add context, and bring in other reports to find real meaning in these metrics.
By tracking user behavior and understanding how people experience and interact with your website, you can provide the best experience for your customers—and the best conversion rates for your business.
Put your benchmarking data into context with Hotjar
Heatmaps, Recordings, Feedback, Surveys, and Interviews give you everything you need to understand your users—and all five tools are available in the Hotjar suite for free.
