Learn / Guides / Heatmaps guide
How to use Engagement Zones to improve your website and boost conversions with confidence
Multiple types of heatmaps—like click, move, and scroll heatmaps—have proven vital in visualizing complex interaction data. But when you’ve spent several minutes, even hours, toggling between them to glean on-page engagement insights, haven’t you wished to the analytics gods that there was a more efficient way to do your job?
We’re no deities, but we heard you. Hotjar’s alternative to this imperfect science isn’t a magic button, but another type of heatmap. Everybody, say hi to Engagement Zones. 👋

The Engagement Zones map in Hotjar Heatmaps combines all available interaction data—clicks, move, and scroll for desktop; taps and scroll for mobile and tablet. Then, in the form of a color-coded grid, it reveals the areas with moderate to high levels of engagement from visitors.
This heatmap type is for those who need a simple yet well-rounded view of user engagement. Analyze your pages in seconds, confidently share insights with your peers and bosses, and quickly answer critical questions about the parts of a page users engage with the most.
Keep reading to learn how this brand-new heatmap type helps you understand on-page user engagement, uncover areas affecting conversion, and use data to determine which site improvements to pursue.
Visualize interaction data in seconds
Hotjar introduces Engagement Zones, a quicker and smarter way to see which parts of your site are hot or not. Instantly analyze your pages or content and apply the insights to your user experience.

How Engagement Zones heatmaps enhance your site’s layout, content, and usability
Let’s zoom in on how Engagement Zones works and what benefits come with this comprehensive heatmap. Here are the top three things Engagement Zones maps help you accomplish.
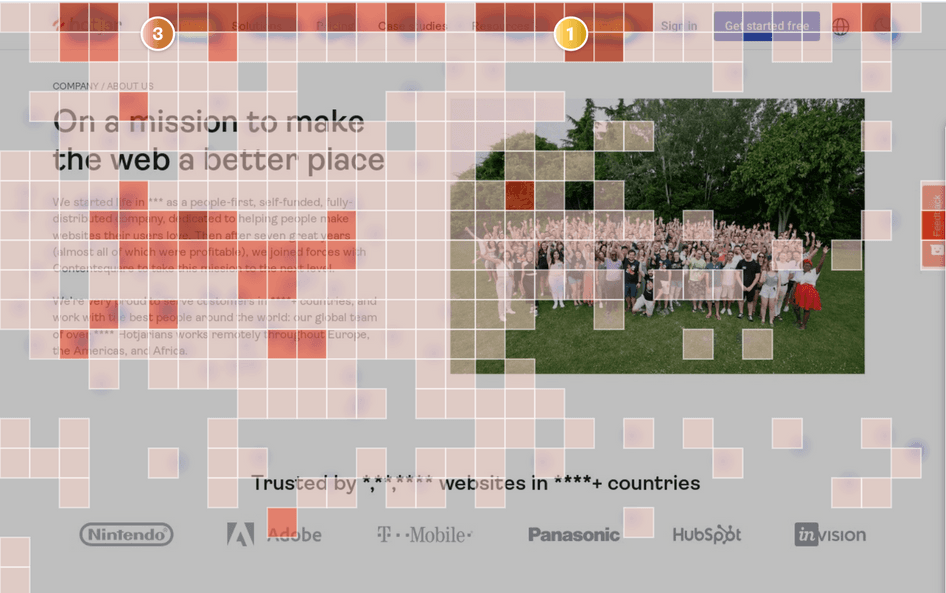
1. See the most engaging parts of your site
As the name suggests, Engagement Zones divides a page into ‘zones’ and applies the following scoring system*:
Moderate - level 1 (light red): interactions with this area tend to be sporadic or include only simple tasks
High - level 2 (red): engagement with this area is recurring, indicating that users may find useful information within it
Very high - level 3 (dark red): interactions with this area are substantial, demonstrating that users derive the most value from it
The beauty of seeing areas of low and high engagement is that it eliminates the back-and-forth between different types of heatmaps. You don’t have to check click maps to know the concentration of clicks on each element and then switch to scroll maps to learn the percentage of users that have scrolled down to each part of the page. Instead, you see all three insights you’d normally get from three separate traditional heatmaps in one viewing.
For example, if you’re a designer in an ecommerce company, it’s easier to tweak your site’s layout when you identify the most engaged zones of your homepage. Surface high-value elements earlier, such as a call-to-action (CTA) button that users click halfway through the page. Confidently redesign the page based on the actionable insights Engagement Zones heatmaps provide.
* Engagement is calculated based on a combination of available interaction data.
2. Identify engagement patterns on any page
Whether you have dozens or hundreds of pages to analyze, Engagement Zones heatmaps enable you to spot your users’ behavior patterns. Specifically, you can study these patterns to improve your site’s ease of use.
Suppose you’re a product manager of a mid-market SaaS company who wants to evaluate your settings screen’s usability. You notice that users often interact with the items at the top and a couple more buried at the bottom of the page. This could mean you need to reorder the bottom menu items or completely remove unnecessary ones.
In this case, you should also tap into the rest of our behavior analytics tools and features—such as Recordings, Surveys, and Feedback—to fully understand the reason behind your users’ behavior. (We’ll talk more about this later.)
💡 Pro tip: once you’re happy with your findings, share a highlight of the relevant Engagement Zones heatmaps and recordings with your team when you brainstorm and plan for your next design iteration.
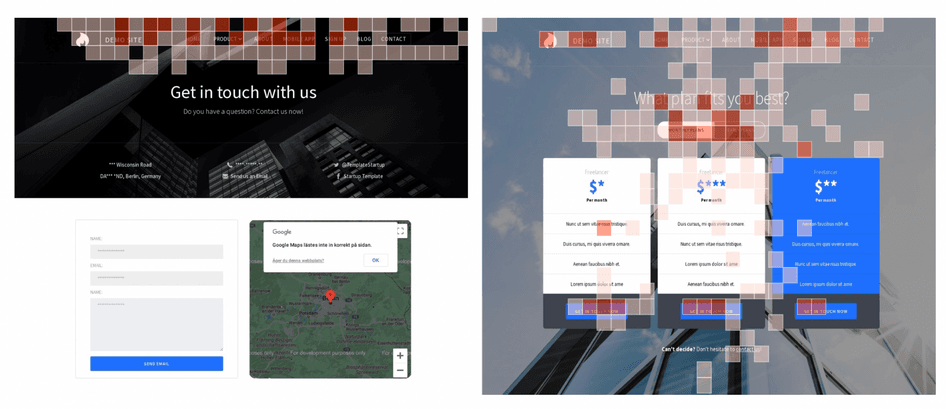
Sample Engagement Zones maps of a page, pre- and post-iteration
3. Find vital interaction data in a single view
As we mentioned, other heatmaps show where users click, move, or scroll. An Engagement Zones heatmap is special because it summarizes all interaction data in a single graphic representation, painting the big picture while emphasizing essential details.
Consider a marketer looking into user engagement with key pages to inform their optimization efforts: the heatmap would let them see the most and least engaging parts of each content piece, whether a blog, guide, or landing page.
"The best example I can think of is if you have a page with copy or a CTA—you can use Engagement Zones maps to see how much action your CTA is receiving," says Karissa Van Baulen, Customer Education Lead at Hotjar. "Rather than going to all three heatmaps, you can see right in front of you how many people are seeing the CTA without scrolling, if they are clicking on it, and if it is driving conversions."
Van Baulen adds that if the metrics aren’t showing much of an impact, then it’s back to the drawing board. Incorporate the insights into the changes you’ll make to the CTA.
Engagement Zones: a more intelligent way to explore heatmaps
Imagine you’re a project manager evaluating your digital product’s screens or a marketer doing content optimization. Without Engagement Zones heatmaps, you’d have to switch between three data points:
Click/tap maps (desktop/mobile and tablet): display where users click on your page
Move maps (desktop): show where users have moved their mouse on the screen
Scroll maps: indicate how many among total users have scrolled down to each part of a page
Now that you have Engagement Zones heatmaps combining all available interaction data, you only deal with one data point. And the best part? You can use this heatmap data (together with Recordings, which we’ll explain very soon) to start validating assumptions based on Google Analytics metrics and other quantitative data.
How to use Engagement Zones maps in Hotjar
You must be an Observe Scale or Business user to be able to use Engagement Zones maps. Go to Heatmaps and select a saved heatmap to start. In the side panel, scroll to ‘Map types’ and toggle ‘Engagement zones’ on.
A grid map will appear to show the zones of your page with moderate, high, and very high engagement. From here, you can easily tell which areas have the most and least engagement.
Continue gathering insights with Recordings
With Hotjar, a set of relevant recordings is available for each of your saved heatmaps. You can replay these sessions, made up of an individual user's visits across multiple pages, to understand what customer journeys look like, what someone did on a page, and why they clicked on a page element.
To watch a session recording, click 'View recordings' at the top of your heatmap.
Add filters to narrow down your recordings list. For instance, select 'Clicked element' as your behavior filter and fill out the rest of the parameters to display only recordings of users clicking a certain button or text link.
Sample session recordings
Pick a recording to start watching.
Watch the recordings of users who clicked on the sign-up button
Save and share your insights using Highlights
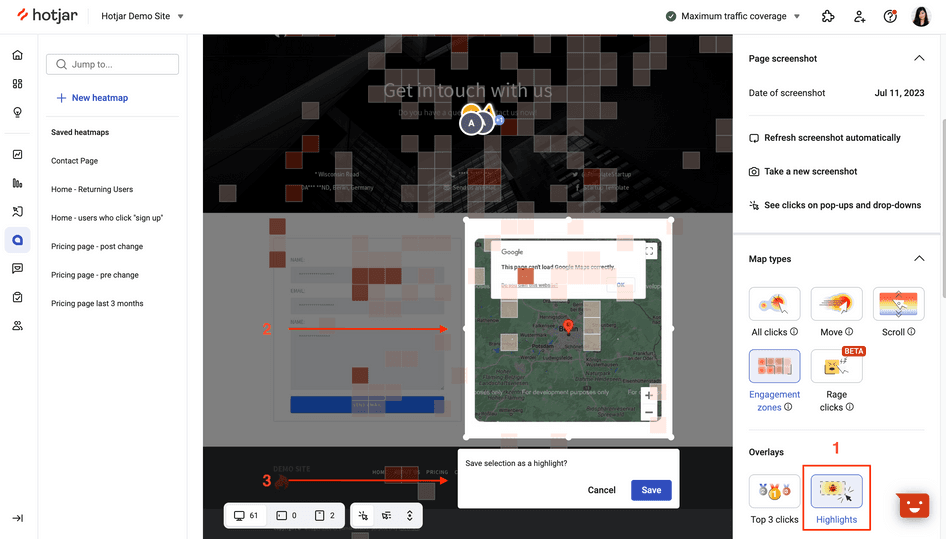
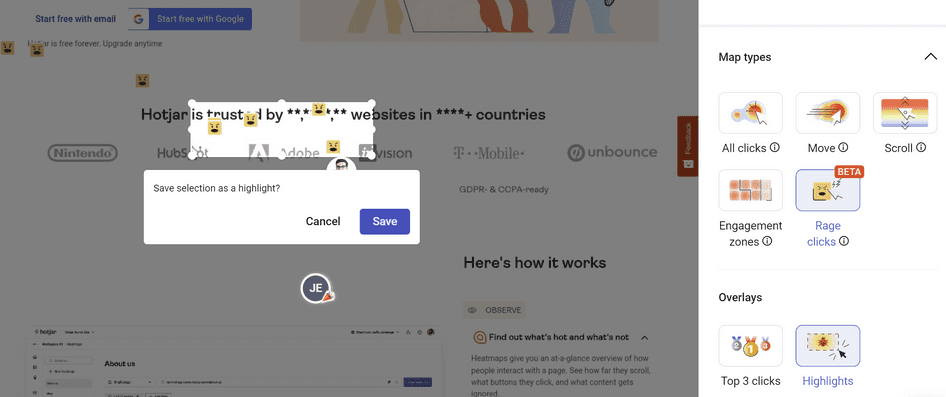
You can highlight any part of your Engagement Zones heatmap (or any heatmap, for that matter, such as your click, move, and scroll map).
In the Heatmaps side panel, toggle 'Highlights' on—this will show you existing highlights and enable you to create a new one. Select a part of the heatmap you believe is vital to capture and hit 'Save'.

From there, you can add your highlight to a collection and label it accordingly so you can find and share it more easily.
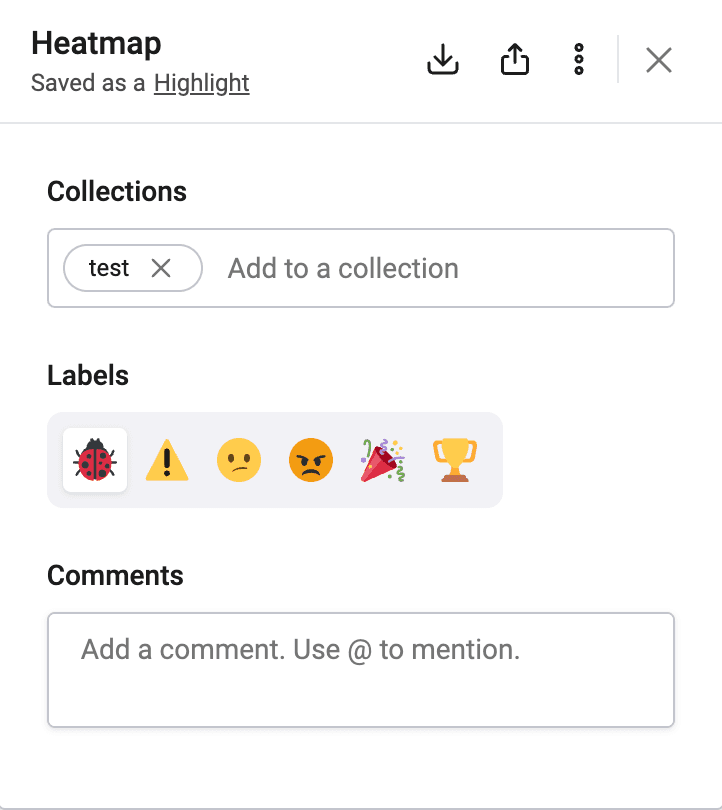
Make it easier for you to find your highlights by labeling and adding them to a collection
Ensure it’s a positive interaction, not a rage click
Suppose your Engagement Zones map shows high user engagement for the sign-up button, but actual sign-ups remain incredibly low. You might want to double-check if users aren't rage clicking on said button.
Toggle 'Rage clicks' on to display the Rage Click map. This new heatmap type shows repeated clicks on an element or within the same area, a sign of frustration. Rage clicks can negatively affect conversion rates and the user experience. They can also occur when simple tasks require users to click multiple times, such as selecting a date or using a carousel.
Get in the zone before making design and content decisions
By combining different interaction data into one comprehensive heatmap, Engagement Zones provides a simple yet powerful way to understand user engagement on your site. With just one click, you can quickly identify which page parts and elements are getting love from your users—and which could be working harder for you.
Take on this smarter, more efficient approach to gathering actionable insights from Hotjar Heatmaps. Dive into the zone to uncover valuable user behavior patterns that inform your website improvement decisions starting today.
Visualize interaction data in seconds
Hotjar introduces Engagement Zones, a quicker and smarter way to see which parts of your site are hot or not. Instantly analyze your pages or content and apply the insights to your user experience.