Learn / Blog / Article
7 best Mixpanel alternatives to understand your users
Mixpanel is an analytics platform that excels in collecting quantitative user data. But sometimes, product managers, marketers, and website owners need more—the 'why' behind the 'what’. The good news is there are plenty of Mixpanel alternatives that combine quantitative analytics with powerful qualitative insights.


In this guide, we talk you through some of the most popular Mixpanel alternatives and complementary tools that go beyond the numbers. These tools help you understand why users act the way they do so you can create outstanding experiences and drive business growth.
1. Hotjar
Hotjar (that’s us 👋) is a behavior analytics platform that gives you a comprehensive understanding of how users interact with your website.
Hotjar goes deeper than statistics, helping you understand the motivations and feelings of your users to create a better, more engaging experience.
Hotjar’s key tools and features
Surveys: collect user feedback straight from the source. Place surveys strategically on your site or send them via email to capture crucial quantitative and qualitative data about your users’ satisfaction, their needs, and roadblocks.
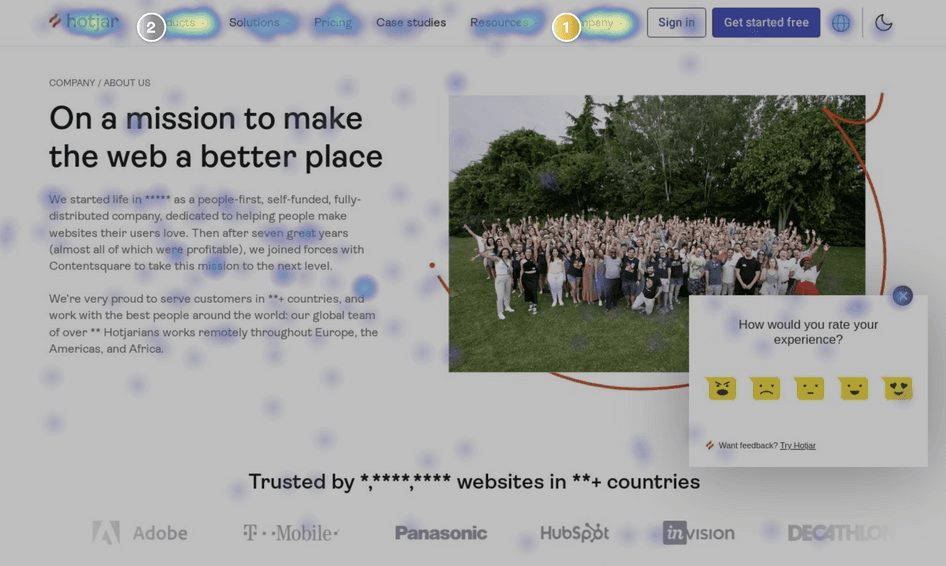
Heatmaps: visualize where users click, scroll, and interact on your pages to identify popular areas, underutilized elements, and points of user frustration, so you can make positive changes
Recordings: see firsthand the obstacles, confusion, or delight users encounter. By showing you how users behave, session recordings give you a unique opportunity to understand your audience and fine-tune your site accordingly.
Funnels: get a clear and concise view of your users' journey through your website or web app. Set up funnels to understand where users drop off—like during the checkout process or while signing up—helping you pinpoint areas of friction or confusion, so you can shape your product roadmap, eliminate bottlenecks, and optimize user flows.
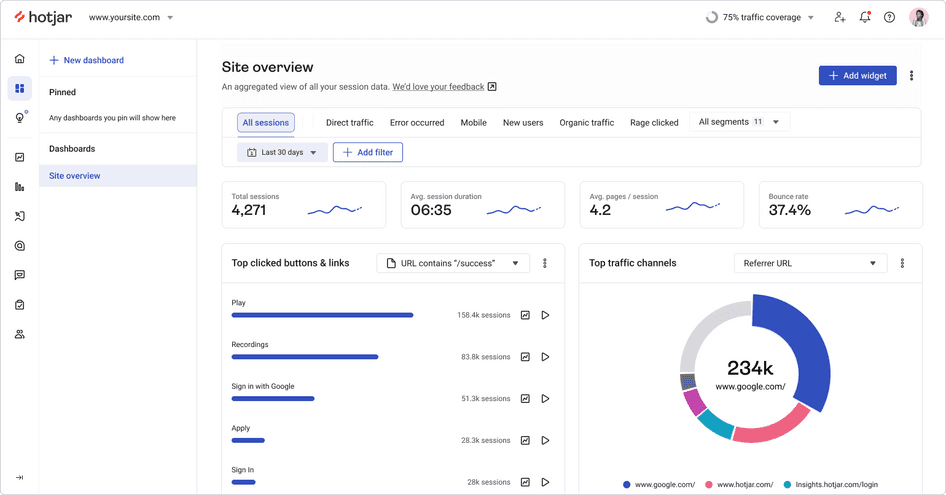
Dashboards: find all your metrics, like bounce rate and top pages, as well as heatmap, recording, survey, and site performance data in user-friendly visual dashboards. They're designed for accessibility, allowing you to easily explore, understand, and share insights about user behavior and site performance with your team.
Trends: visualize your custom metrics and KPIs to spot user behavior patterns over time. Directly link these patterns to relevant recordings and heatmaps for deeper insights and easily compare across different user segments and times.
Engage: recruit participants, and schedule and conduct interviews to see what your ideal customers really think about your product (while spending less time on tedious admin)
How Hotjar compares to Mixpanel
Mixpanel's strength lies in its ability to provide detailed quantitative data about user interactions on your site. It's great at revealing what users do, offering granular data points like the number of users who clicked a particular button, how many times a page was visited, or the conversion rates of a particular funnel.
Hotjar shines in its ability to offer quantitative and qualitative insights into user behavior. Our tools give you a visual understanding of user interactions on your website, allowing you to see exactly where users are clicking and scrolling, so you can understand why they abandon your pages. This adds a layer of qualitative data to your analysis, allowing you to delve into the specifics of user behavior and see patterns that might not be obvious from numbers alone.
💡 Pro tip: you don't need to choose between Hotjar and Mixpanel. With the Hotjar-Mixpanel integration, you not only identify what's happening on your website (e.g. users frequently add certain items to their cart), but you'll also understand why it's happening (e.g. Hotjar's heatmaps and recordings show users are attracted to a particular promotional banner).
Remember, understanding user behavior isn't just about gathering data, but about making sense of it. The key is to balance quantitative and qualitative analysis, so you get a richer, more holistic view of your users' experience and make data-informed decisions that truly resonate with your audience.
Unlock the story behind your data with Hotjar
Don't just measure clicks—understand them. Hotjar’s analytics and feedback tools reveal the user behavior behind the numbers.

2. Amplitude
Amplitude’s real-time analytics helps teams deeply understand user behavior, build engaging products, and promote growth.
A standout feature is its flexible dashboard, customizable to the metrics and events you care about most. It also offers powerful segmentation tools, allowing you to dissect your user base into cohorts for a more targeted analysis.

Amplitude enables you to create multiple custom dashboards in one platform
Amplitude’s key tools and features
Automated insights: uncover customer insights with automated reports and industry templates to effectively surface metrics and gain a quick understanding of your customers’ behavior and preferences
Event recommendations: accelerate your set-up process with automated event recommendations that flatten the learning curve and tailor behavioral insights to your specific industry
Anomaly detection: with this monitoring feature, spot potential issues and trends, pinpoint deviations from expected values, and investigate their root causes. You can even set up alerts to notify you and your team of emerging issues before they impact the business.
A/B testing: experiment, iterate, and improve user experiences by leveraging product insights to build and analyze experiments, all in one place. This feature helps you refine product features faster and remove the guesswork.
How Amplitude compares to Mixpanel
Mixpanel provides detailed funnel analysis and in-depth retention reports that help you track events and understand long-term user engagement.
Amplitude, on the other hand, is strong in real-time quantitative analysis. It uses customizable dashboards for detailed cohort studies. Moreover, it excels in tracking user activities across various devices—desktops, smartphones, tablets—giving a more complete view of user behavior. Mixpanel also tracks across devices, but keeps separate timelines for each, making the user journey a bit trickier to piece together.
So if your focus is event-driven insights and user retention, go for Mixpanel. But if you need real-time data and a comprehensive cross-device user view, Amplitude is a strong alternative.
3. Segment
Segment is an all-encompassing tool, acting as a hub that allows you to collect, manage, and activate data.
Segment uses one comprehensive Software Development Kit (SDK) to gather and distribute data, effectively replacing the need for numerous individual SDKs. It not only prioritizes data collection but also data quality, ensuring that the data in the system adheres to high standards.

Segment seamlessly unifies customer data across multiple sources
Segment’s key tools and features
Real-time interaction tracking: get a comprehensive view of customer behavior as it evolves in real time across various platforms and channels, including web and mobile, to enhance your understanding of the customer journey
Customer history: consolidate all user profiles in one place and see each customer's journey across multiple sessions and devices
Profile API for personalization: build in-app recommendations, provide customer context for your sales and support teams, and create personalized marketing campaigns
How Segment compares to Mixpanel
Mixpanel offers in-depth quantitative analysis of user behavior through features like A/B testing, cohort analysis, and user segmentation. It excels in visualizing and offering insights into user interactions on your site or app.
On the other hand, Segment serves as a unified data hub, focusing on the collection, management, and routing of data across different destinations. Its main strength lies in aggregating data from various sources, providing a holistic view of user data.
This makes Segment particularly useful for companies with complex data ecosystems, or those who need a unified data platform for a consistent customer view across different departments. If you're more about strong data unification rather than detailed behavioral analysis, Segment might be a good tool alternative to Mixpanel.
💡 Pro tip: enhance your user understanding with Hotjar's Segment integration. There’s no need to develop complex APIs to connect all your channels—our integration ties together user interactions from support chats, email newsletters, and your website to give you a comprehensive view of user behavior.

The Hotjar-Segment integration lets you see session recordings of unhappy users who report a problem through chatbots
4. Kissmetrics
Kissmetrics is an analytics and engagement platform that helps businesses understand, engage, and retain their customers.
By capturing and connecting every interaction, Kissmetrics provides an end-to-end, panoramic view of the customer journey, enabling businesses to understand what drives users to convert, while helping them retain users and advocate for their products or services.

Kissmetrics’s personalized email campaigns set it apart from other analytics tools
Kissmetrics’s key tools and features
Behavior-based automation: send targeted emails and in-app messages based on customer behavior
Customer journey reports: gain insights into every step of your user’s journey, so you can see what drives customers to convert and engage with your products or services
Funnel reports: track how users move through your conversion funnel, identifying drop-off points and areas for improvement
Retention reports: understand what makes customers come back to your product or website
How Kissmetrics compares to Mixpanel
Kissmetrics and Mixpanel are analytics solutions that help you track user behavior and understand customer journeys. Mixpanel has a slightly more technical focus, often preferred by product teams, and is particularly strong in event tracking and real-time analysis.
Kissmetrics is more marketing-oriented, emphasizing customer journey tracking and engagement. Its strength lies in its ability to seamlessly integrate customer data into marketing strategies. Its automated email campaigns, in particular, set it apart from Mixpanel.
While both tools offer features for analyzing user behavior and engagement, your choice between Kissmetrics and Mixpanel might come down to whether your primary need is for product-focused, real-time analysis or marketing-driven, customer engagement strategies.
⚡Get more out of your data with the Hotjar and Kissmetrics integration:
Filter recordings and heatmap data by Kissmetrics IDs to see how customers interact with your site or product
Target surveys and feedback widgets using Kissmetrics IDs so they display to specific customers
By combining the detailed user behavior data and customer segmentation in Kissmetrics with visual insights and user feedback through Hotjar, you’ll get a more comprehensive understanding of what customers do—and why.
5. Heap
Heap is an analytics tool that automates the collection of every user interaction across your digital touchpoints, taking the guesswork out of deciding what data to track and allowing you to spend more time gleaning insights and taking action.
Heap's user-friendly interface makes it easy to measure impact, understand user behavior, and ultimately make optimizations to improve the customer experience.

Heap provides a wealth of auto-captured events and properties to help you quickly get started with analysis
Heap’s key tools and features
Autocapture: Heap automatically collects all user interactions, including clicks, form submissions, and pageviews, without the need to manually code each event
Event visualizer: create and track events directly from your website or app to easily monitor specific user interactions
Segmentation and funnels: build complex user segments and funnels, so you can dig deep into user paths and behavior over time
Data governance: ensure data consistency and accuracy by automatically resolving identity conflicts and cleaning up data duplicates
How Heap compares to Mixpanel
Heap and Mixpanel have different approaches to data collection. Heap uses an auto-capture feature, which automatically collects all user interaction data from the beginning. This means that even if you didn't initially decide to track a specific event, you can still analyze it retroactively.
On the other hand, Mixpanel requires you to manually define the events you want to track from the start. While this might take some extra time, it provides more detailed reports right off the bat, which makes the analysis straightforward. The choice between Heap and Mixpanel depends on whether you prioritize comprehensive data capturing (Heap) or a more detailed analysis (Mixpanel).
6. Qualaroo
Qualaroo is a user feedback platform focused on providing context and insights into user actions. It allows you to engage with users on your website or app in real time, asking relevant questions to collect their opinions, preferences, and experiences.

Qualaroo’s targeted surveys help you get a complete picture of your user behavior
Qualaroo’s key tools and features
Website and app surveys: collect valuable insights directly from your users while they're interacting with your website or app
Customer branding: build surveys using your brand colors and fonts to create a native feel with tailor-made design
Ten question types: choose from a range of questions including dropdowns and Net Promoter Score® questions along with free text options
How Qualaroo compares to Mixpanel
Mixpanel captures event-based data, diving deep into the what of user actions. Qualaroo, on the other hand, focuses on the why through its targeted surveys, adding a layer of customer sentiment to the mix.
When considering use cases, Mixpanel serves a broad spectrum of roles like product managers, data analysts, marketers, and developers, useful for activities ranging from tracking engagement to measuring the impact of changes.
Qualaroo, on the other hand, is especially beneficial for UX researchers, customer success teams, and marketers seeking to collect and understand user feedback.
7. Pendo
Pendo is a product adoption tool designed to drive customer success on web and mobile apps. It not only offers strong product analytics capabilities but also enables you to gather user feedback and execute in-app experiences aimed at boosting engagement and adoption.

In-app experiences like user onboarding and in-app support make Pendo a solid choice for product teams
Pendo’s key tools and features
Event tracking: monitor precise events within your product, like a user engaging with a call to action (CTA) button or transitioning to a specific page
User segmentation: categorize users based on different parameters, including their product usage, behavior data, visitor and account details, and data specific to mobile users
Funnel analysis: identify hurdles in the user journey by tracking people’s progression through a series of steps toward your defined objective
Retention analysis: see which customers continue to use your product regularly over a sustained period, so you can measure your product’s value and forecast future growth and revenue
How Pendo compares to Mixpanel
While both Pendo and Mixpanel offer analytics functionality, their primary purposes and use cases differ. Mixpanel enables you to conduct a granular analysis of user behavior, track users' progression through a funnel, and segment users based on their properties and events. However, it does not provide options for collecting user feedback or executing in-app experiences.
What sets Pendo apart is its ability to gather user feedback directly in your app and guide users with in-app experiences, making it a great tool for product managers and customer success teams aiming to enhance the user experience and boost product adoption.
In terms of user segmentation and funnel analysis, both platforms offer similar capabilities, but if you need to dig deeper into retention analysis, Mixpanel takes the cake. 🎂
Unify quantitative and qualitative insights to keep your users satisfied
Quantitative data serves as the backbone of your analytics, delivering vital statistics that reveal trends and map out user interactions on your product or website. Mixpanel is a champion in this field, offering robust capabilities that delve deep into the numbers and illuminate user behavior patterns.
While Mixpanel stands out with quantitative features, integrating or supplementing them with qualitative tools like heatmaps, recordings, and surveys broadens your user understanding. The end result? You tailor your product to your users' needs, create more happy customers, and accelerate business growth.
Go beyond quantitative data with Hotjar
Learn why users convert or click away with our suite of user analytics and feedback tools.
FAQs about Mixpanel alternatives
Related articles

Behavior analytics
How to use the Hotjar-AB Tasty integration: 3 powerful use cases
Figuring out exactly what your users need involves two things: getting to know them and some old-fashioned trial and error.
With the Hotjar-AB Tasty integration, we’ve got you covered on both counts. Hotjar helps you understand user behavior, and AB Tasty lets you create experiments and personalizations on your site. Learn how these tools work together to create a digital experience that’s enjoyable for your users and excellent for your conversions.

Behavior analytics
The best way to track scroll depth (it’s not Google Analytics 4)
Knowing which parts of a web page bore, engage, or persuade your website visitors can be a superpower for digital marketers, UX designers, product teams, and ecommerce managers.
Tracking scroll depth gives you this power, providing actionable insights to improve the user experience (UX) by revealing your site visitors’ scrolling behavior.

Ayush Sood

Behavior analytics
10 ways to improve your data analytics processes using Hotjar
As your team's data partner, you empower colleagues to make predictions and decisions by seeking out valuable insights into your users, products, or services. But who—or what—empowers you? What data analytics tools do you rely on to accomplish your day-to-day work?
If you still need to find your go-to solution, try Hotjar.

Shadz Loresco