Learn / Guides / Ecommerce guide
14 essential ecommerce metrics and KPIs you should track
Your online shop is open for business, and your marketing tactics are bringing a few buyers to your site. But how do you know exactly what’s working? And where do you need to improve?
With the right ecommerce metrics and key performance indicators (KPIs) on your radar, you can set the guesswork aside and focus on changes that will drive your business.

Tracking the right ecommerce metrics helps you understand user behavior, evaluate trends in buying patterns, make data-informed decisions, and maximize your return on investment (ROI).
In this chapter, we share some of the most critical ecommerce metrics and KPIs to track across three stages of the customer journey. Jump to the metrics you need:
Start tracking what matters with Hotjar
Hotjar's ecommerce experience insights give you the ‘why’ behind the ‘what’. It’s like ecommerce X-ray vision, so you can provide what your customers love.

Ecommerce analytics, metrics, and KPIs: what’s the difference?
Put simply, all KPIs are metrics, but not all metrics are KPIs. Ecommerce analytics includes metrics and KPIs, along with the understanding and interpretation of those numbers.
Acquisition metrics and KPIs
Acquisition metrics track who discovers your ecommerce store—including new and returning shoppers—and the routes they take to find you.
1. Ecommerce traffic: total, new, and returning users
Ecommerce sales start with getting people to your site. Ecommerce site traffic (referred to as ‘users’ In Google Analytics) covers three types of website visitors:
Total users: how many people visit your site in a given period of time in total
New users: first-time visitors to your website
Returning users: people who’ve visited your site before
How to find total, new, and returning users:
Track user counts in Google Analytics > Acquisition panel
Start by tracking traffic on a weekly basis. Daily traffic fluctuates widely, so avoid looking at traffic numbers every day to save yourself the headache.
What’s a good new vs. returning user rate?
More new users usually means your marketing efforts are working, while an increase in returning users indicates that previous customers liked what they found. You need both to grow a business.
The right mix of new versus returning users depends on context. For example, if you’re running a campaign retargeting previous customers, you should expect a jump in your returning visitor rate.
💡Pro tip: for deeper insights, dive into traffic spikes and dips with Hotjar Trends. It helps you understand the change in traffic patterns and user behavior that ultimately affect your ecommerce store’s conversion rates.
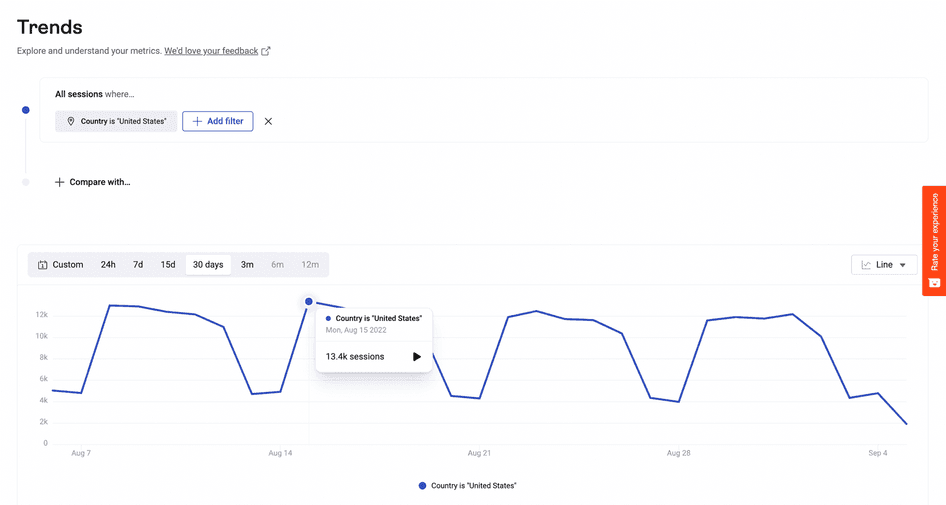
A pre-built chart in Hotjar Trends showing US audience sessions over a 30-day period
2. Traffic source
Traffic source reveals where your traffic is coming from, so you can improve your marketing and sales efforts. Default channel grouping includes organic search, paid search, referrals, direct, social, and other.
How to determine channel grouping and traffic source:
View top channels in Google Analytics > Acquisition panel
What’s a good traffic source distribution?
There’s no ‘right’ mix of channels, but your inputs should match your results. If you invest a lot in social media but get very little social traffic, you may want to redistribute your efforts.
You should also cross-check your traffic source with conversion rates (discussed below, under conversion metrics). If the bulk of your traffic comes from search engine optimization (SEO), but conversion rates are low, you’ll know to focus on optimizing landing page traffic.
3. Email opt-in rate
Email marketing remains one of the most effective ways to increase repeat business and boost sales. Even if people don’t buy from you on the first visit, having access to their email address lets you reach out in the future and stay top of mind.
How to calculate email opt-in rate:
Email opt-in = (Number of people who subscribe) / (Number of visitors to your site) x 100
What’s a good email sign-up rate?
According to Sumo’s analysis of over 3.2 billion sessions, the average email opt-in rate is 1.95%.
💡Pro tip: want to boost your email opt-in rate? Here are a few tricks.
Offer an incentive, like a discount on a future purchase
Provide something valuable for free, like a guide on a topic related to your ecommerce products
Analyze Hotjar heatmaps and session recordings to make sure your subscribe forms are easily visible to site visitors
Engagement metrics and KPIs
Engagement metrics reveal what people are doing once they arrive on your online store, so you can understand if you’re attracting the right audience, identify potential user experience (UX) issues, and optimize conversion paths.
4. Average session duration
Session duration is the amount of time a user spends on a website or app during a single visit. More time on site means more interest in what you have to offer.
How to calculate average session duration:
Session duration = Time user leaves the app or website - Time the app or website was launched
What’s a good ecommerce session duration?
The best benchmark for ecommerce session duration is the current amount of time people spend on your online store. And the best way to boost it is to improve your ecommerce customer experience.
5. Click-through rate (CTR)
Click-through rate is a conversion rate optimization (CRO) metric that measures the effectiveness of a call-to-action (CTA)—usually through an ad, button, or link click.
How to calculate click-through rate:
CTR = (Number of people who clicked / Number of people who saw the CTA) x 100
What’s a good CTR on an ecommerce store?
The average CTR for acquisition channels is usually between 1% and 4%, with email campaigns being higher than Google ads because people have explicitly opted in to your emails.
But what really matters are the CTRs on your ecommerce store’s key pages, and the steps you take to improve them using tools like Hotjar heatmaps and session recordings.
6. Bounce rate
Bounce rate is a website engagement metric that tracks the percentage of people who visit a page then leave without taking another action.
How to calculate bounce rate:
Bounce rate = (Number of people who leave a page without taking an action / Number of people who arrive on a page) x 100
What’s a good ecommerce store bounce rate?
A bounce rate less than 60% is generally considered good, but of course the lower, the better. A low bounce rate is especially important for pages discovered through paid advertising. If you’re paying for traffic, make sure your landing pages are optimized for conversion and user experience.
7. Scroll depth
Scroll depth monitors how far down a page a visitor scrolls, revealing the areas they find engaging, and where they lose interest.
How to calculate scroll depth:
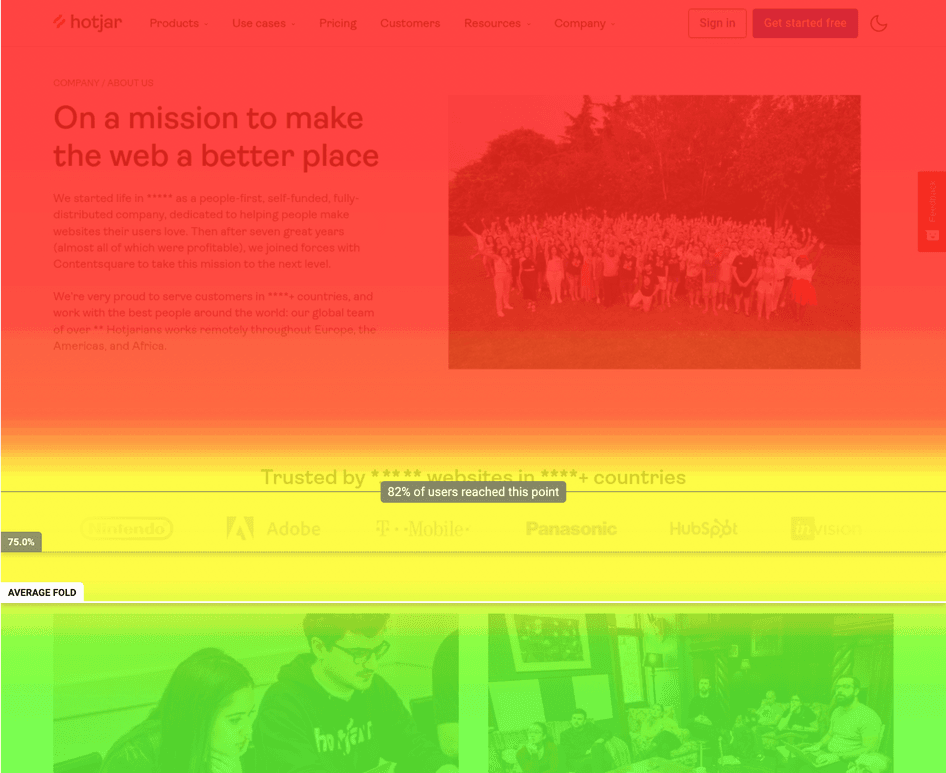
Use advanced insight tools like Hotjar Heatmaps for precise insights into where page visitors fall off, click, move, and scroll on your site. Analyze a scroll map to see your average fold and the percentage of users navigating to a certain point on your page.
What’s a good scroll depth for web pages?
To understand scroll depth, you have to understand a page’s purpose and content. If visitors only see the top part of a page because they click a CTA to a key landing page, that’s great. But if they only see the top part of a page because they quickly lose interest or have a poor user experience, you have work to do.
💡Pro tip: for deeper insights into scroll behavior, use a combination of heatmaps and session recordings (available on Hotjar’s Observe plan) to identify—and then fix—bugs, poor UX, and confusing content in the areas where people stop scrolling.

A Hotjar scroll map (left) and heatmap (right) used to improve ecommerce experience and conversions
Conversion and retention metrics and KPIs
Conversion and retention metrics help you monitor how well you’re attracting the right buyers to your ecommerce store, how much revenue your store is making, and how satisfied people are with their shopping experience.
8. Conversion rate (CVR)
Conversion rate is the percentage of site visitors who make a purchase. It shows you how well you’re attracting the right buyers, and can indicate bugs or other site performance issues.
For instance, a drop in conversion rate could flag a campaign targeting the wrong audience, or a UX issue in your checkout process.
How to calculate conversion rate:
CVR = (Number of people who purchase / Number of people who visited your website) x 100
What’s a good ecommerce store conversion rate?
According to Unbounce’s Conversion Benchmark Report 2021, the average ecommerce conversion rate is around 5.2%.
💡Pro tip: to improve CVR, you need to understand visitor behavior in two ways:
Where are people leaving your site? → find out in Google Analytics
Why are people leaving your site? → find out with behavior analytics tools like Hotjar
Then optimize the customer journey to drive people to your product pages and through your checkout process. For the biggest improvements, follow these CRO best practices.
9. Average order value (AOV)
Average order value is the average amount customers spend per purchase.
How to calculate average order value:
AOV = Total revenue / Total number of orders
What’s a good average order value?
Your AOV benchmark depends entirely on your ecommerce business. Understanding how to improve your store’s AOV to increase total revenue is what matters most.
💡Pro tip: want to increase your average order value? Here are a few ideas to get started:
Create product bundles with a small per-item discount when multiple items are purchased together
Offer free shipping on orders over a certain value
Increase prices, slowly, to test the impact on total sales
10. Customer lifetime value (CLV or LTV)
Customer lifetime value is how much the average customer spends during the entirety of their experience with you. It’s important for projecting future revenue and knowing how much you should spend to acquire new customers.
to calculate customer lifetime value:
CLV = Average order value x Number of annual purchases x Average customer relationship (in years)
What’s a good customer lifetime value?
Your business is unique, and so is your CLV. But knowing how much a customer is worth to your business today provides guide rails for marketing spend, and a benchmark to continually improve.
11. Customer acquisition cost (CAC)
Customer acquisition cost is how much you spend to get a customer—including sales, marketing, labor, product, and shipping expenses. But let’s simplify by looking at CAC for a specific campaign.
How to calculate customer acquisition cost per campaign:
CAC = Total campaign investment / Number of new customer
What’s a good customer acquisition cost?
Average CAC varies by industry, from $7 for travel companies to $395 for software businesses. Knowing your industry’s benchmark is useful, but it depends on your business. In short, to make a profit, you have to spend less per customer (CAC) than you make from them (CLV).
12. Shopping cart abandonment rate
Shopping cart abandonment rate is the percentage of shoppers who add a product to their cart, but don’t make it through your checkout process.
How to calculate cart abandonment rate:
Cart abandonment rate = 1 - (Number of completed orders / Number of orders initiated) x 100
💡Pro tip: knowing how many people abandon their shopping carts is a useful benchmark. But the real insight comes from knowing why people leave their carts. Find out with an exit-intent survey! Set one up in minutes with Hotjar’s exit-intent survey template, and start making the right user-led improvements instantly.
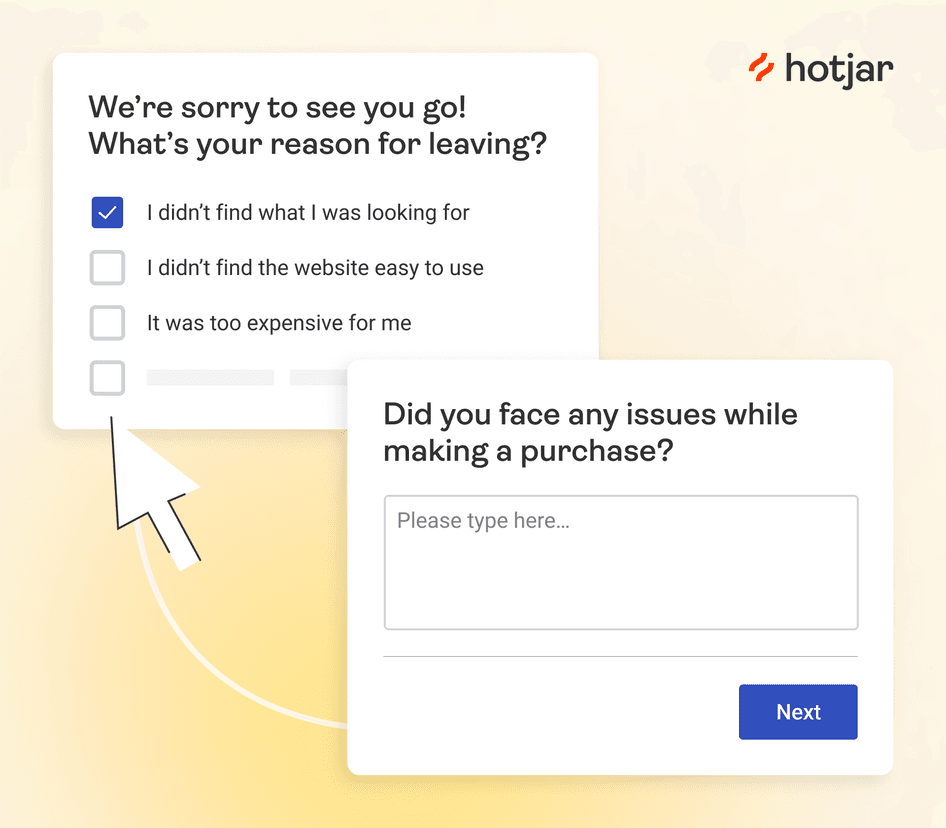
Hotjar’s exit-intent survey helps you understand why shoppers abandon their carts
What’s a good ecommerce cart abandonment rate?
Nearly 70% of online shoppers abandon their carts—yes, it’s that high! If you’re below that, you’re doing just fine, but of course there’s always room to improve.
TomTom, the leading independent navigation company, used Hotjar to identify and fix problems on a checkout process in just half an hour—one of many site improvements that helped increase landing page conversion rates by 49%.
“We couldn’t see the problem internally—as far as we knew, it didn’t exist. We only identified the issue with Hotjar.” – Dave Powell, conversion specialist at TomTom
→ Read more on how TomTom used Hotjar to drive big increases to email CTR and conversion rates.
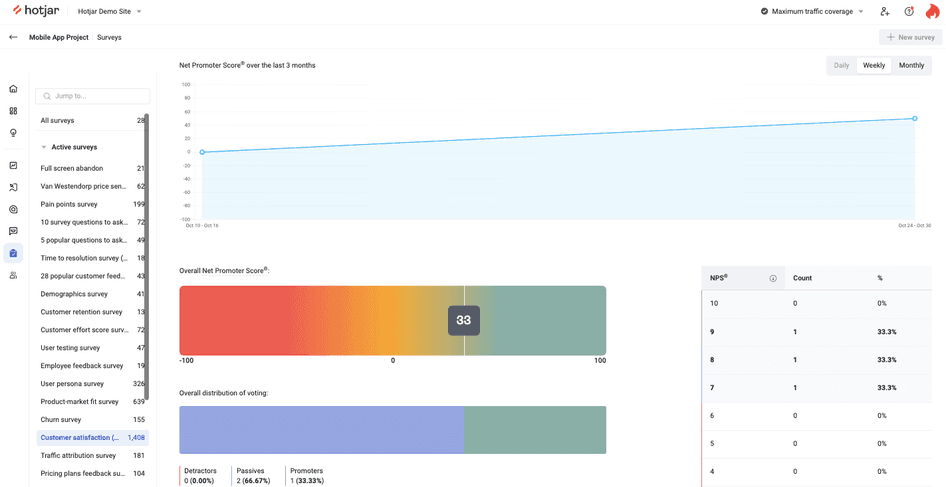
13. Net Promoter Score® (NPS)
Net Promoter Score (NPS) monitors long-term customer loyalty. It’s measured with a two-question survey:
On a scale of 1–10, how likely are you to recommend us to a friend or colleague?
What’s the reason for your score?
Answer scores are separated into three categories:
0-6 = detractors
7-8 = passives
9-10 = promoters
How to calculate NPS:
NPS = % promoters - % detractors
Note: this score is automatically calculated and tracked over time if you’re using Hotjar surveys.
💡Pro tip: passives are not included in the NPS calculation, but they’re one of your most important sources of information. Review passive’s qualitative responses in Question 2 to understand why they’re on the fence—not dissing you, but not loving you either—for insights into key product improvements.
What’s a good NPS score?
Net Promoter Scores range from -100 to 100, and while average scores vary by industry, an NPS of 60 is generally considered excellent. If yours is improving over time, that’s even better.
14. Customer Satisfaction (CSAT)
Customer satisfaction measures people’s overall satisfaction with a product or service. You can use it right after someone makes a purchase, while they’re browsing your website, or as a monthly pulse check.
CSAT is measured with a customer satisfaction survey that asks customers to rate their satisfaction on a 5-point scale, or with a binary yes/no or 😊/🙁 through a live feedback widget.
How to calculate CSAT:
CSAT = (Total positive scores / Number of respondents) x 100
The number of ‘Total positive scores’ depends on the scale you use, but typically includes all the ‘yes’ or 😊 answers, or the ‘satisfied’ and ‘very satisfied’ responses.
What’s a good customer satisfaction score?
CSAT score varies by industry and scale used, but a positive score of 75% or higher is considered good. But what matters most is to calculate your score, so you have a benchmark to measure against and continually improve.
Choosing the right metrics and KPIs for your ecommerce business
If you don’t know what’s happening on ecommerce store, you can’t improve it. But you don’t need to track every single metric and KPI to have a positive impact on your bottom line. Focus on the ones that are most relevant to your business by asking some crucial questions:
Does this metric have a direct impact on my company’s success? For example, more site traffic is a good indicator of sales potential, but it’s less direct than measuring monthly revenue. Therefore, traffic might be a good metric, but not a great KPI.
Will improving this metric help us improve our goals? For example, improving shopping cart abandonment rate means more people complete purchases, which translates directly into more sales.
Does tracking this metric affect the actions I take? If you’re just collecting numbers and not changing your behavior, it’s probably not worth your time to track. Metrics are about decision-making, not spreadsheets.
And finally, don’t be afraid to experiment and adjust. Find what matters to your business, focus on continuous improvement, and watch your ecommerce store go ka-ching.
Start tracking what matters with Hotjar
Hotjar's ecommerce experience insights give you the ‘why’ behind the ‘what’. It’s like ecommerce X-ray vision, so you can provide what your customers love.