Learn / Blog / Article
Everything product teams need to know about shopping cart abandonment rate
Want to win over more customers? Make it easier for them to trust you.
A positive user experience helps you build and maintain a positive customer relationship—and product teams can help create a positive user experience that leads to sales, inspires repeat purchases, and encourages customers to recommend your brand to others.


If you have a high cart abandonment rate, it’s up to you and your product team to optimize the user experience by identifying—and then removing—issues and blockers that cause customers to abandon your website (and their shopping carts).
In this article we cover:
What is cart abandonment rate (and how can product teams help)?
How understanding user behavior can help lower cart abandonment rate
What is cart abandonment rate (and how can product teams help)?
Cart abandonment happens when a potential customer starts an online checkout process for an order but drops out before finishing the purchase. Abandonment rate is a direct reflection of the customer journey.
Think of cart abandonment rate as a ‘missed opportunity rate'. It’s like when someone picks up a product in a physical store, decides it’s not worth it, sets it back on the shelf, and leaves.
The good news: knowing where you stand with your current abandonment rate can help your product team move toward better alignment with your customer (and their evolving expectations) and your product (and its potential value).
How to calculate cart abandonment rate
Calculate the shopping cart abandonment rate by dividing the total number of successfully completed purchases by the number of shopping carts created.
The formula looks like this:
[#] completed purchases / [#] shopping carts created * 100 = [%] cart abandonment rate
💡 Keep in mind: cart abandonment and checkout abandonment are two different situations, not to be confused or seen as interchangeable.
Cart abandonment means a customer has abandoned their purchase at any stage in the journey leading up to the checkout stage.
Checkout abandonment means the customer has left the process after entering their information in the checkout stage of the process.
15 shopping cart abandonment statistics from 2022
Guiding a customer through the sales funnel—and engaging them with a delightful customer experience—only to lose them later in the sales cycle can be one of the most frustrating parts of selling online.
Cart abandonment statistics paint a clear picture of the reasons customers fail to complete their purchases—and help you make data-backed decisions to address these challenges.
These 15 cart abandonment statistics and benchmarks show some of the most common reasons customers abandon, and the specific areas you need to focus on to reduce cart abandonments, create a frictionless customer experience, maximize conversions, increase profits, and build stronger brand loyalty.
1. The global average cart abandonment rate is 69.99% across all industries
There’s a lot of data on shopping cart abandonment rates out there. A simple Google search will reveal data from a ton of different studies, ranging from as low as 56% to as high as 81%.
However, recent data from Baymard paints the most accurate picture across all industries. The institute calculated data from more than 48 different studies and found that the average shopping cart abandonment rate in 2022 is just under 70%—69.99% to be exact. That’s slightly up from 2020, when the average cart abandonment rate was 69.80%.
That means roughly 7 out of every 10 shoppers won’t complete their transaction—and that’s a lot of lost ecommerce revenue.
If your cart abandonment rate is higher than that, look for potential issues in your shopping cart checkout flow, website functionality and layout, and any potentially contradictory messaging in your marketing materials. (We'll show you how—keep reading!)
2. Extra costs are the number one reason for abandoned carts
Every day, thousands of potential customers leave websites without purchasing. The real question is: why do customers abandon their shopping carts?
The Baymard Institute also performed some in-depth research to determine what triggers cart abandonment. 48% of customers say unexpected costs are the main reason for abandoning shopping carts, citing this as the reason they leave.
Extra costs like shipping, taxes, and fees may not always be obvious to customers. As they head to the shopping cart and see those fees added on top of each product price, almost half of customers exit.
Any extra costs tacked on at checkout can be a leading cause of cart abandonment. Along with other reasons why customers abandon shopping carts—which we’ll get into later in the article—they might become your biggest deal-breaker.
3. Customers ages 25–44 are the worst offenders when it comes to giving up on a purchase
According to Hubspot, people aged 25–44 years abandon the cart more than other age groups. This is because retailers have identified millennial shoppers as the most indecisive and frugal online, followed by 18–24-year-olds.
Millenials have a unique predilection to abandon their shopping cart on digital commerce sites. Their tactics include:
Openly placing products in digital shopping carts and abandoning them in the hope of receiving a promotional email or advertisement from the ecommerce site
Intentionally faking their birthdate when disclosing it to a retailer in the hope of landing a better discount at checkout
Offering up multiple email addresses to retailers, in the hope of being able to land additional deals
Pro tip: use product experience insights to understand your millennial shoppers.
The best way to figure out why millennials (or any shoppers) abandon their digital shopping cart is to identify their exit point in the checkout process.
Use Session Recordings to chart individual visitors' journeys and analyze your ecommerce checkout funnel. Identify blockers like confusing navigation, broken links, or slow-loading pages that might get in the way of moving your visitors further along the funnel.

A Hotjar Session Recording in the wild
4. Mobile devices have the highest average cart abandonment rate, at more than 80%
Customers are on their phones all the time—at home, during their commute to work, and even right before bedtime. So when they think of buying something, their phone is the most convenient device to do it from.
More than half of the people worldwide access the internet using mobile devices—accounting for 50.48% of all traffic in ecommerce.
However, data from 2019 shows that the abandonment cart rate is actually higher for mobile users: while sessions on desktops only had a cart abandonment rate of 73.93%, phone devices' cart abandonment rate shot up to 80.79%.
The trend is obvious: the smaller the screen, the more likely a customer is to not purchase. This is a direct result of ecommerce shops not being optimized for mobile—slow load times, unresponsive pages, and clunky navigation. Plus, every inconvenience driving cart abandonment on desktop—like mandatory accounts and long checkout processes—is intensified on smartphones.
5. Cart abandonment is at its highest during the month of December
Customers shop more during the holiday season, making December the time with the highest level of shopping cart abandonment rate. This is followed by November and January. These three months, shoppers browse Christmas present ideas due to Black Friday and January sales.
The cart abandonment rate also fluctuates a lot during this period. In 2020, Black Friday saw global cart abandonment rates of 77.79%. Just a few days later, on Cyber Monday, cart abandonment rate increased to 80.69%.
6. The average checkout flow today is 5.2 steps long and has 11.8 form fields
The requirement to create an online account, a complicated checkout process, and slow delivery—these are some of the top reasons most customers abandon carts, according to Baymard’s 2022 study. What do they all have in common? The lack of convenience.
Today’s average checkout flow contains 11.8 form elements by default, including popular ones like name, address, and birthday. This data helps online retailers better understand their customer base.
Long and complicated checkout processes cause over 17% of shoppers to abandon. Consumers are less willing to wait for things, and have become more impatient.
When shopping online, customers prioritize convenience. It’s become one of the critical factors that determine the likelihood of someone completing a purchase.
Pro tip: capture feedback as someone is leaving your website.
One way to make sure your customers have a hassle-free shopping experience is to ask why they are abandoning their carts.
Add an exit-intent survey where visitors navigate away from the cart, including a simple question asking something like, "Did you face any issues while making a purchase?"
Survey reports will help you analyze and plan the changes you should make to reduce cart abandonment.
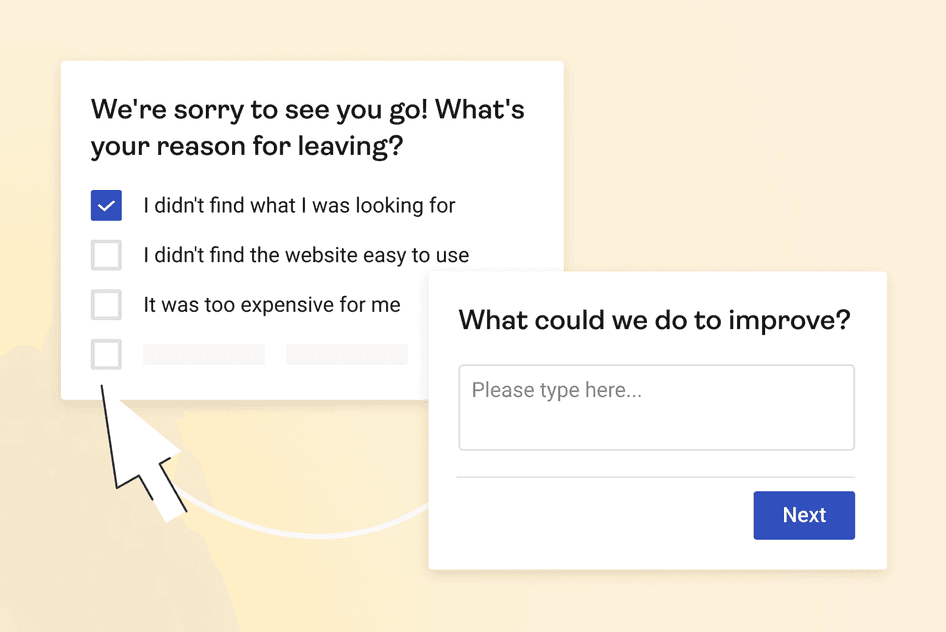
An example of a Hotjar exit-intent survey
7. 9% of customers will abandon a transaction if their preferred payment method is not available
Customers know what they want, and they’ll leave if it’s not available to them. When it comes to payment options, a lack of variety can lead to higher cart abandonment rates. 9% of customers will abandon their cart if the ecommerce website doesn’t offer their preferred payment method.
Historically, the most popular payment gateways have been PayPal, authorize.net, and USA ePay. However, in recent years, especially post-COVID, this list has expanded to include more options for shoppers, including Buy Now, Pay Later (BNPL) and digital wallets.
Additionally, adding a Paypal trust badge to your ecommerce site might help reassure them that the site is secure and trustworthy.
8. 30% of shoppers will leave if they have to re-enter their credit card information
Time is a precious commodity for today’s customers. So precious that, according to Statista, 30% of them may abandon their carts when asked to re-enter credit card information, and 25% will leave if they have to re-enter shipping information. If the checkout is longer than 30 seconds, that number skyrockets to 50% of customers.
This statistic shows that any major redundancy in the checkout process negatively impacts conversions,as well. Remember, it’s all about convenience and creating a delightful customer experience.
9. The average click-through rate for cart abandonment emails is 8.76%
Retargeting—recognizing when a customer is interested in your product, and drawing them back in with a specific ad or campaign—is a great tactic for ecommerce sites. And there is no better way to do this than with cart abandonment emails.
Cart abandonment email open rates are incredibly high. Since 2016, open rates have hovered around 43%. In 2021, the average click-through rate for cart abandonment emails was 8.76%, and has been holding steady since 2016. And with an average conversion rate for shopping cart abandonment emails of 18.64%, this shows that incorporating personalization into your email strategies can have real results.
10. Finance and non-profits experience some of the world’s highest cart abandonment rates
A ‘good’ cart abandonment rate changes dramatically depending on what industry your store is, and cart abandonment rates vary drastically from industry to industry. A study conducted by Statista shows that the abandonment rate went up by over 24% from the Gaming industry to the Finance one.
In fact, the Finance industry is only equaled by non-profits as the industries with the highest cart abandonment rates, at just over 83%. This averages over 10% more than the global average shopping cart abandonment rate. One reason why may be because these types of industries require a lot of steps to complete.
11. 13% of customers cite website errors or crashes as a reason for abandonment
Website errors, crashes, and load times are major deterrents to completing purchase for at least 13% of customers.
These issues contribute to a sense of insecurity on the site, adding to the 18% of customers who don’t trust sites with their credit card information.
Pro tip: focus on delivering a consistent customer experience.
Make sure you’re regularly going through your site, from home page to checkout, ensuring your site is still up-to-date and there are no issues.
Changed something in the checkout flow and want to see how it impacts the cart abandonment? Create a trend in your Hotjar Dashboard that shows the sessions where users added something to their cart but didn’t complete the checkout. Then, click through the session recordings to understand what prevents them from completing the purchase.
You should perform these checks across a variety of screen sizes, especially as mobile continues to grow in importance.
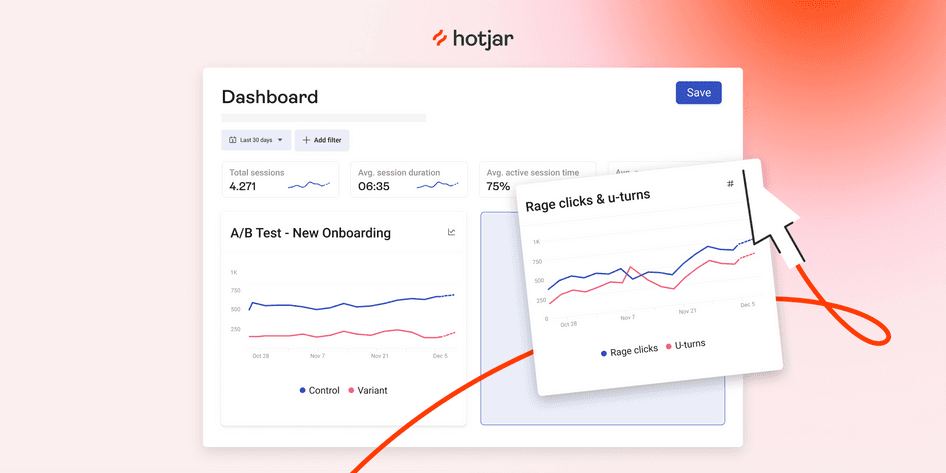
An example of a Hotjar Dashboard
12. 90% of online consumers will abandon their carts if they have to wait too long for a page to load
A YOTTAA study carried out in 2020 found that 9 out of 10 shoppers will abandon a site if it takes too long to load. Of that, 57% were likely to purchase from a competitor instead, and 14% never returned to the ecommerce site.
This statistic shows how long you have before most potential customers leave your ecommerce site. Keep your site speed in check by testing your website both on desktop and mobile to test the page-load time, and by taking advantage of conversion rate optimization tools to boost sales and user experience (UX).
Remember: every second counts—a one-second page load improvement delivers a 5.7% increase in conversion.
13. After abandoning, 26% of shoppers switch to a competitor
Most online shoppers have little patience and high expectations. Once they know your site is sluggish, hard to navigate, or contains hidden extra costs, most will abandon and avoid it. So, what happens after customers leave your site?
Research from Statista found that when UK shoppers abandon carts, less than a third return to the site. Plus, about 26% of them buy the same product from a competitor.
14. Better checkout design can lead to a 35.26% increase in conversion rate for ecommerce sites
At the end of the day, no matter how much you optimize your checkout page and process, some cart abandonment is inevitable. How much, exactly, is up to you.
According to the Baymard Institute, the average large-sized ecommerce site can gain a 35.26% increase in conversion rate through better checkout design. This translates to $260 billion worth of lost orders, which are recoverable solely through a better checkout flow and design.
15. 25% of consumers appreciate being reminded of products they browsed
Basic retargeting—which is sending ads based on a consumer’s previous actions—is helpful for bringing qualified leads back to your ecommerce site. And as it turns out, some customers actually enjoy it.
A quarter of consumers say they actually like seeing retargeted ads because they are reminded of what they had previously been looking for. And brands that segment out different retargeting audience lists for people who behave differently have seen ROIs of more than 1,300%.
4 reasons customers abandon their shopping carts
Here are four common problems that tend to drive customers away from your website or product—with some tips on what you can aim for instead:
1. Lack of trust
If your website is poorly designed or difficult to navigate, you might struggle to make that all-important first impression to keep customers interested in buying from you.
Your customers want to feel secure while they shop, so think about including strong visual cues that make it clear your website is GDPR compliant and set up for SSL certificates.
Some other ways product teams can build stronger trust signals with the customer include:
A mobile-friendly website
High-quality product imagery
On-brand copy
More than one payment option
Fewer advertisements or interruptions in the checkout process
A clearly-stated privacy policy (read Hotjar's approach to privacy, as an example)
A consistent visual identity—from color palettes to font choices to logo usage
Reliable trust signals and a better user experience remind your customers they’ve come to the right place for a particular product or service (your product or service!).
Over time, offering a consistent, reliable experience can lead to repeat customers becoming your advocates and loyal fans.
2. Payment options aren’t easy to see (or use)
Your customers are usually shopping around for the best deals. A complicated checkout process means users will have to spend time filling in all the fields. This doesn’t bode well for their short attention span.
According to Forter, customers will wait:
9 seconds for the next page in the checkout to load
10 seconds for credit card verification
12 seconds for an email confirmation
If customers can’t figure out how to pay for the product or service they want—or have to re-enter their credit card information over and over again to do so—they might abandon their carts at the last minute for a competitor.
Offer your customers different payment methods without introducing unnecessary friction or complexity, and save them from decision paralysis.
To make payment methods transparent and less overwhelming, consider offering:
A single view of all available payment methods
Strong visual cues indicating which payment option was selected
Progressive disclosure on forms to preview next steps
Microcopy describing the terms and conditions of different payment options
Defaulting to popular choices for easier decision-making—like PayPal, authorize.net, or USA ePay
🔥 A tip from the Hotjar team: be open to taking risks, trying new things, and learning from failure to figure out what truly works, with a willingness to let go of tactics that don’t help make your customer’s life easier.
"Tiny changes to your pricing page can have a dramatic impact on your bottom line. A 1% improvement might not sound like much, but if you’re a business that generates 7-figure revenue online, that could generate $10,000+ in new sales.
"At Hotjar, we’re continually testing and tweaking our pricing page to get it performing as efficiently as possible. With such a significant page, there’s no test too small. We’ll try everything from completely changing the copy to trialing different colors on our buttons."
— Phill Agnew, Senior Product Marketer
3. Confusing navigation
The best website experiences help customers feel in control, so it’s important that the checkout process feels simple, focused, and informative.
The aim? Less confusion, more decisions motivated by delight.
Product teams can create an easy checkout flow with:
A progress indicator that clearly outlines each step in the checkout process
A simple checkout page design that drives purchases with minimal decisions
Delivery estimates to set expectations about shipping time and costs
Make sure the checkout process is transparent, helpful, and respectful of customers' time—the easier it is for a customer to navigate the checkout process, the easier it will be to close a sale.
💡 Pro tip: Hotjar helps product teams collect user behavior analytics data—a superpower for understanding why customers might find website navigation or checkout flows confusing.
Behavior analytics tools help you answer questions about your visitors and customers that traditional web analytics can't, including:
Where on a page they get stuck and struggle before dropping off
How they interact with individual page elements and sections
What they’re interested in or ignoring
What they actually want from your website or product
Knowing how people interact with your website is a good start, but to level up you need to understand why they are taking the actions they take—that’s how Hotjar can help.
4. Lack of localization
Your customers can exist in different cultural contexts, so how will you show that your website user experience can adapt to their lived experience? As a product team, you need to be aware of a message or image’s original intent, style, tone, and context when switching between cultures.
Your team doesn’t have to wait until product launch to consider:
Text expansion in the user interface to preserve meaning and character counts across different languages
Visual preferences based on cultural contexts, such as minimal design choices versus showing all the information on the homepage
Giving customers the option to choose their preferences (currency, language, regional content) based on where they live
User research is a key ingredient here, and behavior analytics can help tailor the user experience to fit different cultures by offering insights that help keep designs flexible and scalable.
💡 Pro tip: Understand the journey before trying to solve the problem. A customer’s purchase decision can take many repeat visits—or just a few moments. Either way, there are typically five stages in the customer journey:
Awareness: the customer learns about your product
Consideration: the customer sees something they like, and they start browsing your site
Intent: the customer adds items to a wishlist or a shopping cart, but they're still only considering the purchase
Purchase: the customer buys your product (also known as the conversion stage)
Engagement: the customer comes back for more—they may purchase again, engage on social media, subscribe to your newsletter, read articles, and subscribe to customer-only bonuses and upsells
Remember: each person takes a unique route to buying, and each customer's journey through the funnel is personal and nonlinear. Learn how to apply your conversion funnel to the way real people shop online.
How understanding user behavior can help lower cart abandonment rate
Now you know common reasons customers abandon their shopping carts, you need to use qualitative and quantitative user research to understand why they're abandoning their carts on your site:
Identify issues and blockers with session recordings
Session recordings are renderings of real actions taken by real visitors as they use your website. Recordings capture mouse movements, clicks, taps, and scrolling across multiple pages on desktop and mobile devices.
Also known as session replays, user recordings, and user/visitor replay tools, Hotjar Session Recordings help you understand how users interact with your website based on actions they take. This visual evidence can help you identify issues and blockers, optimize UX, and ultimately improve conversion rates.
Get in-the-moment user feedback
Combine your session recordings with instant visual feedback to get an even clearer picture of what’s happening on your website or app—and get closer to understanding customers.
Hotjar's Incoming Feedback widget gives you a glimpse inside your customers’ minds. Use the sentiment or suggestions they share to improve UX, reduce drop-offs, and boost conversions.
Discover website issues across devices with heatmaps
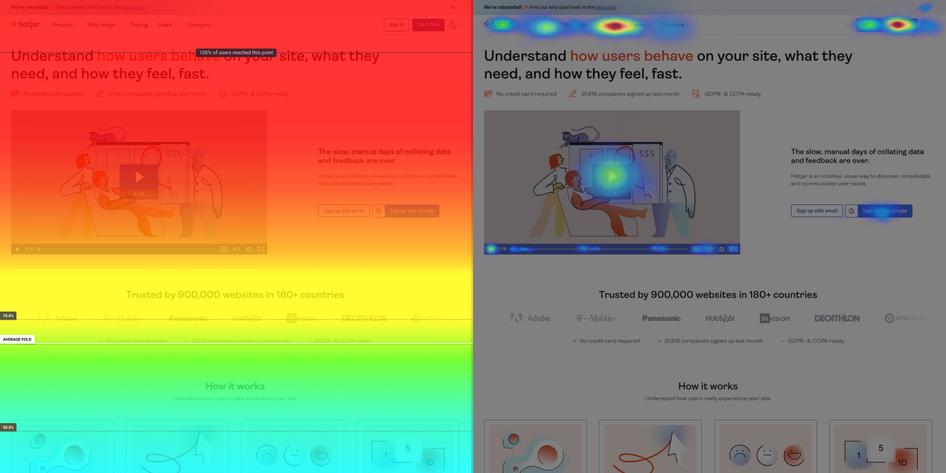
Website heatmaps visualize the most popular (hot) and unpopular (cold) elements of a webpage using colors on a scale from red to blue. Heatmaps can show you whether your customers are:
Seeing (or missing) important content
Seeing and using a page’s main links, buttons, opt-ins, and CTAs
Getting distracted by non-clickable page elements
Experiencing website issues across devices
As a visual tool, heatmaps help you make informed, data-based decisions for A/B testing, updating, or (re)designing your website.
Heatmaps are also useful on a wider business scale: show team members and stakeholders what’s happening and get buy-in for change. It’s hard to argue with a heatmap, especially when you layer your heatmap data with data from other behavior analytics tools.
Learn why your visitors aren’t converting
Hotjar shows you what keeps your visitors from buying, so you can make website changes based on real insights, not assumptions, and watch your conversion rate grow.

6 ways to improve cart abandonment rate
Here’s how to build a solid relationship with your customers when they're still undecided about your brand, using the tools we mention above (and with the help of Hotjar 👋):
1. Build trust with visual and text-based social proof
Think of your website and checkout flow like a two-way conversation: you shouldn’t just be talking about how great you are—include evidence that other people think so, too!
Often called ‘social proof’, a visual or text-based endorsement from an industry or individual can help customers feel safe when shopping with you. Examples that you’re a trusted brand can include:
A ‘verified’ badge on your social media profiles
A ‘secure payment’ trust badge that’s highly visible during the checkout process
Validated security certificates during each step of the payment process
There’s strong evidence that customer testimonials can help drive sales as well. From star ratings and bestseller alerts to celebrity endorsements and social media mentions, carefully-chosen moments or value propositions can help convert a website visitor from a casual user to a committed customer.
Heatmaps can help you learn how to improve your social proof by:
Showing if important content is being ignored on certain pages
Showing when users ignore a video
Showing where (and when) users move their mouse on a webpage
💡 Learn from the success stories of cross-functional product teams:
Did you know that between January 2019 to January 2020, Hotjar was used to generate around 1,715,313 heatmaps for almost 350 thousand organizations?
To learn more, check out the case studies chapter of our Heatmaps guide and read success stories from marketers, UX designers, and product and ecommerce managers who used website heatmaps to improve their sites.
Psst: is your product team working remotely? Hotjar is designed to be used by distributed teams.
2. Include a guest checkout option to speed up the checkout process
When your customer is motivated to buy your product or service, it's in your best interest that it be easy for them to buy. Your product team can use session recordings to look for issues and blockers that slow down (or break) the checkout process, like:
Broken page links
Slow page loading times
Poor or confusing navigation
Cross-browser compatibility issues
Cross-device compatibility issues
Session recordings also let you see how users behave on your site in the moments before they abandon their cart, which can help you identify patterns and behaviors (like rage clicks or u-turns) that indicate a poor customer experience.
For example, if creating a user account isn't a requirement, new customers may want to skip that step of the checkout process—session recordings can show you how often customers are using a guest checkout option to make their purchase.
On the other hand, if creating a user account is a requirement, session recordings can show you whether customers are creating an account or exiting the page when they get to the account-creation part of the checkout process.—in which case you might consider adding a guest checkout option as a time-sensitive way to guide them to a final purchase decision.
3. A/B test changes to your website
In-depth analysis of user behavior is more than just number crunching—it’s also about understanding how users experience and interact with your website, and running experiments to learn more.
In an A/B test, half of the users landing on your website will see the original (or 'control') version A. The other half will see a 'variation' version B that features a change or group of changes like a different header, images, call to action (CTA), page structure, etc.
To reduce cart abandonment rate, your product team can use A/B testing to experiment with:
Different value propositions
A variety of special offers
The number of allocated steps in the checkout process
Variations of CTA buttons
It's easy to monitor A/B tests by integrating Hotjar with Optimizely or Omniconvert. Learn how to monitor A/B tests with Hotjar’s tools.
4. Be transparent about your costs and return policy
If they’re not able to see the full product price—including shipping and other fees—before checkout, shoppers are likely to not go through with their purchase. This shows why it’s so important to be transparent with extra costs.
Provide your customers with the exact total, including shipping and taxes, directly in the cart, so they know exactly what they’ll pay.
Another way to reduce cart abandonment here is to highlight your return policy. Shoppers want to know they have options for items they buy online. If they feel that it's a risk-free or low-risk buy, they’ll be more motivated to complete their purchase.
If an item is unexchangeable, or there's a 'zero return policy' in place, customers begin to doubt their purchase and abandon their cart. Around 1 in 10 cases of cart abandonment are due to unclear or no return policies. However, up to 66% of shoppers say they would spend more with a generous return policy.
One option to optimize your return policy is to try offering a free, 30-day return policy for a few months. Remember to keep tracking the number of returns and compare this to the added shipping costs to see if this is a profitable strategy for you.
5. Optimize your cart abandonment emails
Cart recovery emails are another way to improve abandonment rates. This type of email marketing collects product information data—including a list of items in the customer’s cart—and delivers a reminder for the user to complete the purchase.
Setting up an automated cart abandonment email is a great way to lower your cart abandonment rates, and take advantage of that stellar 43% open rate we mentioned before. 1 in 5 recipients of a cart abandonment email click it; 11% will purchase something as a result.
Here are two ways to optimize this process:
Personalize your cart abandonment emails
People tend to trust easier if they can connect with the brand or product on a more personal level. Try using the shopper’s name in the subject line and email copy, and take advantage of information like birthdays, location, and even when you send the email to improve personalization.
Use compelling subject lines
A short and straightforward subject line can help improve your cart abandonment email open rate. Here are a few examples:
Your cart is waiting
Finish your purchase
Still shopping?
You left items in your cart
15% off your cart
Reminder: there are items in your cart
Forget something?
What's that in your cart?
A reminder of the product they’ve left in the cart—along with extra incentives—can be enough to convince a shopper to continue with their purchase.
6. Retarget cart abandoners with relevant ads
Another option that leverages customer information to recover a lost sale from cart abandonment is retargeting ads. These ads target your cart abandoners everywhere else online, and reach out and lead customers back to your site to finalize their purchases.
Research shows that retargeted ads can reduce cart abandonment by 6.5%, and increase online sales by almost 20%. Here are a few tips to get you started with retargeting:
Retargeting can lift ad engagement rates significantly, so be bold. Use advertising slots on social media, email, and other websites.
Google Display Network and Facebook have a massive reach and are the ideal platforms where you can retarget your cart abandoners. The Google Display Network reaches around 90% of all internet users while Facebook has around 3 billion monthly active users.
Use dynamic product ads to show customers the exact items they’ve left in the cart, and nudge them to head back to your website to complete the purchase.
Shoppers who spend more time engaging with your business on Facebook will be more likely to purchase. Make sure to include this as you filter your retargeting audiences.
What other metrics should you be tracking (besides cart abandonment rate)?
To find out what’s motivating a customer to abandon their shopping cart or the checkout process, you can dig a little deeper into some other metrics too, to connect the dots:
Abandoned order value
How much are abandoned shopping carts actually costing you?
Knowing your abandoned order value (AOV) can tell you what you stand to gain by reducing your cart abandonment rate, and can bring up questions around conversion rate optimization (CRO)—which can then lead to improvements to the user experience (UX) like an updated site design or shop layout.
Website load times
The faster your checkout process is, the more likely it is that a customer will make a purchase—plus, they'll have an easier time entering their payment information.
If you’re wondering how Hotjar might affect your site's load time, Hotjar’s script has been designed to have a minimal effect on your site performance. This means Hotjar's usage tracking for Recordings, Heatmaps, and feedback only works in modern browsers that execute JavaScript efficiently.
Device usage
Your customer’s user experience will change depending on whether they’re browsing on mobile, web, or tablet.
Hotjar can help you generate heatmaps, watch session recordings, and gather user feedback on every page on your website, including password-protected pages and dynamically generated pages.
By knowing your customer’s preferred device, your product team can track issues across different devices or identify issues with checkout on a specific device.
Reassure your customers at every step of the customer journey (and stop missing out on sales!)
Cart abandonment recovery is an art you can master over time by investing in tools (like Hotjar 👋) to help you understand what your customer says and does over time—and why.
According to Sue Duris, Director of Marketing & Customer Experience M4 Communications, Inc., every customer will have their ‘zero moment of truth’: when they realize they have a problem and start searching for a solution.
By meeting customers where they are, product teams can figure out what’s most important to them. After all, analysis isn’t only about the tools you use; it’s also about how you use them, and why.
Be diligent about addressing customer issues as they come up: use heatmaps, session recordings, and regular customer feedback to improve your content, make design tweaks, and simplify your website navigation.
Invest attention and effort into understanding user behavior, and you’ll not only realize who you’re serving behind every click but also uphold the value that what’s right for your customer is often what’s best for business.
Want to learn how to bring more customers back to your website?
Sign up for a free Hotjar account to understand your customers and give them the online experience they deserve.
Related articles

CRO
7 stats that prove user-centric websites win for mid-market companies in 2024 (with tips on how to improve UX)
Is your website user experience holding you back? Don’t rely on guesswork and gut feeling alone: use data to elevate your UX and enhance your bottom line.

Shadz Loresco
CRO
7 stats that prove user-centric websites win in 2024 (with tips on how to improve UX)
Is your website user experience holding you back? Don’t rely on guesswork and gut feeling alone: use data to elevate your UX and enhance your bottom line.
Shadz Loresco

CRO
How to improve your online reputation to acquire more users and customers
A good online reputation inspires your users to share positive reviews that make your business more trustworthy in the eyes of potential customers, and, in turn, increases sales.
But it takes more than a good product to build and maintain an effective online presence. You have to actively listen to customers to understand how they feel and make changes to improve the user experience (UX).
Hotjar team