Learn / Guides / Ecommerce guide
Ecommerce analytics: how to use data to increase online sales
You’ve got an online store, and people regularly make purchases. But how many people arrive on your site and don’t buy anything? Why do some buy and others don’t? And most importantly, how can you make sense of user behavior to boost sales?
Improving your ecommerce site starts with knowing what’s happening. How? With ecommerce analytics—qualitative and quantitative data that reveal what visitors are doing, thinking, wanting, and missing.

Ecommerce analytics are empathy glasses that let you look inside your customers’ minds. When well-focused, they reveal the fit between what your customers are looking for and the products or services you offer, improving the overall customer experience and boosting online revenue in the process.
In this chapter, we’ll give you those empathy glasses and teach you how to focus them. You’ll learn about quantitative vs. qualitative data, how to understand your data, and how to use ecommerce analytics to improve the ecommerce journey. Keep reading for additional context, or skip straight to the analytics for each customer journey stage:
1. Acquisition: finding the right audience
Start tracking what matters with Hotjar
Hotjar's ecommerce experience insights give you the ‘why’ behind the ‘what’. It’s like ecommerce X-ray vision, so you can provide more of what your customers love.

Ecommerce analytics: what it is and why you need it
Imagine you run a small grocery store. Some people walk in, grab a few things, pay, and leave. Others wander the aisles, browsing options, and finally arrive at the checkout counter—or walk out of the door. If you’re just waiting behind the register, you'll never know what’s going through these different buyers’ minds.
While you may not be a brick-and-mortar business, this scenario isn't much different from trying to grow your ecommerce store by staring at your Stripe account and hoping for the best. Hardly an effective strategy, is it?
Enter ecommerce analytics.
Ecommerce analytics refers to the data and methods used to understand your online buyers and optimize their online shopping experience.
It helps you answer questions like:
How do people discover you?
What channels and campaigns drive people to your store?
What devices are people shopping from?
How long do people spend on your site?
What products are selling best, and to who?
Are bugs or user experience (UX) issues turning people away?
Analytics answers all of these questions—and many more.
The 2 types of data for your ecommerce site
Let’s go back to our grocery store, where you decide to get out from behind the register and start tracking shopper behavior.
You count the people who enter the shop, estimate how long they stay, and keep track of items often purchased together. This is quantitative data.
You also ask shoppers what they’re looking for, if they found everything okay, and what could improve their experience. This is qualitative data.
Both quantitative and qualitative analytics are important for making data-driven decisions. Let’s look deeper into each.
Quantitative data: what’s happening in your store
Quantitative data is any information that can be counted or calculated.
Consider:
200 people visit your shop every day
Of these people, 120 buy something: a 60% conversion rate
Now you have a benchmark for comparing future activity
Quantitative analytics reveals trends you can use to improve sales. For example, if you notice people who buy baby diapers also tend to buy ibuprofen, you might place those items close together.
But quantitative ecommerce tracking analytics has a shortcoming: it shows you what people do in your store, but it doesn’t tell you why you observe this behavior.
To dive into the why, you need qualitative analytics.
Qualitative data: what’s happening in their heads
Qualitative data goes beyond numbers to give insights into your users’ behavior and motivation.
For example, imagine that of the 200 people who walk into your store each day, about 40 of them enter, glance around, then walk back out.
Why are they leaving? Did they forget their shopping list? Did Amazon just text them an offer for cheaper cereal? Did the flickering neon lights send them running?
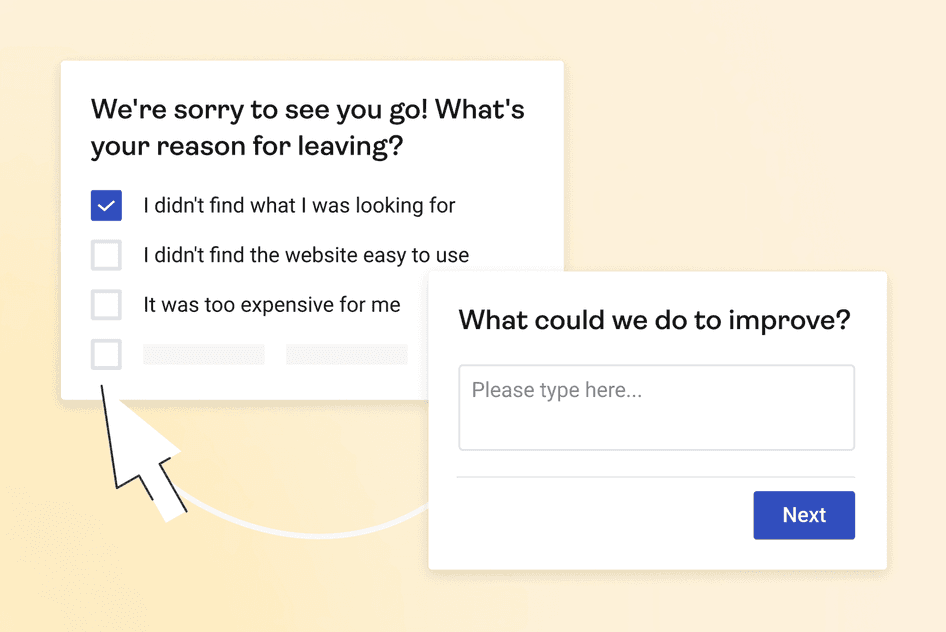
Their behavior alone won’t tell you—but qualitative data (like the type you’d get with Hotjar’s session recordings or an exit intent survey) will certainly help.
Note: qualitative analytics don’t replace quantitative data. To optimize your site for sales and happy return customers, you need both.
A 3-step framework for boosting ecommerce sales
It's useful to zoom out and consider an ecommerce customer journey consisting of three stages:
Ecommerce analytics gives you insight across the entire journey, from finding the right audience to making the sale. In the following sections, we show you the data analytics you need to know at each stage of this journey, and how to turn this data into business-boosting insights.
Need a full list of metrics to keep an eye on? Look out for our upcoming chapter on the top ecommerce metrics and key performance indicators (KPIs) you need to track.
1. Acquisition: finding the right audience
Acquisition is the process of gaining new visitors to your ecommerce store using a mix of digital marketing strategies and channels—like search engine optimization (SEO), paid search, social media, and email marketing.
Acquisition analytics helps you understand who’s visiting your site: where they come from, what pages they land on, and what devices they use to browse.
Understand who’s visiting your site
Knowing who’s visiting your site helps you evaluate your marketing efforts’ success and provides a benchmark for your site's popularity and discoverability.
📊 Data to help you increase sales
Total traffic: shows how many people visit your site in a given period of time
New users: reflects how well your acquisition strategies are working
Returning users: indicates visitors who had a good experience with you
Decreases in traffic may indicate changes to Google’s search algorithm or an underperforming campaign. If traffic drops, determine what channels and landing pages are affected so you can optimize your website.
🔎 Where to find this information
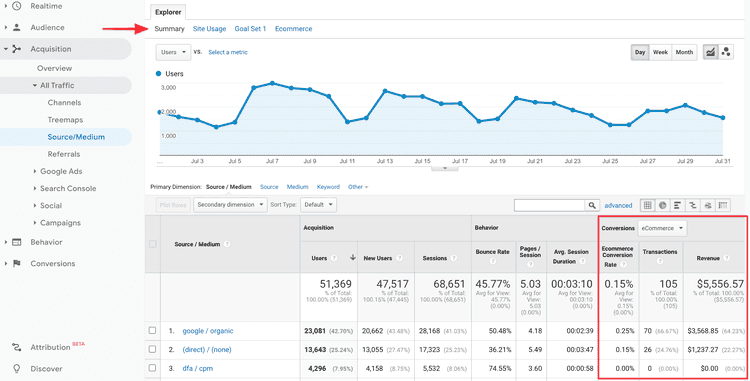
For basic traffic numbers: Google Analytics > Acquisition panel
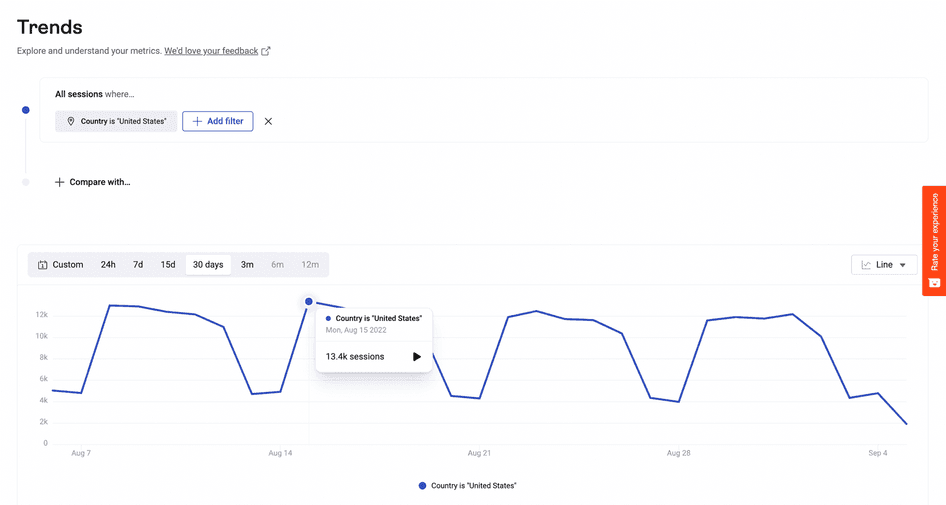
To dive into traffic spikes and dips: Hotjar Trends (available on our Observe Scale plan) with heatmaps and recordings
💡Pro tip: more traffic usually means more sales, but cross-check traffic segments with conversion rates to make sure. If visitors increase but conversion rates drop, this indicates you’re attracting the wrong audience, or you need to fix UX issues on your site.
Learn how people discover your site
Knowing how people find your ecommerce store helps you evaluate your marketing strategies, optimize the most effective channels, and drop what's not working. People take different routes to your site—search engines, social media, email campaigns. But with limited resources, you have to prioritize the most effective ones.
📊 Data to help you increase sales
Channel breakdown: shows what channels drive the most traffic to your site
Landing page: reveals what pages people first see on your site
🔎 Where to find this information
Google Analytics > Acquisition panel
💡Pro tip: using Hotjar’s heatmaps and recordings? Our Observe Business and Scale plans let you filter your insights by referrer URL—the site a user was on just before landing on yours—to help you better understand your users’ journeys.
Know what devices people use to browse your site
Keeping track of the devices people use when browsing your online store helps you prioritize your optimization efforts.
For example, if most of your traffic is mobile, ensure your site is mobile-friendly to avoid potential customers bouncing off your site—and going to a competitor’s. Remember that an optimized mobile experience increases conversions by as much as 63%.
📊 Data to help you increase sales
Device breakdown: shows the percentage of people who browse your site from desktop vs. mobile devices
🔎 Where to find this information
For basic breakdown: Google Analytics > Acquisition panel > ‘Device category’
For deeper insights: Hotjar Trends provides a more visual quantitative breakdown of behavior by device
2. Engagement: connecting with visitors
Engagement is how a visitor interacts with your ecommerce store, including time spent, pages viewed, and actions like button clicks and video plays.
Engagement analytics helps you see what people like and where they lose interest, identify potential UX issues, improve site navigation, and optimize conversion paths.
Measure how long people stay on your site
Longer time on site, more pages visited, and higher engagement rate indicate more interest—or a better fit between who you attract and what you offer.
📊 Data to help you increase sales
Time on site: the average time users spend on your site each visit
Pages per visit: the average number of pages users see on a single visit
Engagement rate: the percentage of visitors who spend more than 10 seconds on your site, visit two or more pages, or trigger a conversion event
Bounce rate: the percentage of people who arrive and then leave right away
💡Pro tip: the average ecommerce bounce rate is between 20% and 45%. If you have high-bounce pages, use Hotjar Recordings tool to see how real users interact with your site, including rage clicks caused by broken links or poor UX.
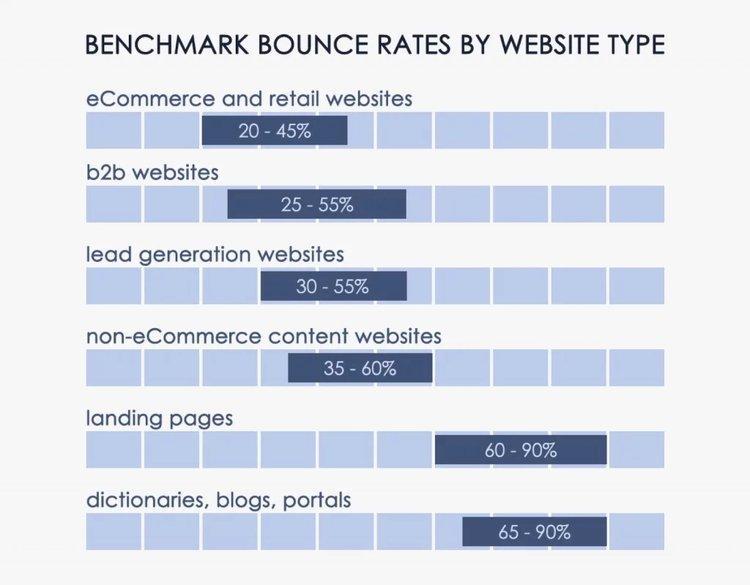
Benchmark website bounce rates from CXL
🔎 Where to find this information
For a simple percentage: Google Analytics > Acquisition panel
For in-depth visual insights: Hotjar’s session recordings
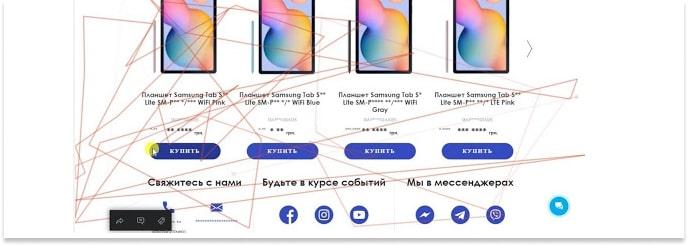
A Hotjar Recording captured by agency Turum-Burum showing a visitor struggling to find the product they need
See what your visitors care about
Knowing what people care about on your site—and what they’re not interested in—provides insight into the pages and products you should feature and gives you tips on how to improve user experience.
📊 Data to help you increase sales
Views by page: shows which pages get the most traffic, indicating which pages people find easily and click on frequently
Time on page: shows how long people stay on each page
💡Pro tip: if you see lots of interest in, say, your ‘Deals of the Week’ page, make it easy to find by placing it in your main navigation menu. If time on page is low, take a more granular look at user behavior with Hotjar Heatmaps.
Scroll maps show you how far people scroll down each page
Click maps see activity like video plays, button clicks, and menu taps
🔎 Where to find this information
For basic data: Google Analytics > Engagement panel
For actionable insights: Hotjar session recordings and heatmaps
For instant feedback: Hotjar’s Feedback reveals people’s interests, satisfaction, and what you can do to improve
💡Pro tip: dive deeper into your user’s heads with Hotjar Engage, a user-testing and interview platform. It helps you recruit the right people and seamlessly record and transcribe calls, so your whole team can turn insights into action.
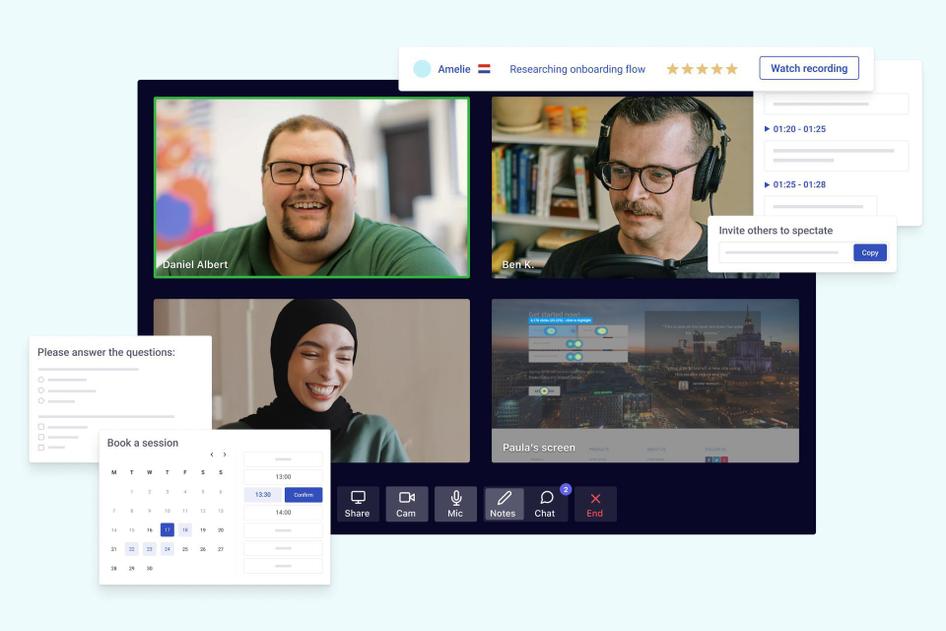
Hotjar Engage makes it easier than ever to hear from your customers
Discover where and why people leave
At some point, everyone leaves your site. Ideally, this happens right after a big purchase, but more likely, it occurs before the checkout. A high exit rate on key pages could signal potential usability issues, like broken links or confusing copy.
📊 Data to help you increase sales
Exit rate: tells you how often your ecommerce site visitors leave a page
🔎 Where to find this information
To identify underperforming pages: Google Analytics > Exit by page
To pinpoint troublesome parts of the page: Hotjar session recordings
For deeper insights: ask users directly with a Hotjar exit intent survey
3. Conversion: making the sale
Conversion is the process of making a sale on an ecommerce site. It can refer to the number of sales or the percentage of people who buy out of the total number of site visitors.
Conversion analytics reveals how effective you are at bringing the right people to your site, the attractiveness of your products and prices, and the experience you provide—from your landing page through your checkout process.
Calculate conversion rates
Monitoring conversion rates reveals what percentage of site visitors are buying and which segments and channels attract the highest-value customers.
📊 Data to help you increase sales
Conversion rate: the number of visitors who purchase / total number of site visitors
Traffic and conversion rates go hand-in-hand in a successful ecommerce business. A low conversion typically rate means you’re attracting uninterested buyers or providing a poor user experience.
🔎 Where to find this information
For simple rates: Google Analytics > Conversion metrics
For in-depth insights: Hotjar session recordings and heatmaps
💡Pro tip: Conversion analytics becomes more powerful when looking at user segments. For example, compare conversion rates depending on the channels people use to find you, or the landing page they first arrived on. You can see this in Hotjar Trends.
Keep an eye on checkout flows
Monitoring checkout flows helps you identify missed sales opportunities, so you can turn near-sales into new revenue. The average cart abandonment rate is almost 70%, which represents a lot of lost sales—but also a big opportunity to boost business if you know why it happens.
📊 Data to help you increase sales
Cart abandonment: when a visitor adds an item to their cart but leaves without completing the purchase
Checkout abandonment: when a customer leaves the process after entering the checkout stage
❓Why do users abandon their carts?
One of the most common reasons is distraction: a user intends to buy, but they’re multitasking and forget to finish their purchase. Other reasons include slow page load times and complicated or broken checkout flows.
The good news is that once you’ve identified the problem, there are clear steps to take to improve your shopping cart and skyrocket sales.
🔎 Where to find this information
For simple rates: Google Analytics > Ecommerce tracking
To understand why people leave: Hotjar recordings and heatmaps
To ask users directly: Hotjar exit intent survey
Track average order revenue
Knowing how much people spend lets you project future revenue and estimate levers for growth. To grow your business, you need more people to buy, each buyer to spend more, or both.
📊 Data to help you increase sales
Average order value (AOV): how much the average shopper spends per order
🔎 Where to find this information
Google Analytics > Ecommerce tracking
Gauge customer experience
Building a successful ecommerce site isn’t just about making a sale—it’s about creating a happy customer, because it’s cheaper to retain a happy customer than to convince a new buyer to make a first-time purchase.
📊 Data to help you increase sales
Customer satisfaction (CSAT) survey: to measure recent satisfaction
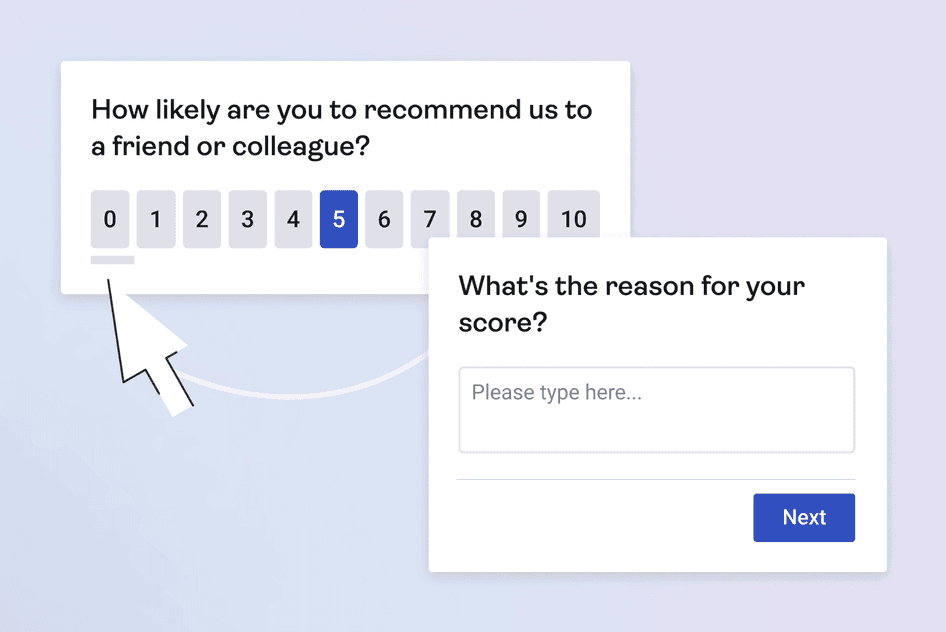
Net Promoter Score® (NPS) survey: to measure long-term loyalty
Both are easy to administer (using Hotjar Surveys!)—and easy for your customers to answer—and provide quantitative and qualitative feedback that you can act on immediately to improve customer retention.
Get out from behind the register
Ecommerce without analytics is like sitting behind the cash register, hoping someone will walk up and hand you their credit card.
But a purchase isn’t made at the checkout counter. It’s the result of a series of steps someone takes to get to know you, decide to buy, and—if you’re doing right—return to buy again.
Ecommerce analytics gives you the insights to understand user behavior and motivations. And when you know why people do what they do, or don’t do, you can make the changes needed to boost business.
Get out from behind the register. Observe what’s going on. Ask what people need. Engage with your prospects. And watch your ecommerce site boom.
Ready to dive deeper into analytics?
The right data is a critical factor in growing your ecommerce empire. But which metrics should you pay attention to, and what tools will make your analysis easier? We have all the answers in the next two chapters of our ecommerce analytics guide.
Start tracking what matters with Hotjar
Hotjar's ecommerce experience insights give you the ‘why’ behind the ‘what’. It’s like ecommerce X-ray vision, so you can provide more of what your customers love.