Learn / Guides / GA glossary (A-Z)
Ecommerce tracking in Google Analytics
For online businesses, using Google Analytics is essential. It’s how you learn what happened on your website, from exits and bounces to landing page views and audience demographics. But if your site works as a self-serve online store, that data isn’t enough to make informed decisions.
Instead, you need rich, in-depth data—metrics like add-to-cart events, cart abandonment rate, conversion rate per product category, and revenue per traffic source.
That’s where ecommerce tracking with Google Analytics 4 (GA4) comes in.
Summary
This guide gives you hands-on tips to analyze the performance of your online store in GA4 and take action based on what you learn, including
What is ecommerce tracking in GA4? Learn the benefits of having ecommerce data in GA4 and where to find it in your Google Analytics dashboard.
Types of online shopping activities you can track with GA4: track user actions throughout the browsing, shopping, and checkout journey with GA4 and build in-depth, actionable ecommerce reports
8 ecommerce insights to find in GA4 for maximum results: insights like product revenue, cart abandonment rate, high-performing campaigns and landing pages, and how your customers behave over time help you make the best decisions for your online store
What is ecommerce tracking in GA4?
Ecommerce tracking is a feature of Google Analytics 4 that tracks users’ shopping activity on your website. By default, GA4 keeps track of website metrics like pageviews, traffic sources, session duration, and bounce rates. It doesn’t automatically track ecommerce-specific data like revenue, cart abandonment rates, or conversion rates.
That’s where ecommerce events come in. Enabling ecommerce tracking in your GA4 works by enabling ecommerce events (more on that later).
Ecommerce events are online shopping activities that GA4 logs, and metrics refer to the data you see in various reports.
This is a must-have for every ambitious ecommerce marketing team because it allows you to
Spot products that convert more customers vs. underperforming products
Track how different marketing campaigns and channels influence revenue
Find friction points in the customer journey to increase your store’s conversion rate
See changes and trends in transactions and revenue over time
Unpack how your customers shop with Hotjar
Find out what visitors do on your site with GA4, and then use Hotjar to understand why some of them buy and others bounce.

Where can you find ecommerce insights in GA4?
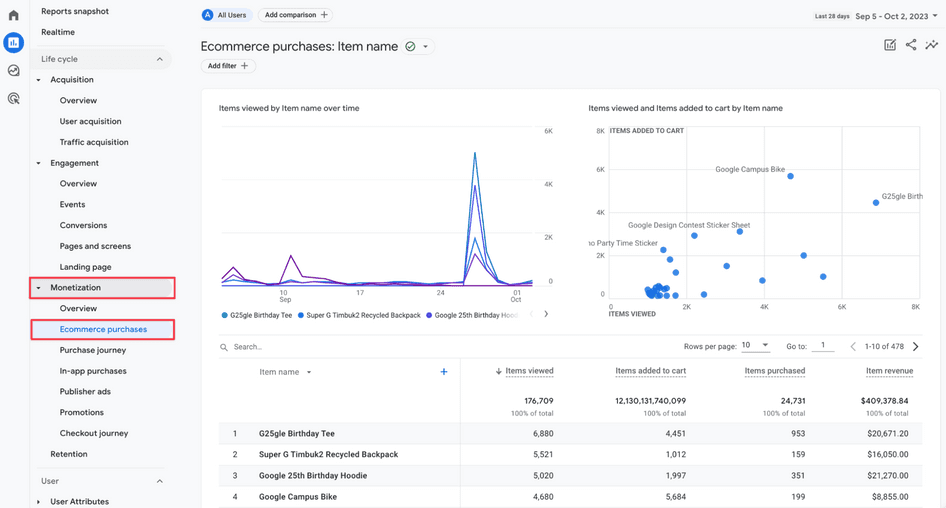
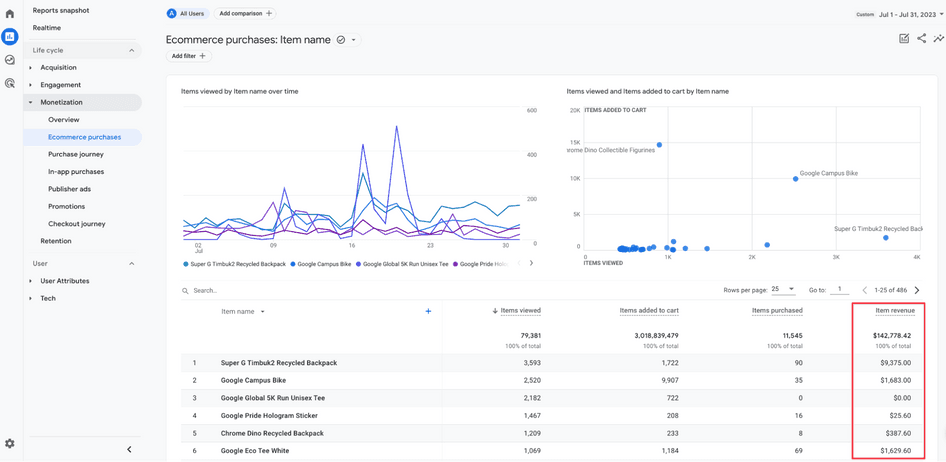
You’ll find ecommerce data in several places in your Google Analytics 4 interface. One of them is Reports > Monetization > Ecommerce purchases:
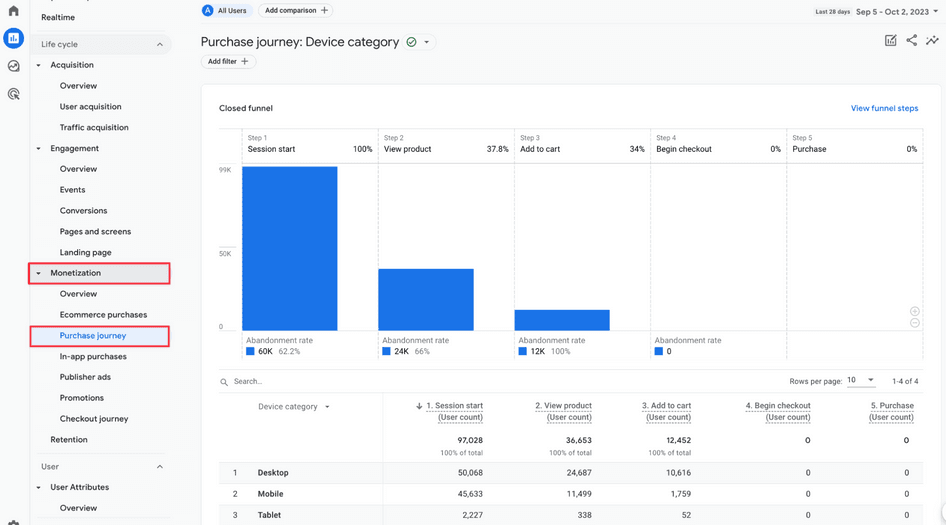
You can view how users progressed on your store from the moment they started their session, through viewing products and adding them to cart, to making a purchase in the Reports > Monetization > Purchase journey report:
Beyond the Monetization set of reports, you can view ecommerce data in many other reports that aren’t specific to ecommerce. Enabling ecommerce events lets you enrich various reports with ecommerce data.
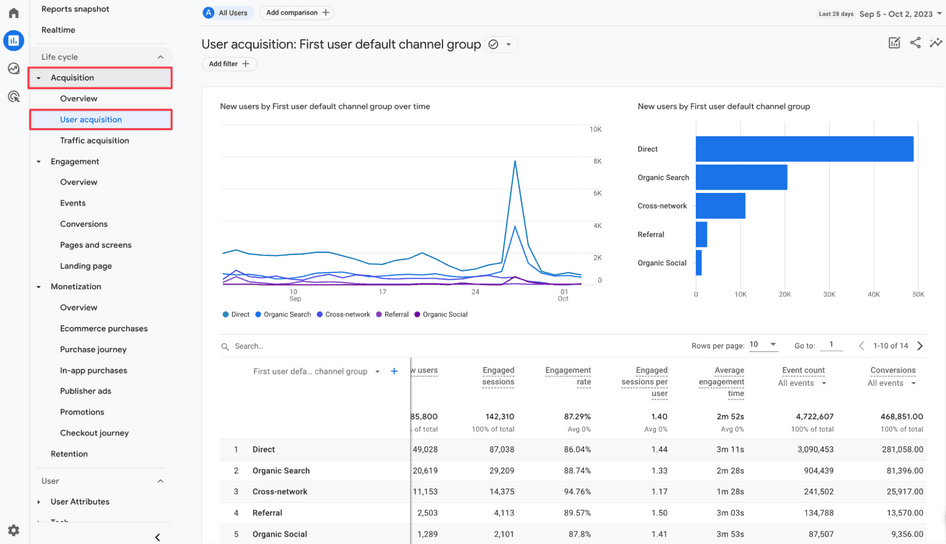
For example, you can view conversion rates and revenue for different user acquisition channels, along with standard website data like the number of new users and average engagement time. You’ll find this under Reports > Acquisition > User acquisition:
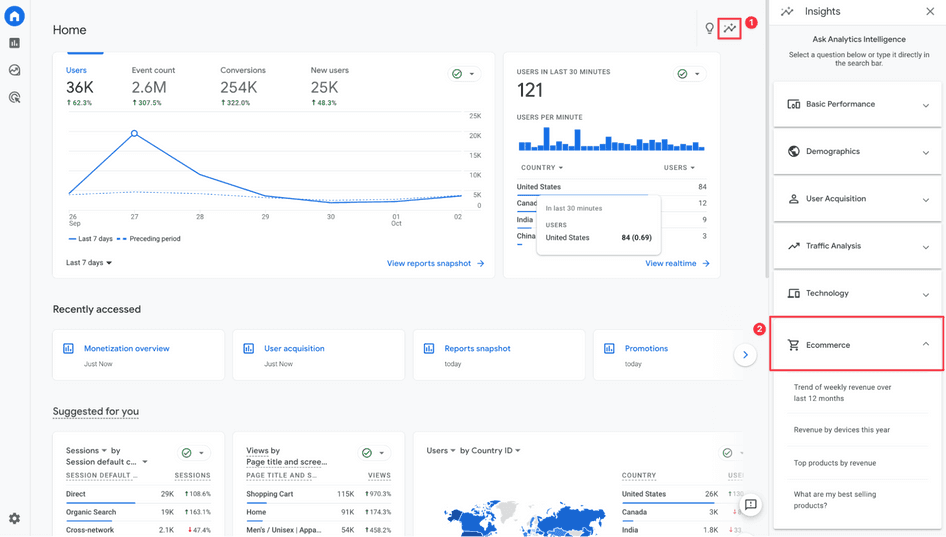
And on any screen of your GA4 interface, click the chart icon at the top right corner and select Ecommerce to quickly access high-level data like weekly revenue trends or best-selling products.
How to set up ecommerce tracking in GA4
The key to ecommerce tracking in GA4 is enabling ecommerce events. How you’ll do this depends on how your Google Analytics account is set up, including the way you migrated from Universal Analytics.
If you used Google Tag Manager to migrate to GA4, you’ll also use it to set up ecommerce events. Make sure you have access to Google Analytics and your website source code. Follow the steps in this GTM guide by Google to complete the setup.
In case you migrated to GA4 using Google tag (gtag.js), follow this Google tag guide to enable ecommerce event tracking.
Both of these guides give you specific configurations to track ecommerce events you deem important for your ecommerce reporting, like adding a product to cart or applying a promotion. Check out Google’s full list of recommended events, which includes descriptions, required and optional parameters, and example values for each event.
P.S. If your store runs on Shopify, make sure to check out GA4’s integration with Shopify.
What types of online shopping activities can you track in GA4?
You can track many different shopping-specific user actions in Google Analytics 4, which gives you plenty of context about your online store’s performance.
Key ecommerce actions you can track with GA4 include
Login and sign-up
Site search
Add to wishlist
Add to cart
Remove from cart
View cart
Begin checkout
Add payment info
Add shipping info
Purchase and refunds
By tracking these, you can finely tweak and customize ecommerce reports in your GA4 account for maximum insights.
Event-scoped metrics vs. item-scoped metrics in GA4
Google Analytics 4 tracks two types of ecommerce metrics: event-scoped and item-scoped.
The main difference is that an event-scoped metric counts the number of times an ecommerce event was triggered, while an item-scoped metric counts the number of defined interactions users had with a specific item.
Let’s say a customer adds three quantities of the same product to their cart. GA4 will log this as:
Add to carts, the event-scoped metric, will be one
Items added to cart, the item-scoped metric for that specific product, will be three
Knowing this information is crucial for reading ecommerce reports correctly.
8 ecommerce insights you need in GA4 for maximum success
Once you’re ecommerce set-up is in place in your GA4, here are the metrics and insights you need to monitor on a regular basis:
1. Product revenue
The Item revenue metric shows the total revenue you earned from individual product sales in a given period.
Find it in the Reports > Monetization > Ecommerce purchases report. Your list of products will be sorted by the number of times each item was viewed, but you can sort it by item revenue (descending or ascending) by hovering over the 'Item revenue' column title and clicking on the arrow.
This report shows you your biggest revenue makers as well as underperforming products, which can inform your future promotions and product updates.
2. Cart abandonment rate
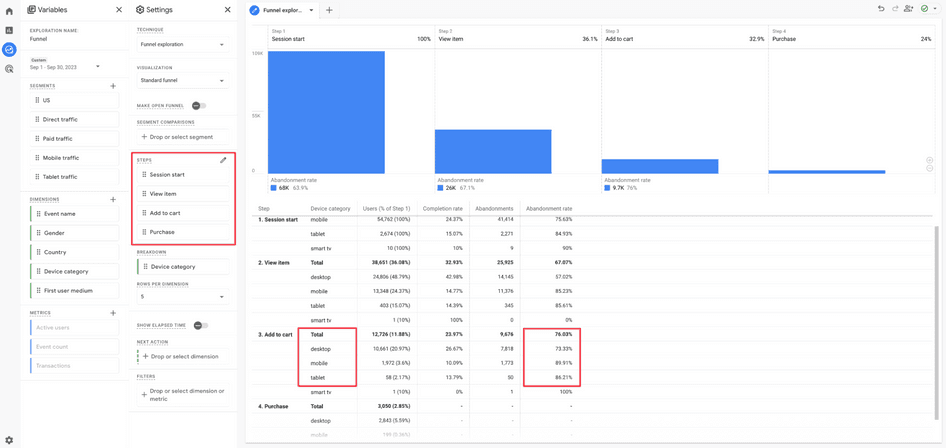
Check your store’s overall cart abandonment rate by building a funnel report in Explore > Funnel exploration. Use the settings on the left to tweak actions for your funnel steps.
Start by building a standard funnel with steps like 'Session start', 'View item', 'Add to cart', and 'Purchase'. The drop-off between the last two steps is your cart abandonment rate.
The table below the visualization further breaks down your cart abandonment rate into device categories—desktop, mobile, and tablet.
💡 Pro tip: use Hotjar Funnels to get even more granular about your sales funnel, how your visitors progress through it, and what stops them from converting.
With insights like the average time to convert and main points of friction, you can instantly jump into recordings of crucial moments of the journey, like the funnel steps where visitors struggle or drop off the most.
And thanks to granular filters, you can learn which segments, landing pages, traffic sources, and types of visitors convert best so you can focus your acquisition efforts there.
Hotjar Funnels setup
3. High- and low-converting traffic sources
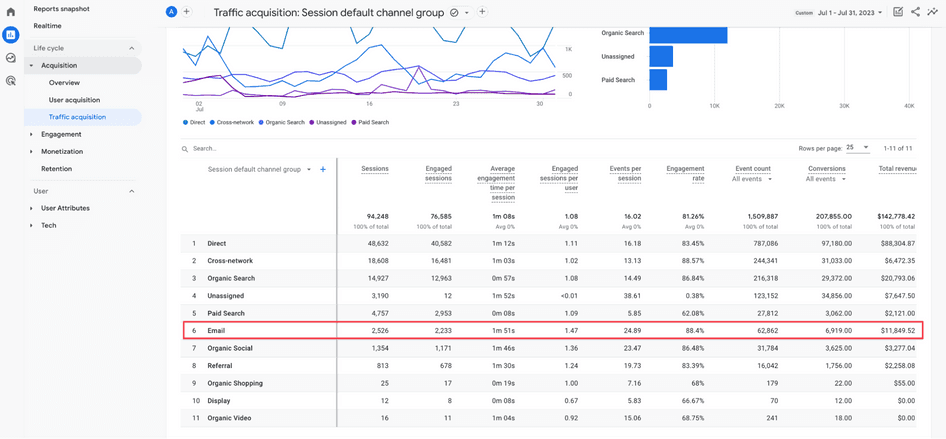
Head to Reports > Acquisition > Traffic acquisition to see which sources bring you the most traffic, engagement, repeat visitors, and revenue so you can use that information when planning future marketing campaigns and activities.
In the example below, email brings in the longest engagement per session. Organic search generates six times more traffic than email, but has less than double the revenue. In this case, email is a channel with a lot of untapped potential.
4. High- and low-converting landing pages
Where your visitors start their journey with you can make a tremendous difference in how their journey across your website unfolds.
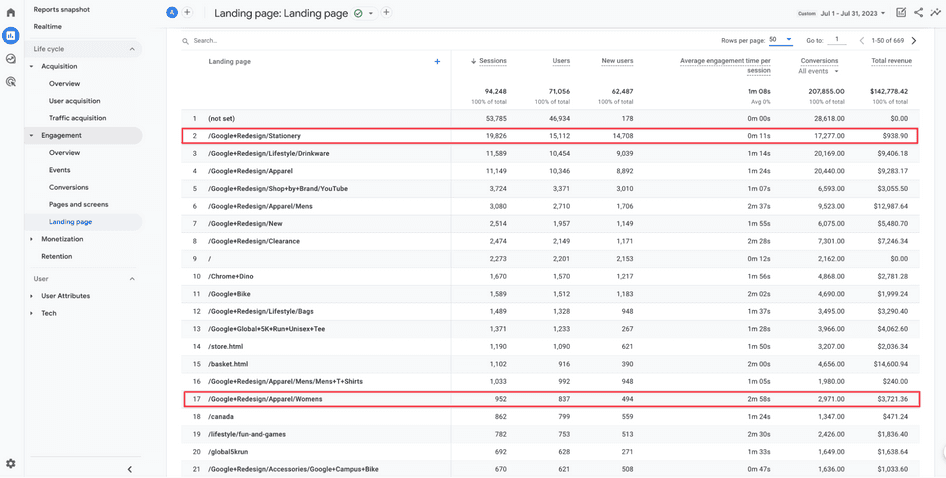
Look for clues in the Reports > Engagement > Landing page report, which lists landing pages based on the traffic they got in a specified period, along with useful data like session length, conversions, and revenue.
Take the example below. Both of these landing pages are product category pages. One of them kicked off 20 times more sessions than the other, but generated only a quarter of its revenue.
This is a clue that visitors are struggling or get confused when landing on that specific page—or that it doesn’t align with their expectations.
💡 Pro tip: you don’t need to read your visitors’ minds—you can survey them instead. Use Hotjar Surveys to deploy surveys on landing pages that GA4 metrics indicate as a potential bottleneck in your customer journey.
Not sure how to write a survey that makes an impact? With Hotjar, you just type your goal and let AI create the best survey for you, or use one of 40+ free templates to create one in seconds.
5. Traffic and conversions on different devices and browsers
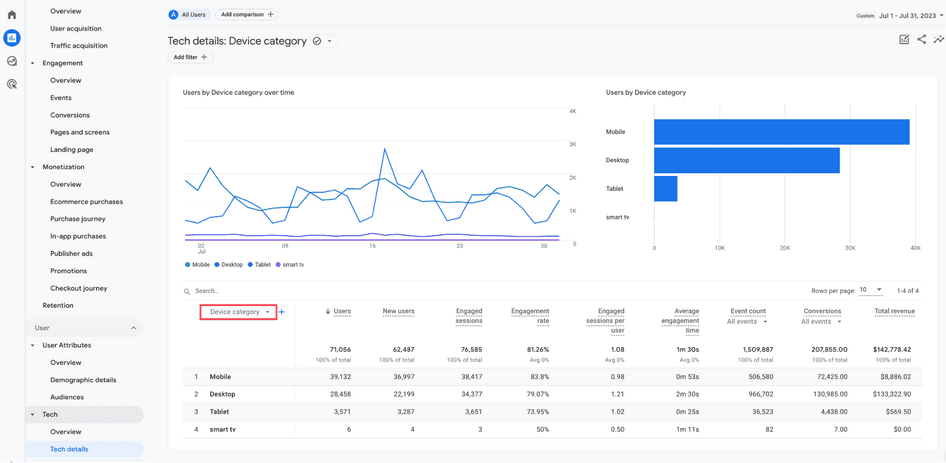
In Reports > Tech > Tech details, you’ll find metrics like users, engagement rates, conversions, and revenue based on the devices, browsers, screen resolutions, and operating systems your visitors use.
This report gives you context about the user experience on your website, like how many people use smartphones vs. desktops to browse your site and which device they’re more likely to convert on.
💡 Pro tip: if Google Analytics 4 uncovers a potential issue, like plenty of mobile traffic that doesn’t turn into signups or purchases, use Hotjar Recordings to see the exact experience your visitor had during that session. In the process, you might uncover a UX issue—like a button that doesn’t display properly or a broken link.
Folks at eShopWorld, an ecommerce management company, rely on the GA4 + Recordings combo to find what caused a conversion rate to drop.
“When I narrow down the issue to a specific device, browser, or version, I can go into Hotjar and look at the recordings. From here, I can see what our shoppers are doing in order to completely understand the point of friction,” explains Noelle Smith, eShopWorld’s conversion analyst.
An example of a Hotjar mobile recording
6. High- and low-performing campaigns
If you’re running dedicated marketing campaigns, you’re likely already using UTM parameters in your campaign-specific links. That makes it easy to jump into your GA4 reports to see the impact of these campaigns on your ecommerce results.
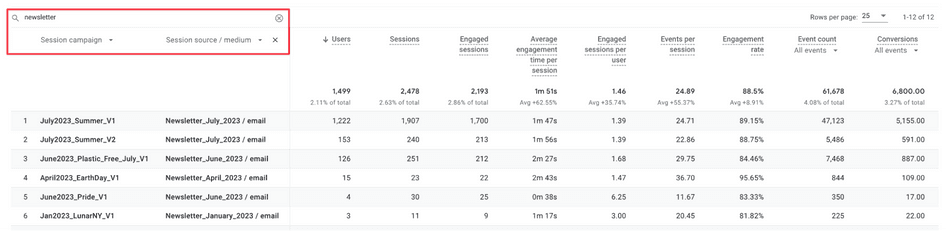
Head to Reports > Acquisition > Traffic acquisition where you’ll get quick access to campaign-specific data. At the top of the first column, select the Session campaign dimension. If you click the plus sign next to it, you can select Session source/medium to easily distinguish between channels.
In the search bar right above these dimensions, you can type in a common denominator if you want to directly compare campaigns of the same format or on the same channel, like email or newsletter.
7. Comparisons between segments
How do different visitor segments compare to each other? Think: age groups, countries, coupon code users, and loyalty tiers.
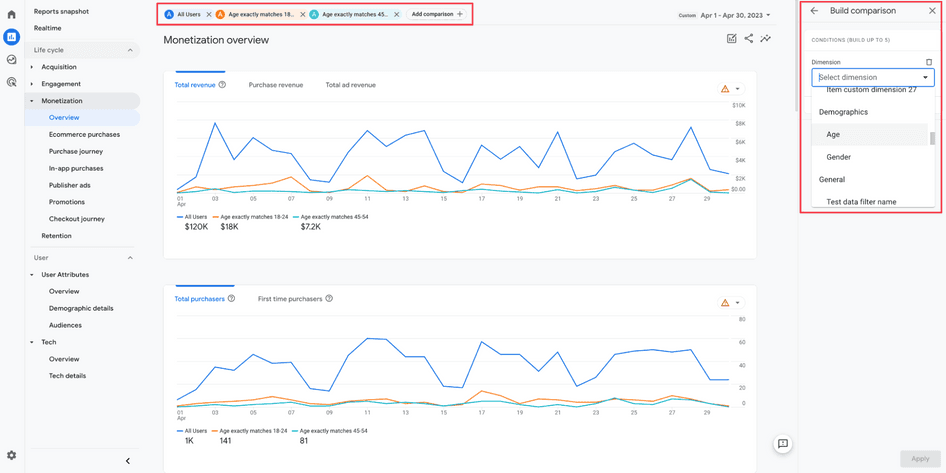
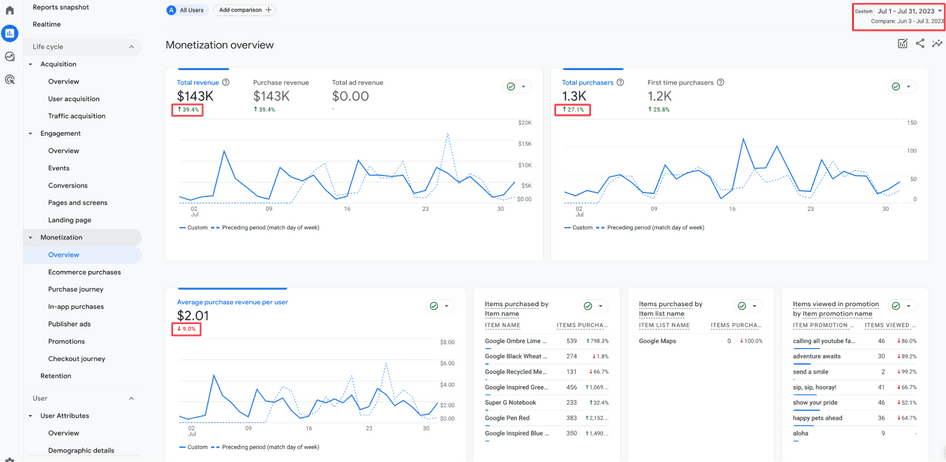
Go into any standard report (like the Reports > Monetization > Overview below) in GA4 and click the Add comparison button at the top. This opens a menu on the right-hand side that lets you define the conditions you want your user segment to match.
Use this to see how different groups interact with your ecommerce website, like how engaged they are, how much they spend, and what products they like most.
Layering segments on top of other reports we mentioned earlier, like campaigns, devices, and landing pages, helps you get better at tweaking your products, categories, and emails, so you can meet customer expectations—and improve their experience.
8. Comparisons over time
Finally, use ecommerce tracking in GA4 not only to learn what happened last month or quarter, but also how metrics like revenue, cart abandonment rate, and conversion rate change over time to gauge the current pulse of your online store, and track its progress over a longer period of time.
Find this option at the top right corner of your GA4 reports (below is the Reports > Monetization > Overview example) by clicking on the date range. Toggle on the Compare option next to the calendar and either choose from predefined periods, or custom select your own.
Win more customers with powerful ecommerce data
Tracking ecommerce events with GA4 is essential in understanding what users do while shopping on your online store. But that doesn’t paint the full picture—it only shows what happens, but not why it happens.
You need the context behind your visitors’ actions to make the right decisions, like UX improvements or product updates. Use qualitative insights from Hotjar to find out how your visitors feel about their shopping experience, what they struggle with, what they need more of, and why.
Unpack how your customers shop with Hotjar
Find out why some visitors buy and why others bounce so you can build a better shopping experience and win more customers.