Learn / Guides / GA glossary (A-Z)
How to track and analyze your sessions in Google Analytics 4
When visiting your ecommerce site, one person may spend over an hour loading up their cart. Another may open your homepage—and close it in less than three seconds.
Google Analytics 4 (GA4) calls both of these wildly different visits ‘sessions’. But to get the most mileage out of your data and learn where to focus your digital marketing efforts, you need to dive deeper into the types of sessions in GA4.
Summary
When businesses talk about monitoring their website metrics, sessions rank near the top of the list. Google Analytics 4 tracks three main session metrics:
But you can’t rely on GA4 for everything you want to know about sessions. To collect data about how people behave in sessions and why they make the choices they do, you need a product experience insights suite (such as Hotjar 👋) with tools like
What is a session in Google Analytics 4?
In Google Analytics 4, a session is an interval in which a user interacts with your website or web app. Say someone lands on your site, clicks a call-to-action (CTA) button, and closes the browser tab three minutes later to head to lunch. That distinct grouping of interactions counts as one session.
But it’s not quite that simple. While its predecessor, Universal Analytics (UA), only identified one type of session, Google Analytics 4 has three distinct session metrics:
Sessions
Engaged sessions
Engaged sessions per user
These data points give you different ways to understand and increase traffic to your website or web app, so it’s essential to understand what each term means.
Investigate your sessions today
Gather data on user sessions from GA4—then use Hotjar’s tools to uncover the full story and improve your product or website.

1. Sessions
A session is any period of interaction on your site by an individual user.
When someone lands on your website or opens your app in the foreground, GA4 automatically logs a session_start event (as long as they don’t already have an active session running).
For calculation purposes, GA4 also assigns each session
A session ID (ga_session_id): a timestamp of when your user started the session
A session number (ga_session_number): the session count for a particular user
The session ends when the user leaves your website—or automatically after 30 minutes of inactivity.
💡 Pro tip: you can adjust the default session timeout settings in a simple, three-step process.
Go to the Admin icon in the bottom left corner of GA4
Click on Data streams, and select your relevant site or web app
Select Configure tag settings > Adjust session timeout to extend or shorten this period
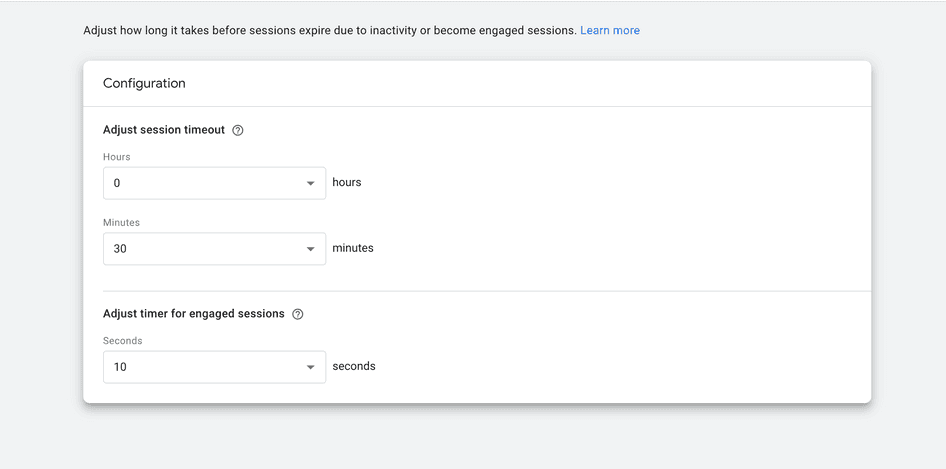
GA4 lets you customize your session timeout settings
Where to find sessions in GA4
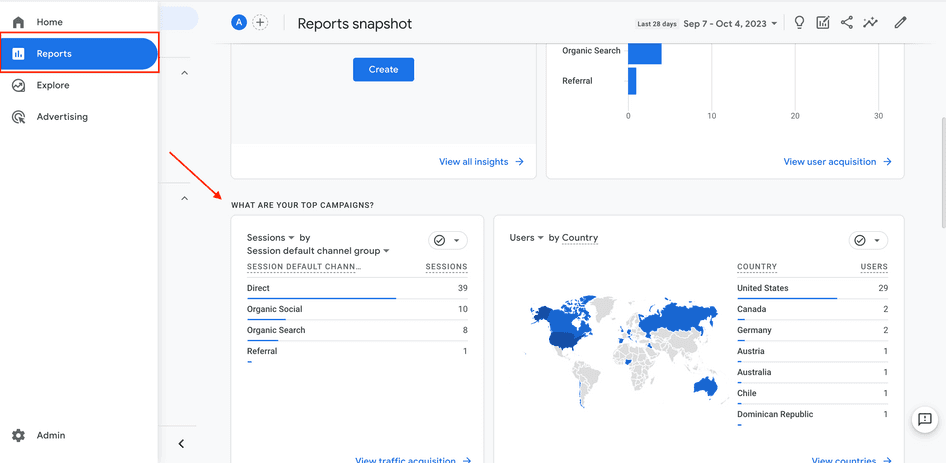
Sessions data is available in Reports > Reports snapshot. This page shows you the number of total sessions per default channel group, so you can evaluate how successful your campaigns are at driving traffic to your site or app.
For example, if you just launched a series of new social media ads, you could check this section to see if your organic social traffic has increased.
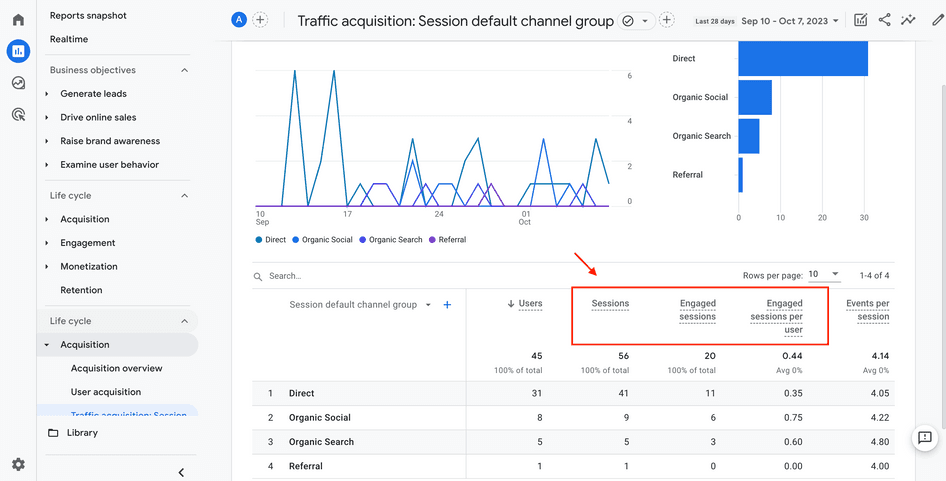
You can also see your sessions in the context of related data, like engaged sessions and engaged sessions per user (more on both of those later!) by heading to the Traffic acquisition report. You might discover that most sessions start with users entering your URL directly into the address bar—but that organic social click-throughs produce a higher rate of engaged sessions.
2. Engaged sessions
Unlike plain ol’ regular sessions, engaged sessions must meet certain criteria. An engaged session is one that lasts more than ten seconds, features a conversion event, or includes at least two pageviews or screenviews.
Say a user searches Google for ‘crochet kit for beginners’ and clicks on the first sponsored ad at the top of the page. If they purchase that crochet kit, that’s an engaged session. If they stay on the product page for a few seconds and then click on the Returns & Shipping page, that’s also considered an engaged session.
The engaged sessions metric is important because it shows how well your website or product resonates with your target user. If they find your content valuable, interesting, or helpful, you see more engaged sessions.
Where to find engaged sessions in GA4
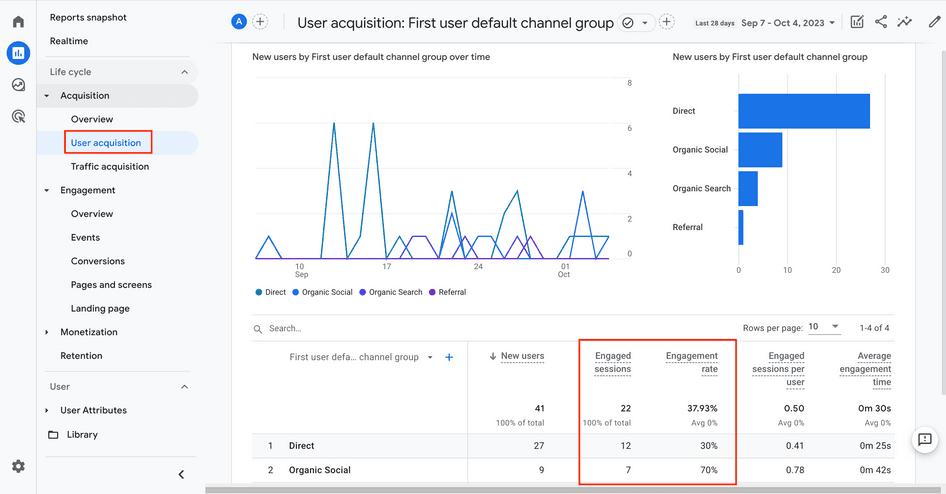
To learn about your engaged sessions, head to Acquisition > User acquisition.
Here, a chart breaks down your engaged sessions by channel group. These engaged sessions are the basis of how GA4 calculates your engagement rate. Engagement rate is the percentage of engaged sessions divided by the total number of sessions (or, simply ‘sessions’).
Keep an eye on engagement rates to learn how effective your website is for different visitors. For example, while most of your traffic might come from users who are aged 18-25, your engagement rate might be higher among visitors between the ages of 30-55—your target audience—indicating you need to do some search engine optimization (SEO), so your site attracts more of your ideal users.
3. Engaged sessions per user
Engaged sessions per user is the ratio of engaged sessions to the total number of users.
The engaged sessions per user metric contextualizes the engaged sessions metric and helps you measure the effectiveness of your site. For example, knowing you have 500 engaged sessions over the month doesn’t tell you much on its own. That figure could be extremely low for an international ecommerce site, but super high for a newly minted independent contractor.
With the engaged sessions per user metric, you can compare your website or app’s performance to your competitors in the same industry and easily chart trends in engagement patterns as your site gains more traffic.
Where to find engaged sessions per user in GA4
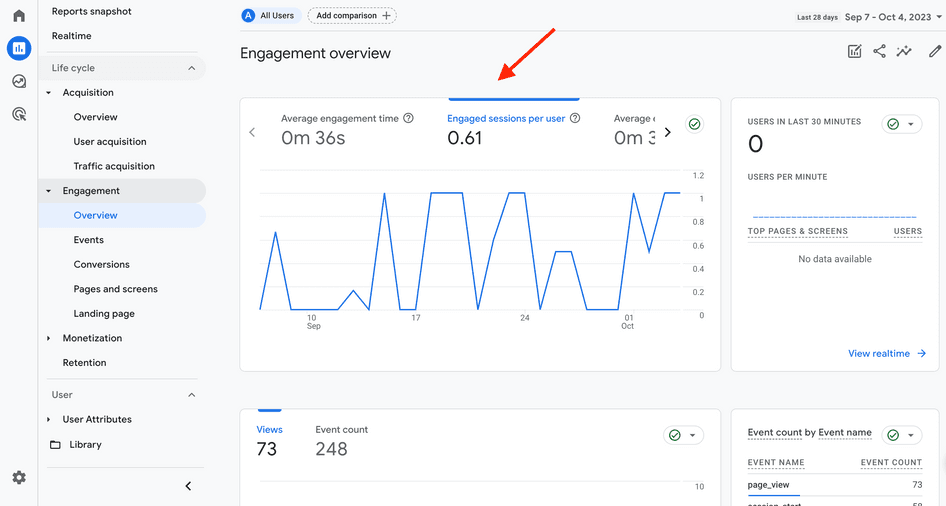
Engaged sessions per user sits directly to the right of its buddies ‘engaged sessions’ and ‘engagement rate’ in several GA4 reports, including the User acquisition and Traffic acquisition pages.
But this metric takes center stage on the Engagement overview page. Click on engaged sessions per user to see a line graph of this metric’s change over time. (By default, GA4 will show you the past 28 days. Change this by clicking on the date range on the upper right side of the screen.)
💡 Pro tip: monitor average session duration for your site or web app. This metric, calculated by dividing the total time of engaged sessions by the total sessions, helps you gauge people’s interest in your product, service, or brand.
GA4 doesn’t offer this metric by default, but it’s simple to add:
Click on Reports on the left side of the screen. Choose any report.
Click on the pencil icon on the upper right
Select Metrics, and a list of your current report metrics will appear
In the search bar at the bottom, start typing in ‘average session duration’ to quickly locate that option. Make sure to hit the blue ‘Apply’ button to make the change official!
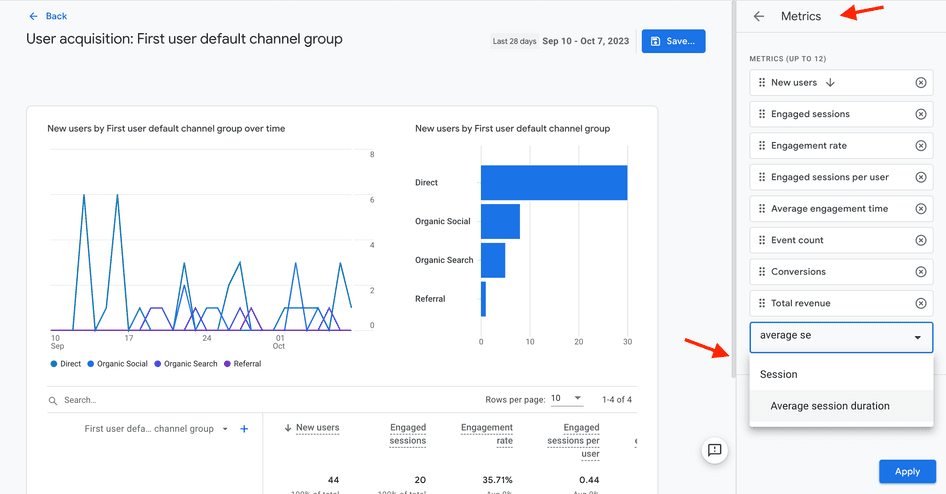
Click Reports > Pencil icon > Metrics to add average session duration (or other metrics) to your reports
Why you can’t rely on GA4 sessions alone (and how to get the data you need)
Once you dig into sessions in GA4, you’ll find you have many questions. That’s because Google Analytics tells you what’s happening on your site, but it can’t tell you why.
For example, GA4 might tell you that most of your sessions stem from organic search, but few engaged sessions do. Cue questions like: what is it about your site that’s causing your users to bounce? And how do you make your site more user-friendly so you have more engaged sessions per user in the future?
When you want to answer these questions—and balance quantitative and qualitative insights—you need to look outside of GA4. Luckily, a product experience insights suite like Hotjar integrates with Google Analytics to help you fill in the gaps about sessions. Here’s how.
1. Heatmaps
GA4 can tell you how many engaged sessions you have, but it can’t provide the nitty-gritty details about how users interact with your web pages.
Hotjar Heatmaps lets you visualize aggregate user behavior data. Plus, you can sort heatmaps by country, traffic source, and device type to see how specific segments behave during their sessions.
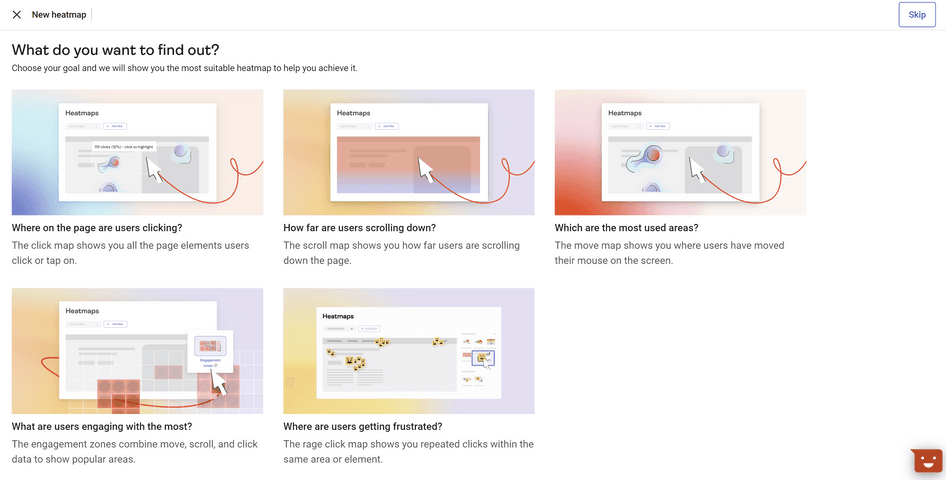
You can also view multiple types of heatmaps, depending on what kind of user behavior you’re most interested in:
Click maps show you where users click on the page
Scroll maps indicate how far they scroll
Move maps show where users move their mouse on the page
Engagement Zones maps indicate popular content and elements
Rage click maps show points of user frustration
By supplementing GA4 data with heatmaps, you see how people use your site—and how you can make customer-centric improvements to keep them coming back for more.
2. Recordings
GA4 notes that a session happened and tells you whether the user engaged during that session. But it’s one thing to see your numbers rise or fall in GA4, and another thing to actually watch the session itself unfold. 🤩
With Hotjar Recordings, you see a single session from the user’s perspective. You can watch as your user frantically clicks on a broken link or whizzes by a required form field in the checkout flow. You feel their frustration alongside them—and get seriously motivated to make changes to your site.
3. Surveys
Content marketers and product managers love to see an increase in engaged sessions in GA4—and shudder at the sight of a drop. But monitoring these numbers won’t tell you why your metrics have shifted.
One way to get this info—fast!—is through Hotjar Surveys. In seconds, you can create and launch a survey to ask your users for their opinions directly. Try one of two super speedy ways:
Start from a free template for common projects like an exit-intent survey, which asks users why they’re leaving, or a post-purchase survey, which asks users how satisfied they are after buying something on your site
Use Hotjar’s AI technology to let AI quickly write your questions based on your goals—then tweak and customize your survey so it looks and feels completely on-brand
Surveys let you gather additional data about a user’s session. Create them fast with Hotjar’s AI technology for surveys.
4. Funnels
Your users are on a journey from awareness of your brand to conversion and beyond. When GA4 registers an engaged session on your site, it captures one small but significant moment in your funnel.
Hotjar Funnels lets you map out and visualize all the steps to conversion so you can learn how they influence sales and why people leave your website. When you build a funnel, you filter each step by events that happen in the session. For example, your first step might include sessions where a user viewed your pricing page, and the next one might include sessions where they clicked the ‘Contact us’ button.
Then, you can view
Conversion rate and average time to convert for the entire funnel
Conversion rate and number of sessions for each stage in the funnel
If you want more insights into your conversion rate or drop-offs at any point, you just click through to see relevant recordings and heatmaps. Easy peasy!
Understand your sessions with GA4 + Hotjar 🤝
GA4 and Hotjar work together to give you the insights you need to understand users’ sessions on your site. With the quantitative session metrics GA4 supplies—and Hotjar’s behavioral and contextual data to help you fill in the gaps—you’ll develop a deep understanding of what users want from your site or web app, so you can give it to them.
Investigate your sessions today
Gather data on user sessions from GA4—then use Hotjar’s tools to uncover the full story and improve your product or website.