Learn / Guides / GA glossary (A-Z)
Exits and exit rate in Google Analytics
What are Google Analytics (GA) exits? What is an exit rate?
An ‘exit’, measured by exit rate, is the metric that captures the number of times visitors leave a website from a single webpage. Below, we explore the valuable information you can gain from looking at your site’s exits and exit rates.
Investigate your exit rates today
Get the insights you need to evaluate and improve your site’s exit rates with Hotjar.

Exits record the number of times site visitors leave a particular page on your site—in turn, calculating that page’s exit rate gives you the meaning behind its exit numbers. A page’s exit rate indicates how often visitors exit from it after visiting any number of pages on your site. As a percentage, exit rate is calculated as the number of exits / number of pageviews.
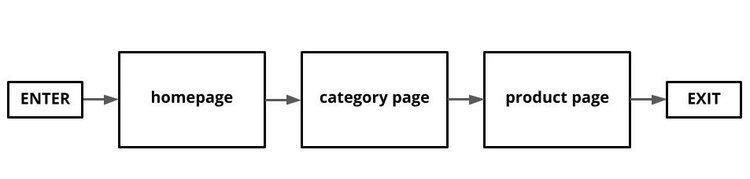
For example: a visitor lands on the homepage of an ecommerce site, navigates to a category page, then to a product page, and leaves. That’s considered an exit on the product page (i.e. the last page they visited). The overall exit rate for the product page is then calculated as the total number of exits / number of pageviews the product page received.
To see exits in GA, visit Explore → Blank (Create a new exploration) and enter the specific variables and tab settings you want to look at, in this case the number of Entrances (pageviews) and Exits for each page on your site.
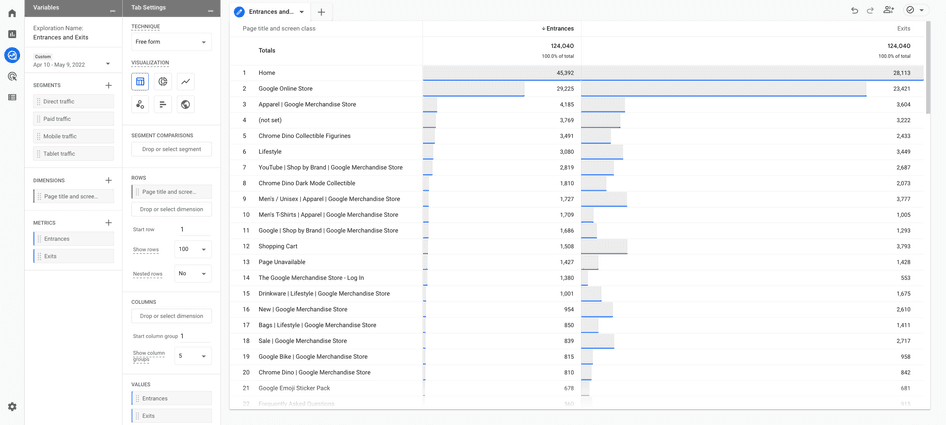
Calculate the exit rate for each page by dividing the number of Entrances by the number of Exits (Source: Google)
Why is it important to track Google Analytics exits?
Monitoring exits helps you understand the performance of specific webpages and/or page groups on your site. When you understand which page(s) people exit from the most, and at the highest percentage (i.e. the exit rate), then you know which pages might need improving.
Is a high exit rate always bad?
Obviously, people eventually have to leave a website, so the context of where and when this happens is important. For an ecommerce website, a high exit rate on a thank-you page isn’t something to worry about, because people have completed their action successfully and there’s little left for them to do but leave.
However, a high exit rate on the last step of a checkout process (for example: a payment page) could be a sign that something is wrong and needs investigating.
What’s the difference between exit rate and bounce rate in GA?
As metrics, exits and exit rates report on the action of a visitor leaving a page. Two other important metrics measured in GA, bounces and bounce rates, also report on people leaving—but only in a specific scenario. Let’s examine the different metrics exit rates vs. bounce rates measure.
First, a reminder: exits are recorded when people leave a page. The page’s exit rate indicates how often visitors exited from it after visiting any number of other pages on the site in the same session.
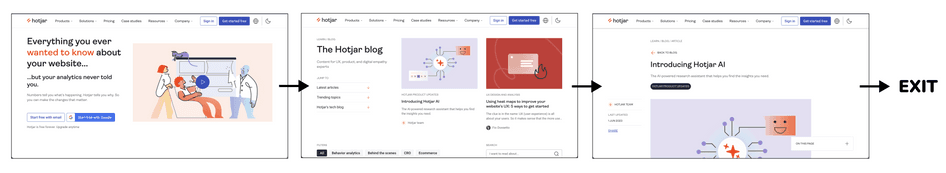
For example, if people visit the Hotjar homepage → the blog → a specific blog post and then leave from it, the exit is counted on the blog post page. The blog post’s exit rate is then calculated as the number of exits / number of pageviews to the page.
Bounces, on the other hand, measure the metrics of one-page visits by looking at the percentage of visitors who leave the first page they land on without taking any further action (such as clicking a link or navigating to a second page).
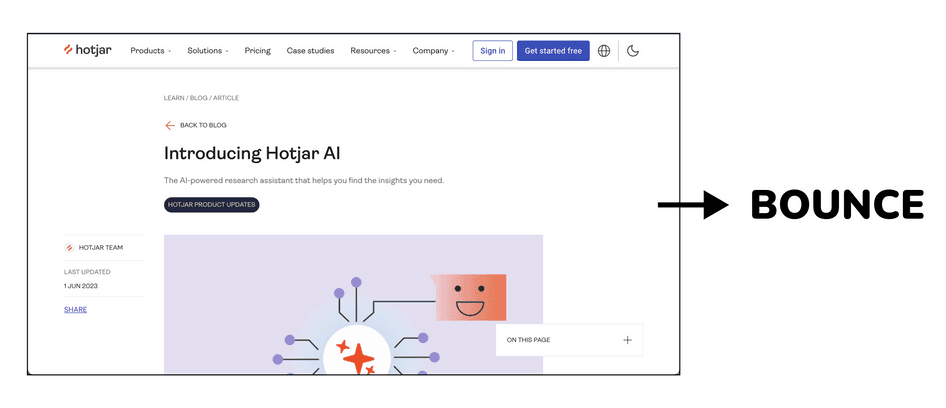
For example, a visitor who lands directly on the Hotjar blog post, reads it, and then leaves counts as a bounce. The bounce rate for the page is then calculated as the percentage of all sessions that started and ended on the page / all sessions that started on the page and continued towards more pages. Just as with exit rates, a high bounce rate isn’t necessarily bad, especially when evaluating single-page sites (e.g. a landing page for a brick-and-mortar shop).
Technically speaking, the bounce from the blog post is also an exit, in that the visitor did leave the website; but because the visitor exited on the same page they entered from without going anywhere else, GA records it as a bounce.
In short: all bounces are exits, but not all exits are bounces.
💡Pro tip: find out how to reduce higher bounce rates on your ecommerce site with our recommended tools and tips!
Investigate your exit rates today
Get the insights you need to evaluate and improve your site’s exit rates with Hotjar.
3 ways to investigate and reduce high exits and exit rates on your site
As a traditional web analytics tool, GA will show you that something is happening on your website exit rate-wise, but it won’t be able to address your next two questions:
Why is this happening?
How do I fix it?
To answer both, you need to collect additional context and information. Here, we cover three user behavior analytics and feedback tools that are immediately useful when investigating why exits happen and how to fix them: heatmaps, session recordings, and on-site surveys.
1. Heatmaps: find the most problematic section(s) on your high-exit pages
What: once you know that your visitors are leaving from a specific page, you’ll want to investigate what may or may not be working on the page itself.
How: as people visit the page and data gets collected, use a heatmap tool to start rendering the behavioral data points visually via scroll maps, which you can review to see how far down the page people scroll, and click maps, which show you what element(s) on the page people interact with:

Based on the evidence you accumulate, you might already be able to spot behavior patterns that explain high exit rates: maybe people are missing information that sits ‘below the fold’ on the page, or they could be frustrated after clicking on non-clickable elements, like an inactive call to action (CTA) button.
💡Pro tip: create your first heatmap with Hotjar! Identify what information visitors engage with or ignore by using our comprehensive Engagement Zones, which combines click, move, and scroll interaction data into one view. You can also uncover specific page elements that frustrate visitors with a rage click map.

Visualize visitor engagement on your site with Heatmaps tools like Engagement Zones
2. Session recordings: watch how people interact with a page during their journey
What: to get more context on visitor engagement, you’ll also want to review why users drop off at certain pages they encounter on their journey through your site.
How: with session recordings, you’ll be able to rewatch user sessions that end on high-exit drop-off pages so you can get a better sense of whether visitors:
See the site content correctly
Are distracted by intrusive pop-ups, visuals, or other content elements
Encounter bugs or issues on a specific page along their journey
Exhibit behaviors such as frequent u-turns or repeated rage clicks on a certain element
💡Pro tip: factor exit rates into your conversion rate optimization (CRO) strategy. Spot exactly where visitors drop off in the conversion funnel with Hotjar Funnels and understand the underlying reasons they leave with Recordings.
Identify where (and why) visitors leave your conversion funnel with Hotjar Funnels and Recordings
Examine the exit rates of different funnel page versions, so you can learn from your highest-converting flows and boost your site’s conversion rates.
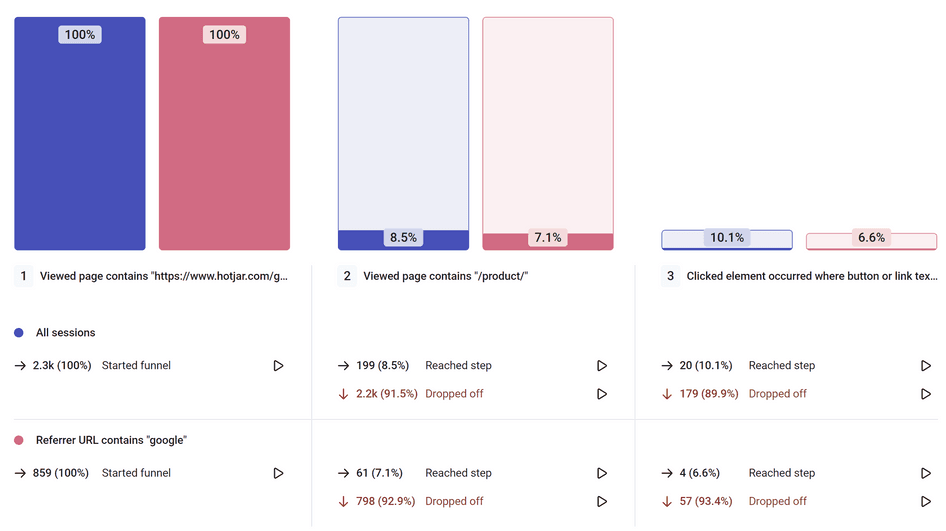
Use Funnels to compare Page A vs. Page B performance and see which version has a higher exit rate
3. On-site surveys: ask your visitors what’s not working on a page
What: using heatmaps and recordings may give you a few clear ideas of what’s happening when a visitor leaves a page, but instead of making assumptions, ask your users directly.
How: place an on-site survey on the page and set it to ask a specific question, such as:
What’s missing on this page?
What’s stopping you from continuing today?
What are you looking for that you can’t find?
You can ask both open and close-ended survey questions, depending on the information you want to gather. After you’ve collected some answers, analyze them to look for patterns or insight that might point you in the direction of a solution.
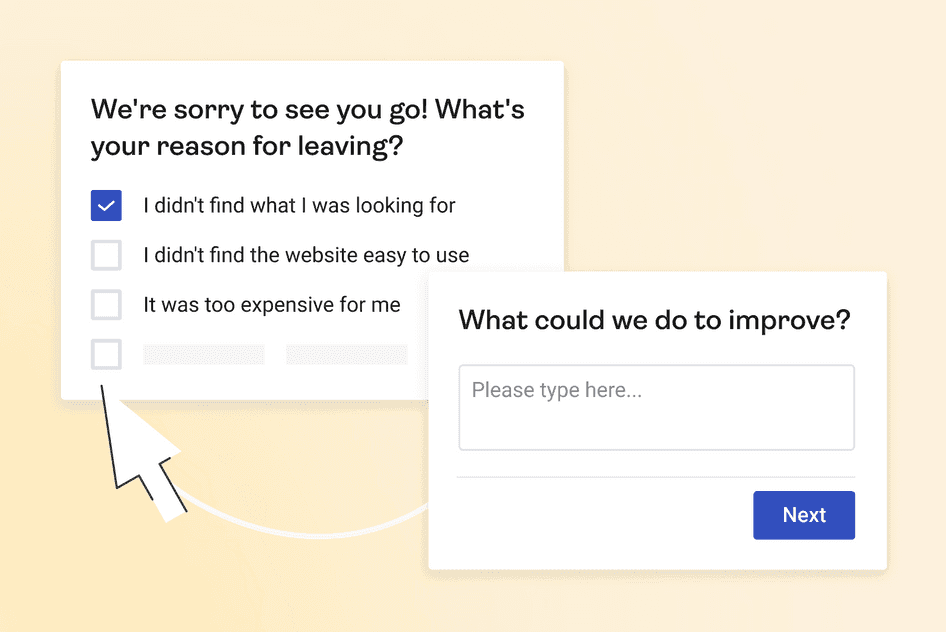
💡Pro tip: use Hotjar’s exit-intent survey and other churn/abandonment survey templates to ask visitors why they’re leaving before they do.

Use a cart abandonment survey to address high exit rates during a checkout process
Editor's note: in October 2020, Google launched Google Analytics 4, which includes changes to some GA reporting features. As more users migrate, we’ll release updates to this and other articles as needed, with references and steps to obtain results in GA4 (Google is phasing out Universal Analytics on July 1, 2023). This article was updated on June 9, 2023 to include information specific to GA4.
GA exit rate FAQs
Investigate your exit rates today
Get the insights you need to evaluate and improve your site’s exit rates with Hotjar.
Content credits: this content was originally created with the help of web analytics and CRO expert Rich Page, who was interviewed by our team and talked to us about all things GA in August 2019.