Learn / Guides / GA glossary (A-Z)
Google Analytics segments: the ultimate guide to user discovery
If you want to identify factors that lead to low conversion rates or know why some of your landing pages have a higher bounce rate than others, you need to understand why people are leaving in the first place. And to understand that, you’ve got to understand your users.
Who are these people? How did they find you? Are they new users, old customers, casual visitors, or first-time buyers? Are they on a mobile device or tablet? And most importantly: are they finding what they're looking for on your site?
Segments in Google Analytics 4 (GA4) give you all the information you need to discover who your users are and what drives them to convert.
Summary
Google Analytics 4 (GA4) segments let you filter website traffic data to focus on specific kinds of users. But to get the most out of GA4 segments, you also need to know what metrics like pageviews and demographics can’t tell you—with user behavior insights.
In this guide, learn why you should use segments in GA4, how to get started, and the tools you need to maximize your website and user insights.
Here’s what we cover:
What is a segment and the different types in GA4?: learn what segments are and how they work in GA4
How to set up segments in GA4: we walk you through how to use GA4’s segment builder, step by step
How to use Hotjar’s user behavior tools alongside GA4 segments: see how you can supplement segment insights with user behavior tools like heatmaps and surveys
Use Hotjar Heatmaps, Recordings, and Surveys alongside Google Analytics Segments to understand more about what users want.
What is a segment in GA4?
A GA4 segment is a subset of your web traffic and user data.
This means that Google Analytics users can apply segments to filter aggregate data and focus on particular groups of website visitors—for example, visitors from a certain country, visitors using mobile, or visitors who landed on your site from a specific search engine query.
For example, imagine you want to look at user activity by location, so you create segments to compare users in Europe and Asia. Now you can also track some fundamental user interactions, like
Clicks on buttons or outbound links
Form submissions
Video plays
Downloads
You might’ve been familiar with how segments worked in Universal Analytics (UA), which let you choose between pre-created segments (system segments) or create your own (custom segments). But ever since Google replaced UA with Google Analytics 4, there are different segments at your disposal.
What are the different types of segments in GA4?
GA4’s new segment builder lets you create different types of segments, both from suggested default segments and entirely on your own.
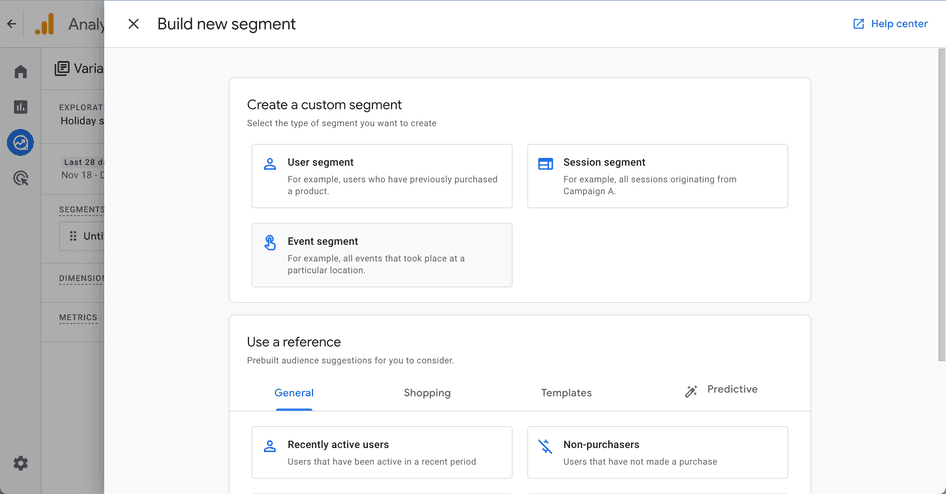
There are three main types of segments you can set up to break down your aggregate web traffic data:
User segments: this filters data by user criteria—for example, users who’ve added items to their shopping cart or those who’ve made purchases from your site before
Event segments: this filters data by different triggered events—for example, users browsing on various operating systems or email sign-ups from a specific date range
Session segments: this filters data by logged sessions—for example, by the date of a user’s first session or the number of sessions that occurred in a particular marketing funnel
You can also customize the conditions for each segment by selecting dimensions like geographic region or users who shop during a certain time of the day.
Benefits of using segments in GA4
Segments make Google Analytics reports more focused and useful by filtering aggregate data to give you specific information about the traffic in your reports.
It lets you delve into who your traffic is made up of, how users found you, and how different types of users behave when they visit your site, so you can make better choices about how to drive traffic, convert users, develop your product, and improve the customer experience with segmentation.
Here are three practical examples of how to use GA4 segments:
To understand why a section of your site is getting more user engagement, use segments to see who’s engaging with that section. You could then use that insight to optimize other parts of your site more for those visitors.
Segments let you see whether users found your site organically or came from a paid ad, which would tell you how useful your paid campaigns are, so you can decide whether to invest more in similar campaigns—or stop them altogether.
Build buyer personas for different demographic groups by segmenting traffic by age and gender, then build your site or product to appeal to their individual wants, needs, and preferences
You could also segment users who watched a video on a landing page to see if videos are helping your business, contrast the user behavior between Facebook and Twitter visitors to see which platform is best to advertise on, or look at ecommerce tracking data to see how people shop on your site.
For example, if you found that users from Europe make up only 3% of your traffic, you might decide to focus all your new content on US and Canadian users. If you saw that paid search users accounted for only 5% of your traffic but had high conversion rates, you could act on that insight by investing more in Google Ads campaigns.
How to set up segments in GA4
Log in to your Google Analytics account and follow the steps below to start using GA4’s segment builder.
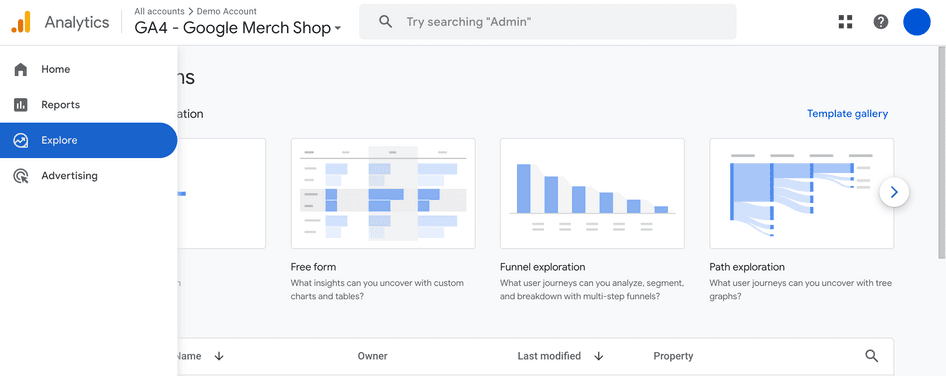
1. Go to ‘Explore’
From the GA4 dashboard, navigate to the ‘Explore’ tab on the left-hand sidebar.
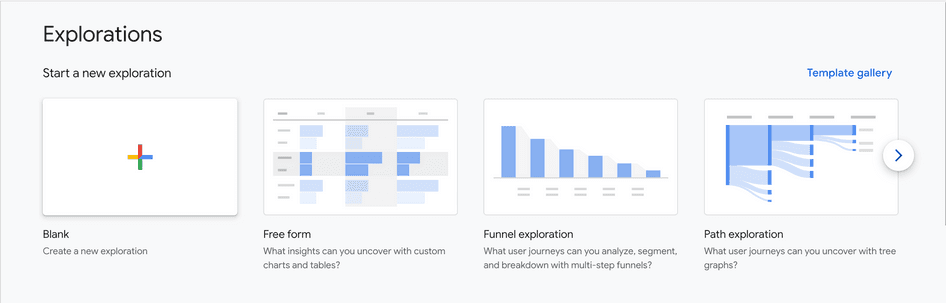
2. Create a segment in Explorations
To use the segment builder, create a new exploration or modify an existing one.
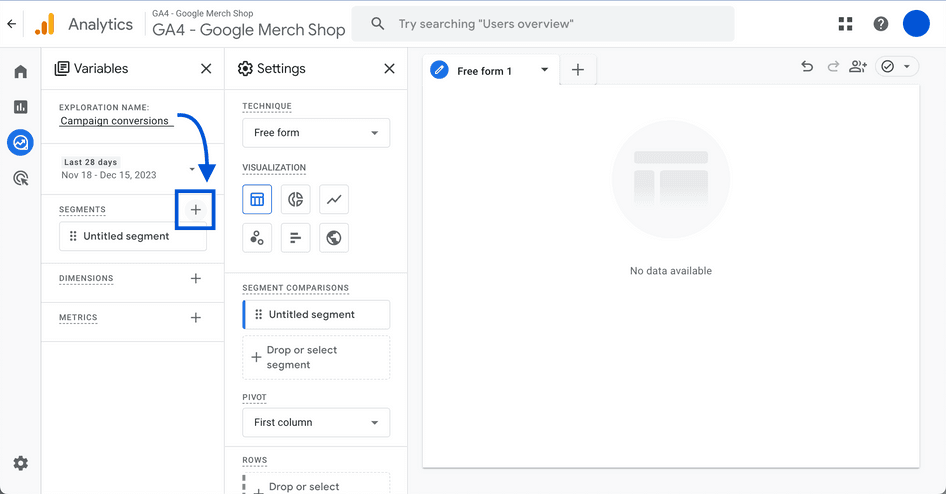
3. Name your exploration and add a segment
Give your exploration a descriptive name, then click the + symbol to create a new segment.
4. Build a new segment
You can opt for modifying one of the suggested default segments:
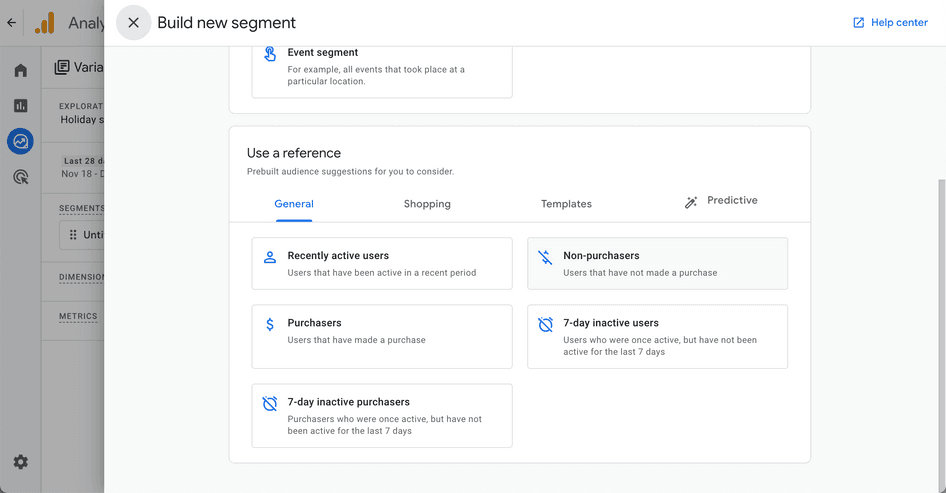
Or you can choose to create a custom segment from scratch:
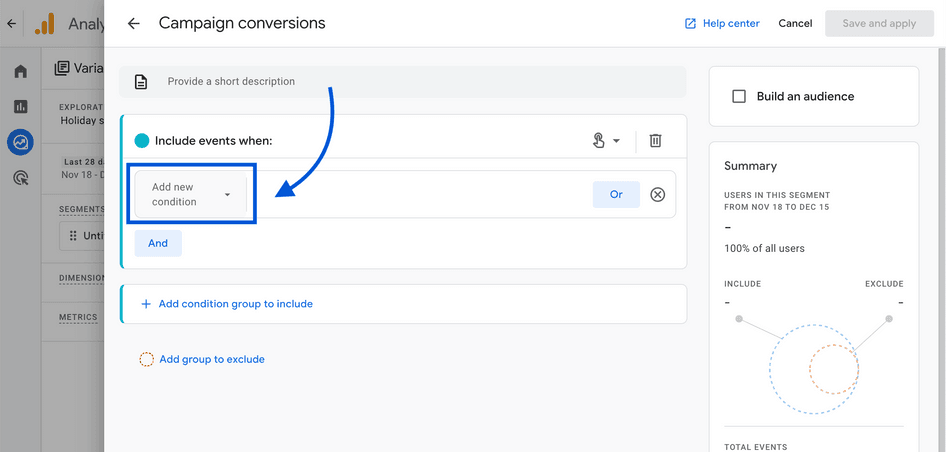
5. Add new condition
Click the ‘Add new condition’ drop-down menu to select your segment criteria.
Then, locate the criteria you want to segment, like sessions that started from a specific Google ad campaign.
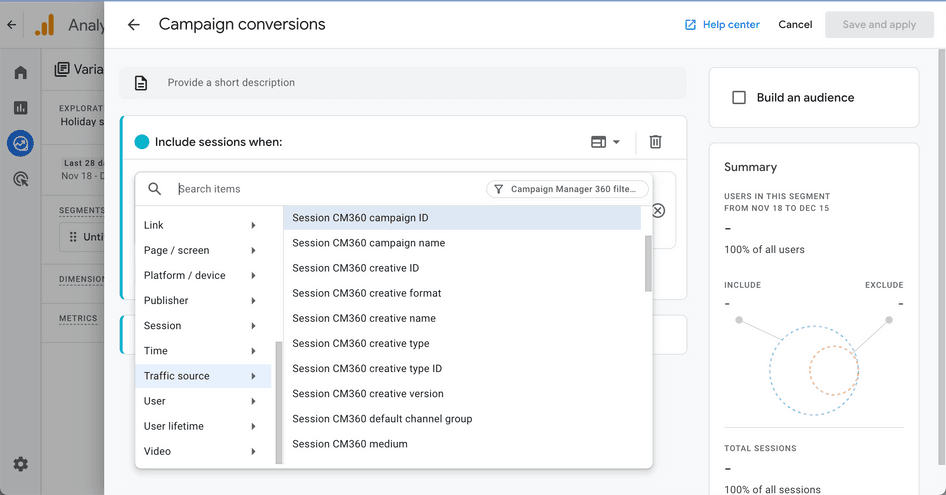
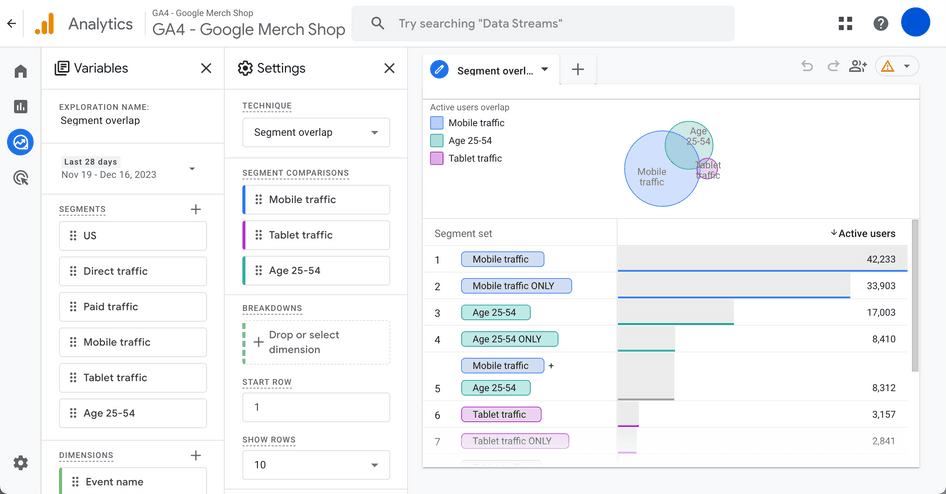
6. Add more conditions
Add more condition criteria to narrow down your segment subset data—for example, all users who converted from your Google ad campaign.
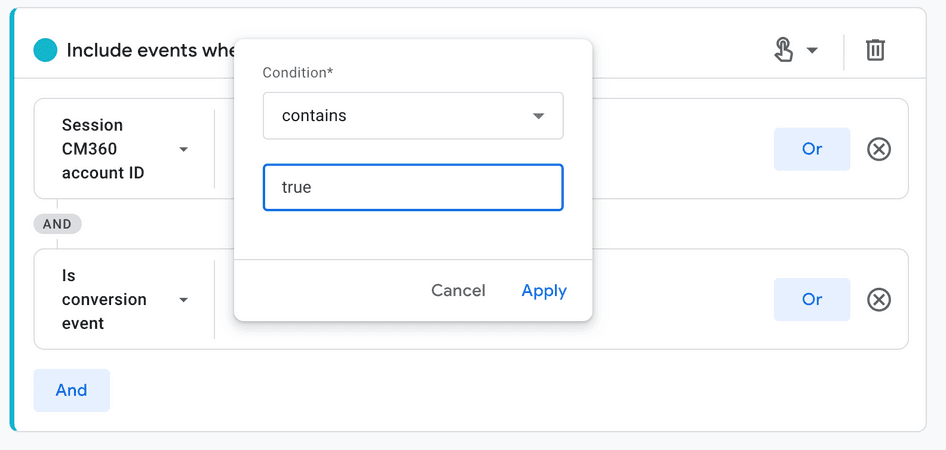
You can configure advanced segments by combining three different types of conditions
Dimension conditions: criteria like demographics, geographic region, or device
Metric conditions: predictive criteria like projected purchasing metrics
Event conditions: event details
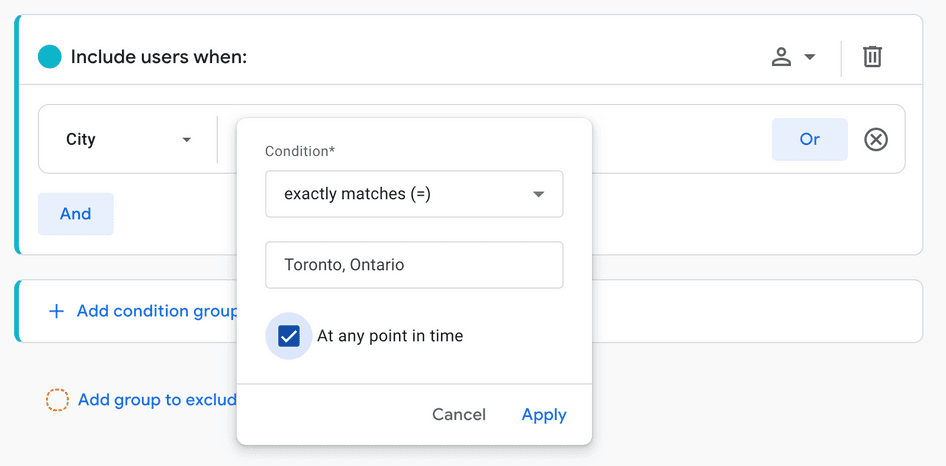
Keep in mind that you can include users who currently meet the criteria you selected or expand to users who have met the criteria at some point—just toggle the ‘At any point in time’ checkbox.
How to use user behavior tools alongside Google Analytics segments
Segmented quantitative data gives you information about your user groups, the pages they visit, and their actions—so GA4 segments are a good starting point, but they don’t tell you about your users’ intentions, opinions, or experiences.
To gain user experience (UX) insights, you need to conduct quantitative and qualitative user research. Take advantage of qualitative data that user behavior analytics tools (like Hotjar! 👋) offer: watch visitors use your site, visualize their journey, and ask them questions along the way.
Here’s a roundup of Hotjar’s user behavior and web analytics tools to help you contextualize the insights you uncover with GA4 segments. Our tools complement Google Analytics, so don’t think you need to choose between one or the other.
Use Hotjar Heatmaps, Recordings, and Surveys alongside Google Analytics Segments to understand more about what users want.
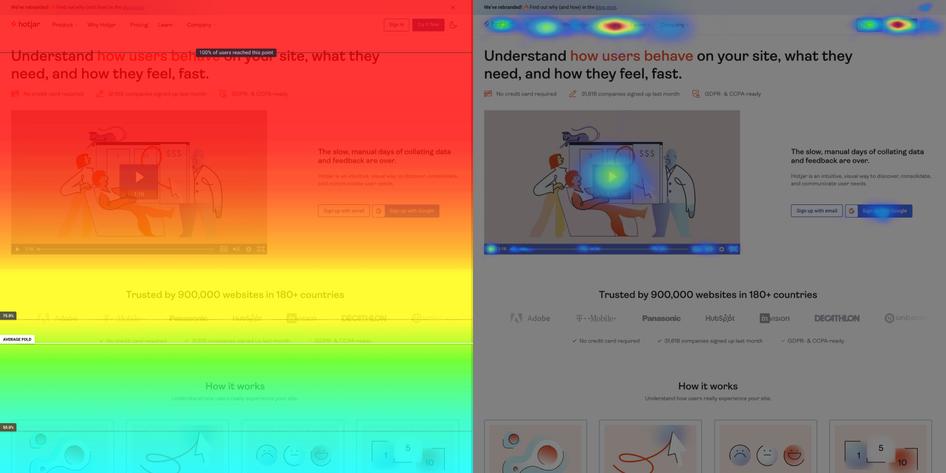
Heatmaps
GA4 segments give you insight into button clicks and other element interactions, but they don’t help you visualize how users scroll down a page or what areas attract their attention—that's what heatmaps do. You can filter Hotjar Heatmaps by device to uncover functionality issues and gain insight into how users experience your site whether they’re on a desktop, tablet, or mobile.
All three tools covered in this section have a variety of filters that let you segment the qualitative data you collect
Say you’re segmenting users by purchasers and non-purchasers and discover that users with a certain device or web browser aren’t completing purchases. You can use heatmaps to find out if these users are missing something while browsing—maybe mobile users stop scrolling and exit your site before seeing your call-to-action button at the bottom of the page, while a key element in the checkout flow is broken for Chrome browsers.
Surveys and Feedback
Hotjar Surveys are quick to build and give you actionable qualitative insight. Use them alongside your insights from Google Analytics to find out what users actually need.
For example, if segments tell you that male users under 25 aren’t using one of your features, and the bounce rate on a key landing page has gone up, you can embed a Hotjar Survey anywhere on the page to learn more about why users are leaving.
Or, let's say you’ve just created a new resource for returning users and want instant insight into their opinion of it. Set up a Feedback widget to ask, “How would you rate this resource?”, and then filter for negative feedback to start investigating why that segment is displeased. It’s a fast and efficient way to get the user insight you need to optimize your site and product.
First time running a survey? We’ve got the tools that’ll set you up for success.
GA4 segments tell you a lot about web traffic source data—but not everything. Use our traffic attribution survey template to account for digital sources like social media and analog sources like word-of-mouth referrals.
Or try AI for Surveys: just enter your research goal and watch AI generate a survey in seconds, then have it prepare an automated report that summarizes key findings, along with suggested next steps.
Recordings
Segments won’t show you how users behave throughout an entire session, but session recordings will. Use Hotjar Recordings to observe the complete user journey in a session—from entry to exit—and see where and why they got frustrated, what caught their eye, and what they responded to.

💡 Pro tip: Hotjar’s Google Analytics integration lets you connect quantitative and visual data for a more in-depth understanding of user behavior: once you’ve used GA4 to identify a segment you want to focus on, you can upload custom data into Hotjar to filter relevant recordings.
You can save any pre-defined filter combination as a segment and return to relevant recordings whenever you need in just a couple of clicks, which saves you time investigating recurring goals.
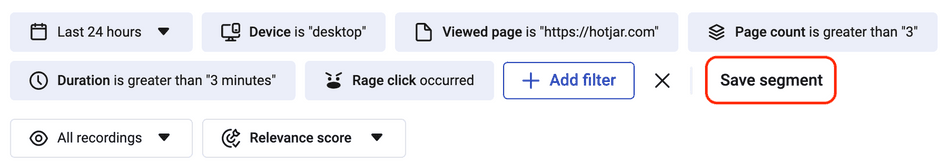
Save Hotjar Recordings filters as a segment
Discover more about your users
Google Analytics segments are fantastic for gaining quantitative insights about your site visitors. It’s easy to get started, experiment, and see user-focused information, so you can make key business decisions, fast.
But even with segment conditions in place, you can’t get into your users’ minds and see your website from their point of view. Hotjar's product experience insights and behavior analytics tools let you empathize with your users and connect Google Analytics data with people’s feelings and experiences.
Discover more about your users with Hotjar
Use Hotjar Heatmaps, Recordings, and Surveys alongside Google Analytics Segments to understand more about what users want.
