Learn / Guides / GA glossary (A-Z)
How to use exploration reports in Google Analytics 4
GA4 explorations give you powerful insights into your website and marketing efforts’ performance, helping you find opportunities for growth—but first, you need to know how to use them.
This guide explains what GA4 exploration reports are, when to use them to dig into your analytics data, and how to overcome GA’s limitations for a 360-degree view of user behavior on your website.
Summary
In GA4, ‘Explorations’ is a set of advanced discovery and comparison tools that help uncover insights into a website or ecommerce store’s performance.
There are seven main types of explorations in Google Analytics 4:
Creating a new exploration report in GA4: the templates above come with some data already added for you, but in some cases, it may be better to build one from scratch
Customizing GA4 explorations: different GA4 explorations share common customization options, but there are a few popular customizations you may need to use
What exploration reports won’t show you: a lack of visualization and qualitative data in exploration reports is easily fixed with additional product experience insights from tools like Heatmaps and Recordings
Explorations in Google Analytics
What are GA4 explorations?
In GA4, ‘Explorations’ is a set of advanced discovery and comparison tools that surface insights into a website or ecommerce store’s performance. Unlike other GA reports, explorations pull raw event and user-level data, making them more precise than other reporting options. Explorations go far beyond the reports previously available in the old version of GA, Universal Analytics (UA), and make it possible to
Build tables, charts, maps, or funnel paths to report on the data
Run cohort analyses for groups of users who share common attributes
Create and compare custom user segments
Understand lifetime user behavior
Drill down into individual, behavior-based user activities (e.g. users who engaged with your property on both app and website)
Save, share, and export data for use with other tools
There’s a bit of a learning curve, but once you’ve set up your favorite exploration views, you can save them and keep checking on your progress month after month.
Explore user behavior with Hotjar
Use Hotjar’s tools to see the user behavior behind your GA4 explorations and make data-backed optimizations for growth.

7 main types of explorations in Google Analytics 4
In GA4, different exploration views are known as ‘techniques’.
Select ‘Explore’ in the left-hand menu, then click ‘Template gallery’ to view all available exploration technique templates.
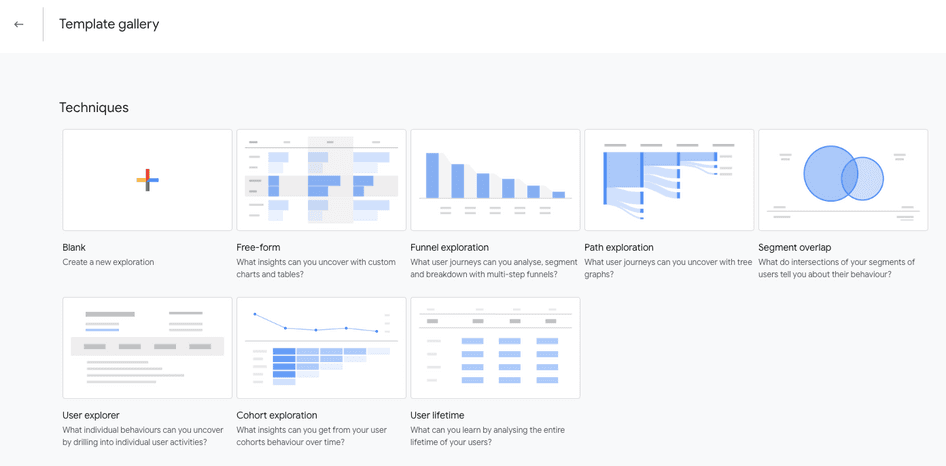
There are seven main techniques you can apply to your GA data. Here’s an overview of what each one is, and when to use them to get the most from your data.
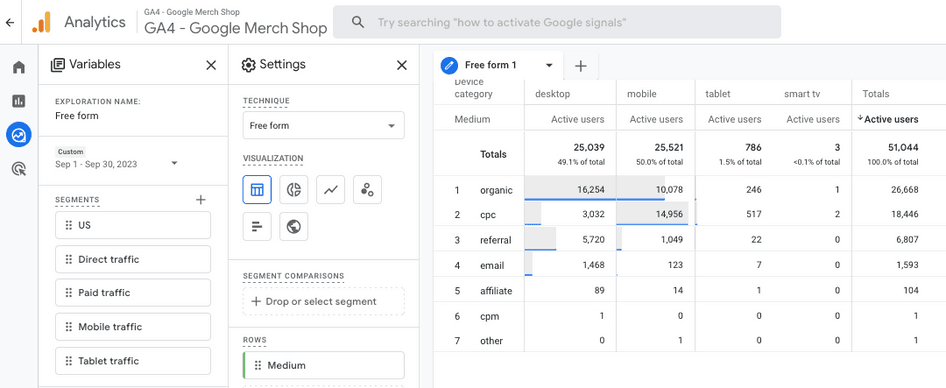
1. Free-form exploration
Free-form is the default exploration view and the closest in layout to traditional GA reports. Use it to
Visualize data as a table, donut chart, line chart, scatterplot, bar chart, or geo map
Arrange and sort columns and rows
Compare multiple metrics in one place
Spot and create customer segmentations
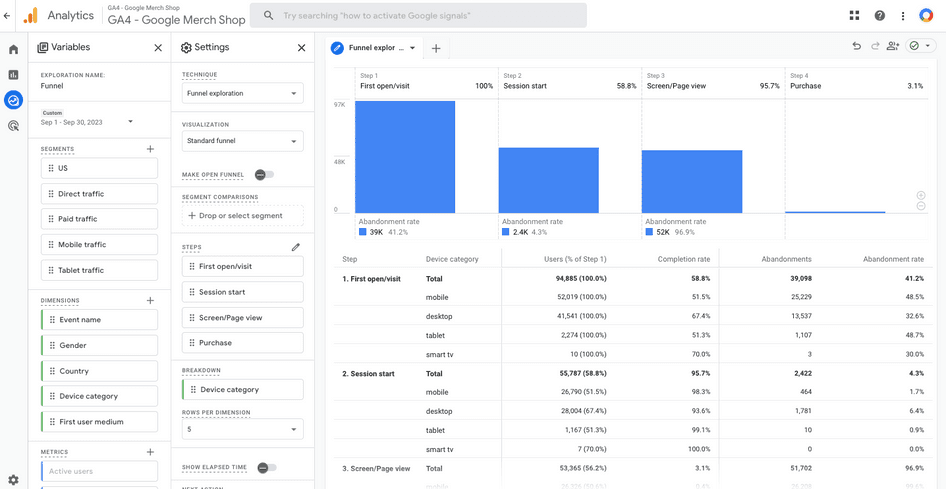
2. Funnel exploration
Funnel explorations show user drop-off between different steps in a conversion funnel. Use this technique to view the completion rate and abandonment rate for any goal. For example
Visualize where users drop off between first visit and purchase or sign-up
Compare the difference in drop-off rates between different segments (e.g. users on mobile vs. desktop, or paid vs. organic traffic)
💡 Pro tip: funnels show you where users drop off, but not why. Power up your funnel explorations by creating them in Hotjar Funnels.
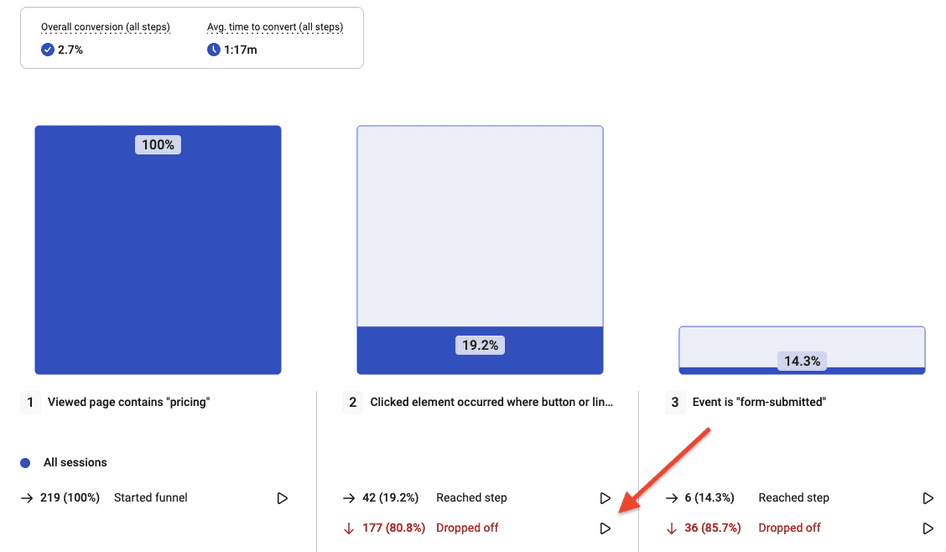
Click the play icon to view relevant session recordings of user behavior
Not only can you visualize and compare drop-off rates like in GA, but you can also click straight through to watch relevant session recordings that give you qualitative insight into what causes users to bounce or convert to the next step.
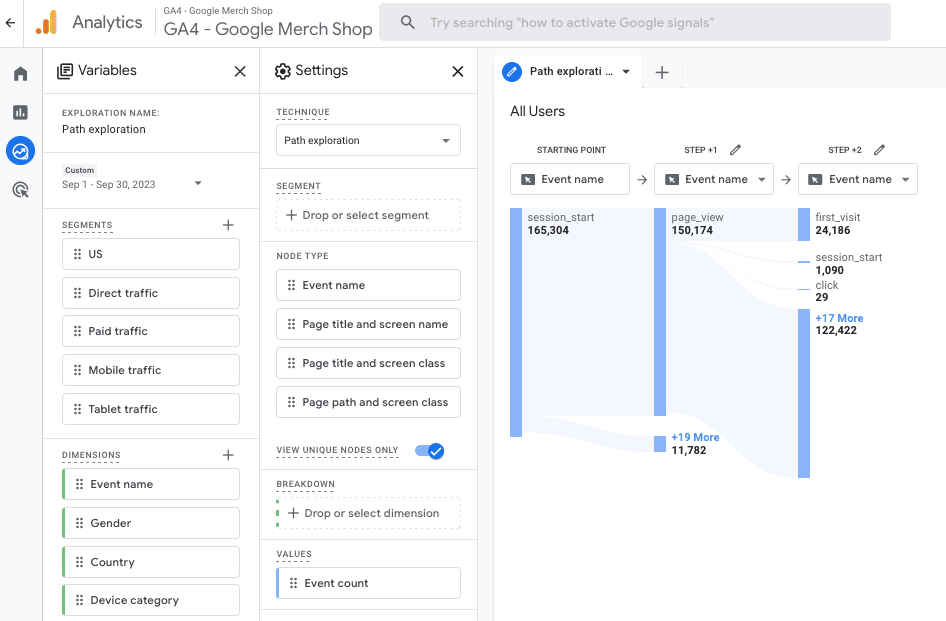
3. Path exploration
Path exploration shows the behavior flow of all users on your site. Use it to
Visualize where users go after starting a session
Create funnels by viewing common forward or backward paths
Find loops where users get stuck between pages
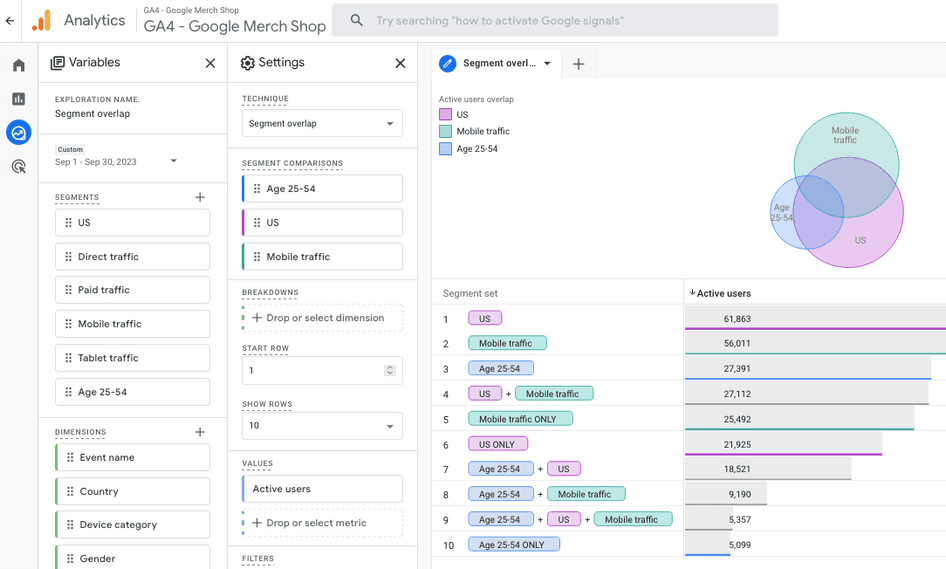
4. Segment overlap
The segment overlap exploration compares up to three user segments (e.g. cart abandoners, users in the US, or organic visitors) to see how they overlap and relate to each other. This helps you
Visualize the performance of different segment combinations
Identify and create new segments to add to other GA reports
Research or validate user persona characteristics
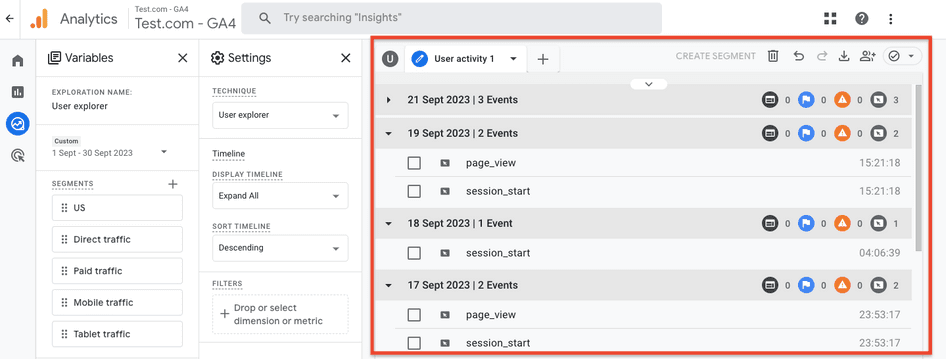
5. User explorer
The user exploration displays individual user activity. Use it to
Expand the user journey of an individual customer, e.g. one with a high average order value
Troubleshoot a specific user flow
Investigate the browsing activity of users in any segment
Measure a user’s activity across different browsers and devices
💡Pro tip: viewing user browsing activity as a timeline in GA4 might be helpful. But if you truly want to put yourself in your customers’ shoes, lines of event data are nowhere near as impactful as seeing how real people use your site.
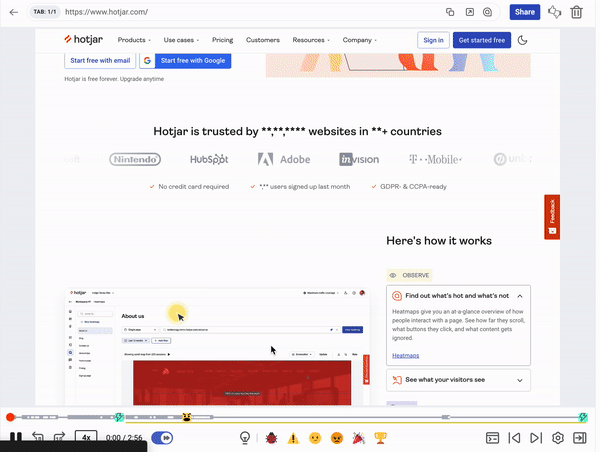
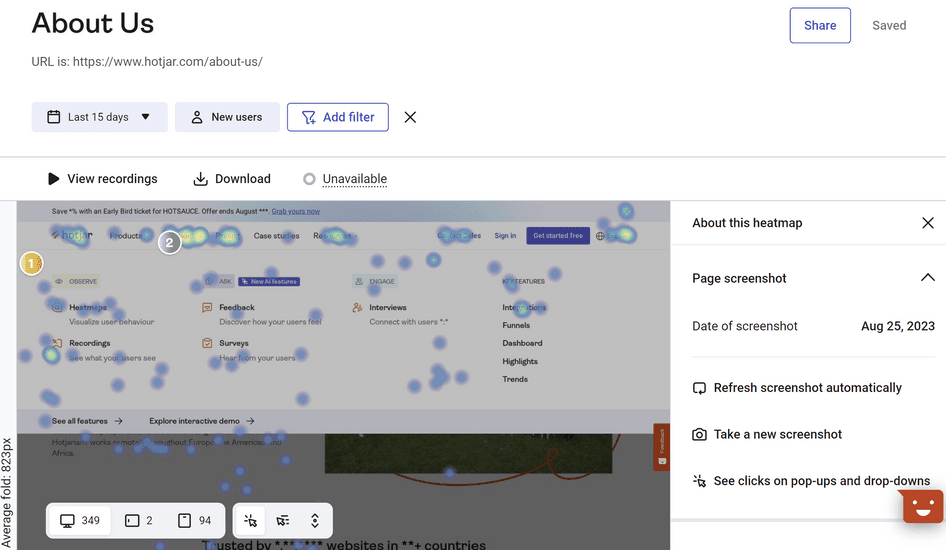
A session recording of a user browsing the Hotjar homepage, captured using Hotjar Recordings
Use a session recording tool like Hotjar Recordings to see the real actions users take on your website—what they click, where they scroll, and how they navigate between pages. You’ll find it that much easier to empathize with users as people, not lists of event triggers.
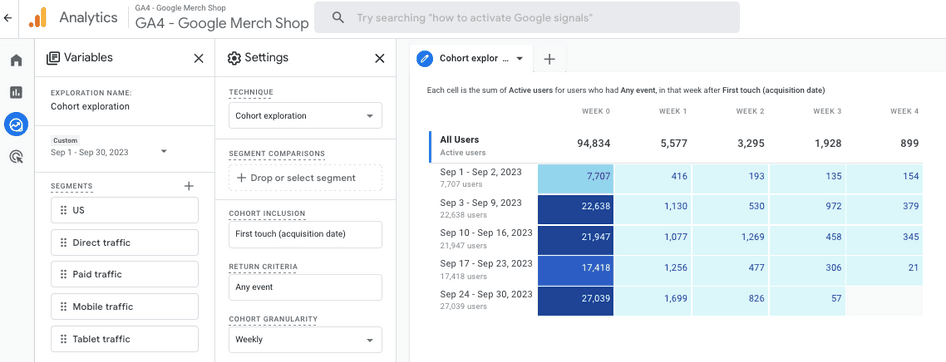
6. Cohort exploration
Cohort explorations show the performance of a group of users with common behavior or characteristics. Use cases include
Viewing retention or churn over time
Tracking the performance of behavior and engagement metrics based on user acquisition date
Comparing the performance of users exposed to a specific content piece vs. those who didn’t see it
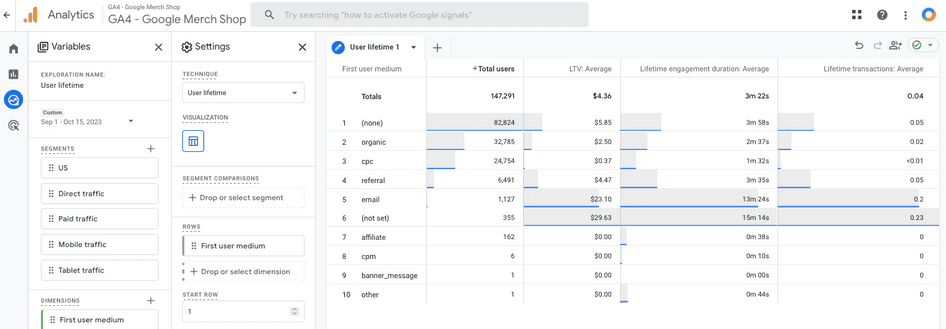
7. User lifetime
The user lifetime exploration represents how users behave during their lifetime as customers. Use it to
View customer lifetime value (LTV) for users acquired via different sources, mediums, and campaigns
Project predicted churn and purchase probability for different acquisition channels
Compare first, most recent, and lifetime user actions
How to create a new exploration report in GA4
When you use the above templates to create explorations in GA4, they’ll come with some data added for you. In some cases, you may want to build one from scratch to create something simple or recreate a report you used to rely on in UA. Here’s how to do it.
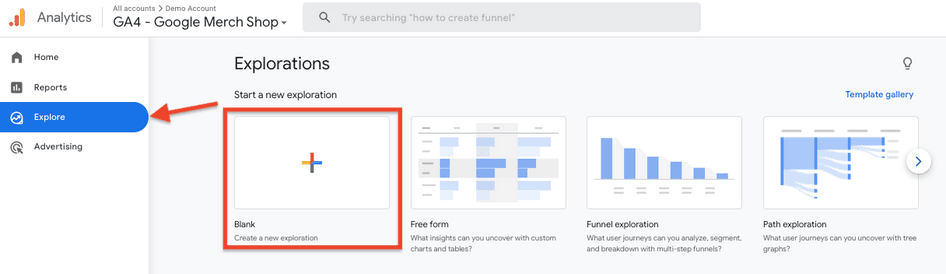
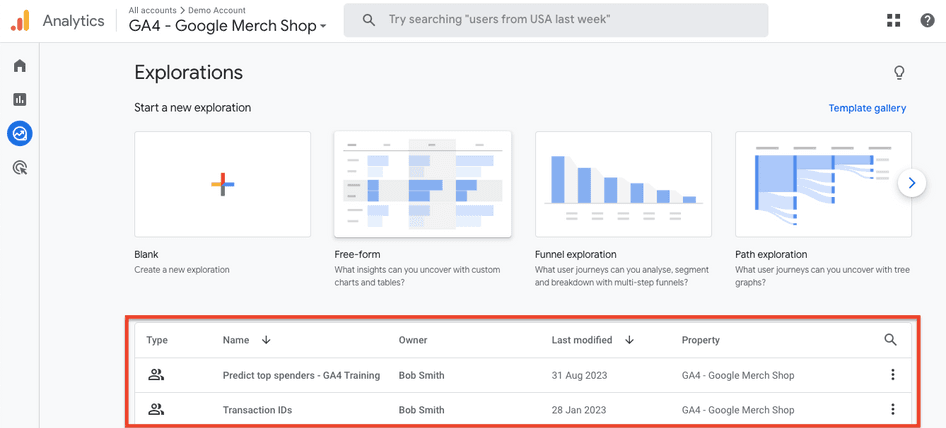
Click ‘Explore’ in the left-hand menu, then ‘Blank’ to create a new exploration.
You’ll see a blank canvas, like this:
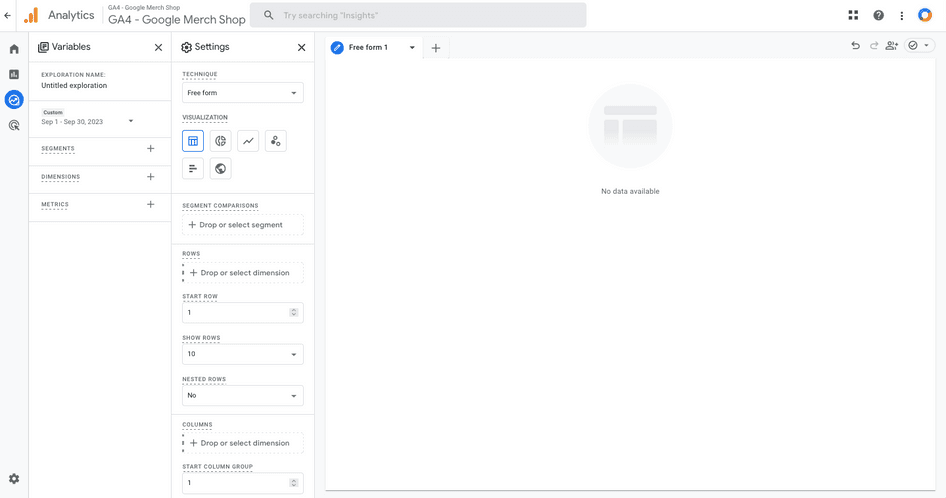
The default exploration type is ‘free form’—you can switch between different exploration types using the technique dropdown in the ‘Settings’ panel.
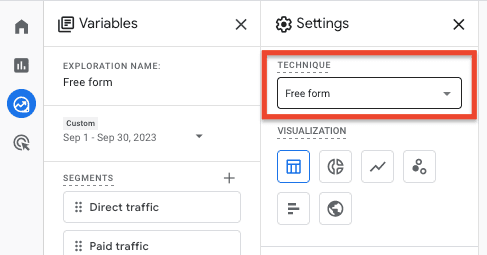
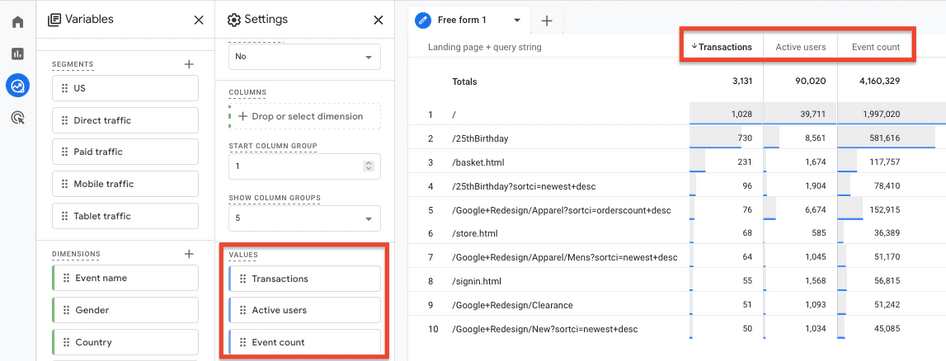
Start in the ‘Variables’ panel on the left. Select a timeframe and click the plus icons to add
Segments (optional): subsets of your total website traffic by user, event, or session. Examples of segments include cart abandoners, purchasers, users in the US, and organic visitors.
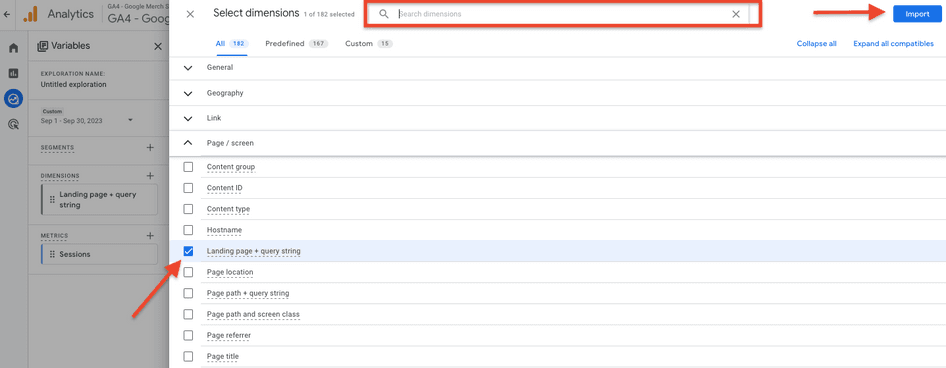
Dimensions: attributes that describe a segment, e.g. medium, source, country, and landing page
Metrics: quantitative measurements, e.g. sessions, bounce rate, Google Ads clicks, and conversions
Use the search bar or scroll down the list to find what you need, then select the item and click ‘Import’ to add it to your exploration.
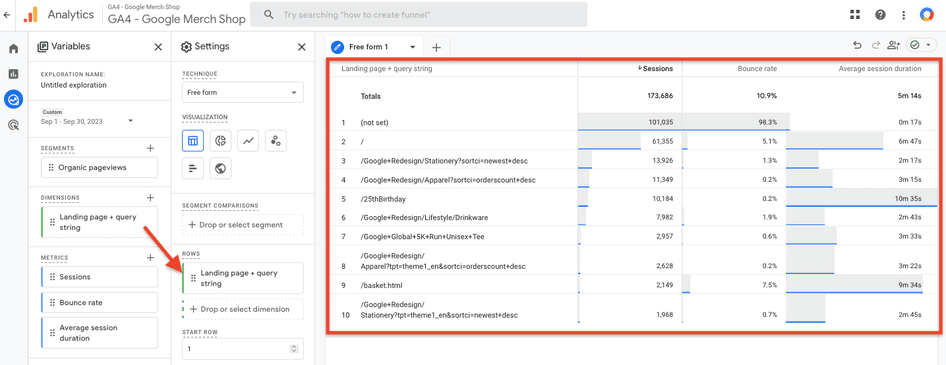
Nothing will display until you add dimensions and metrics from the ‘Variables’ panel to the ‘Settings’ panel—do this by double-clicking or dragging them across.
And that’s it! Once you’ve built an exploration report you like, give it a name (edit the text under ‘Exploration name’ in the ‘Variables’ panel), and it will be accessible via the main Explore menu.
How to customize GA4 explorations
Different GA4 explorations share common customization options. Here are some popular customizations you may need to use.
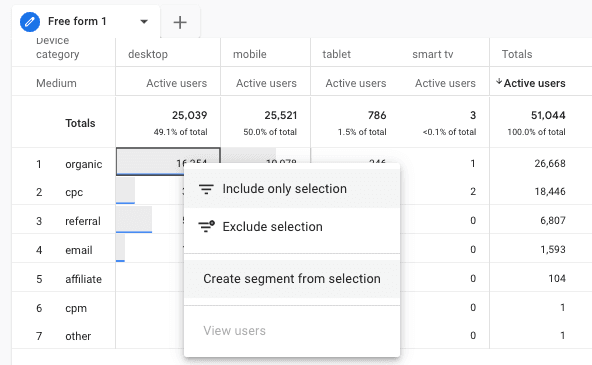
Right-click to create new segments
Right-click on any cell or chart area and select ‘Create segment from selection’ to add a custom segment from the selected cohort.
Modify the appearance of exploration tables
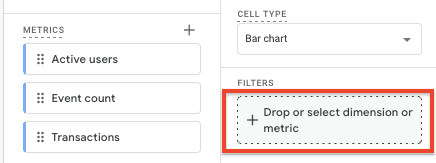
You can change the way tables are stylized in the ‘Settings’ panel using the ‘Cell type’ dropdown. There are three cell type visualizations to choose from: bar chart, plain text, and heat map.
Arrange and order columns and rows
To rearrange columns and rows, drag the relevant values in the ‘Settings’ panel. To order columns, click the header to toggle between low to high and high to low.
Create filters
Add up to ten metrics or dimensions as filters. First, add them to the ‘Variables’ panel by clicking the plus icon in the ‘Metrics’ or ‘Dimension’ sections. Then, drag them over to the ‘Filters’ section at the bottom of the ‘Settings’ panel.
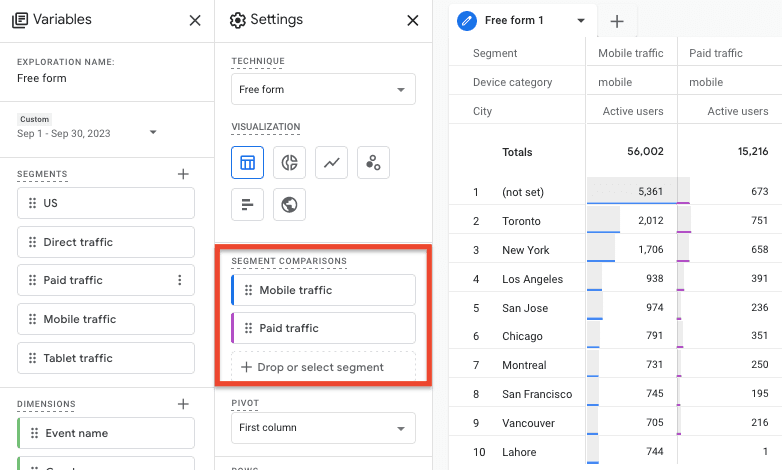
Compare segments
To compare segments, make sure they’re added to the ‘Variables’ panel by clicking the plus icon in the ‘Segments’ section. Then, drag them over to the ‘Segment comparisons’ section in the ‘Settings’ panel.
What exploration reports won’t show you (and how to fill in the gaps)
GA4 explorations give you flexible and advanced ways to make sense of how people use your website, but there are still some limitations to consider before putting all your analytics eggs into GA4’s basket.
Lack of visualizations
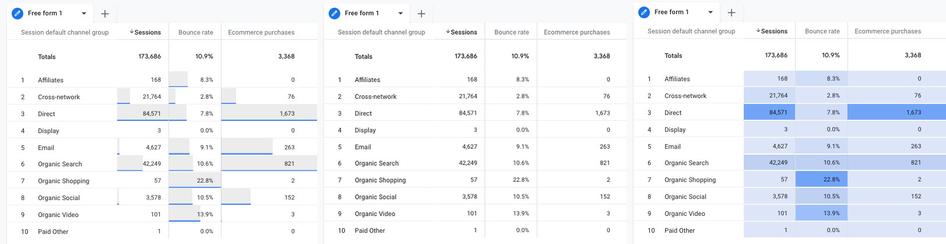
While GA4 is definitely more visual than UA (the segment overlap exploration has three colors!), it’s not very exciting to look at or easy for non-analysts to make sense of.
To add some color to your reports, try connecting your GA4 data with a performance reporting tool like Looker Studio (formerly Google Data Studio).
Better still, add a visual analytics tool like Hotjar Heatmaps to your stack and see real user behavior—clicks, scrolls, and mouse movement—overlaid on your site’s pages.
No qualitative data
GA4 explorations only give you quantitative (i.e. numerical) data about how people interact with your website. You still need to pair it with qualitative data to fully understand not just what users do, but their motivations, frustrations, and reasons for choosing your business.
Add a survey tool like Hotjar Surveys to create a website survey to collect user feedback. Try triggering a survey on a user behavior—e.g. when people navigate away from checkout—to investigate the ‘why’ behind their actions.
Get more from GA4 explorations
GA4 explorations help you report on your website’s and marketing campaigns’ success and find new areas for growth. But all the numbers in the world won’t tell you why users do and don’t convert. That’s why we think you’ll get more from your data by combining Google Analytics and Hotjar.
Use GA4 to track events, then integrate them with Hotjar to dig into the real user behavior behind the numbers.
Explore user behavior with Hotjar
Use Hotjar’s tools to see the user behavior behind your GA4 explorations and make data-backed optimizations for growth.