Learn / Guides / Product marketing guide
12 OKRs and KPIs to track for successful, customer-centric product marketing initiatives
You don’t track product marketing OKRs and KPIs because you love to look at numbers (well, maybe you do—but that isn’t the only reason). Product marketers are the link between customers and product teams. OKRs and KPIs help you uncover insights and test hypotheses to create impactful initiatives that help users achieve their goals.
Summary
Blending empathy, curiosity, and data helps product marketers take calculated steps to align the product and customers. This guide explores 12 OKRs and KPIs for product marketers.
OKRs vs. KPIs: OKRs are your team’s goals, and KPIs are how you measure progress
Narrow your focus with OKRs: defining your direction and destination keeps you organized
Measure your progress with KPIs: product marketing metrics help you understand customers, improve your website, and generate new ideas
Product marketing OKRs vs. KPIs: what’s the difference?
Objectives and key results (OKRs) are the goals your product marketing team wants to achieve, split into two parts—high-level objectives and specific key results. For example, if your objective is boosting product awareness, a key result to work toward might be increasing product mentions on social media by a percentage each month. Aim for up to four key results per objective so your work stays focused.
Product marketing key performance indicators (KPIs) are metrics you use to measure the effectiveness and impact of an initiative, like the month-over-month increase in social mentions.
Product marketing OKRs and KPIs are different but equally important for your marketing strategy: OKRs dictate purpose and priorities, while KPIs help you track your progress.

6 product marketing OKRs to help you plan your purpose and priorities
As a product marketer, there are probably about 15 projects and goals you could be working on at any given time.
Maybe in the past, you’ve tried juggling them all at once because they felt critical and related: your competitive analysis feeds the positioning you need for your go-to-market plan, which relies on your personas.
But dedicating attention to a few initiatives through OKRs focuses your progress to make a noticeable difference. Here are six examples you can use.
🏆 Goal/purpose
🎯 Objective
🚀 Key result
1. Plan a successful product launch
Launch a new product
Generate 500 website visitors to the landing page from your product launch campaign
2. Maximize customer retention
Increase customer retention and reduce churn
Reactivate 5% of churned users
3. Expand collaboration with the sales team
Create a successful sales enablement program
Increase lead-to-customer conversion rate by 3%
4. Improve customer value
Improve customer engagement and value
Create one new product upgrade campaign this quarter
5. Prioritize user research
Create a customer persona
Conduct 15 user interviews to learn about their needs and preferences
6. Optimize marketing spend
Focus on the top-performing channels and strategies
Consolidate 75% of product marketing budget to the top three product marketing initiatives
6 product marketing KPIs to help you measure progress
Customer empathy—seeing, feeling, and thinking like your users—has as much to do with data as it does with emotions. Curiosity is a starting point, but quantitative and qualitative data reveal what is instead of what you assume.
There’s no shortage of metrics product marketers use, but you can focus on quality over quantity by thoughtfully applying these six essential KPIs across your work.
1. Product and pricing page traffic
If your product marketing team is responsible for particular website pages—like pricing and product pages—you need to keep tabs on their performance. Tracking traffic to your areas of the website lets you benchmark user interactions and determine the success of new campaigns or updates.
How to measure it: use a website tracking tool to measure the number of sessions and users on your product pages. While you’re in your website analytics dashboard, check out bounce rate, exit rate, and session duration for more insight into engagement with the pages you own.
How to use it:
Establish a baseline ‘normal’ for your homepage, product pages, and pricing pages to identify out-of-the-ordinary leaps or dips in traffic or sudden bounce rate issues that need investigation ASAP
Compare engagement KPIs like session duration before and after implementing changes on your product pages to gauge their effect
Measure the impact of traffic-focused initiatives like a product launch
👟 Walk a mile in customers’ shoes
You know everything about your product and pricing pages…or do you? Even though you’re the resident product marketing expert, you need to take a moment to see things from a new perspective.
Hotjar (hi, that’s us 👋) puts customer insights at your fingertips, with tools like Recordings, Heatmaps, Surveys, and Feedback working together to give you a holistic view of user behavior.
Review heatmaps for your product pages to get an aggregated view of visitors’ behaviors and engagement. If you notice a CTA button doesn’t get as much traction as expected, jump to recordings in a single click to see playbacks of journeys taken by individual users who did (and didn’t) make it to your CTA.
Better yet, if you’ve set up an on-site survey or feedback widget, you’ll see users’ responses right there in the recordings player’s timeline, giving you insight into what they experienced at the moment they provided feedback.
Hotjar’s tools let you learn from customers through their interactions and feedback to improve positioning, increase conversions, and create better campaigns.
2. Click-through rate
Click-through rate (CTR) compares how many people saw a CTA to the number who actually clicked it. Think of it as another way to track forward momentum and determine whether your messaging and design aligns with customers.
How to measure it: CTR = (clicks / impressions) x 100
How to use it:
Track engagement and success of product round-up emails or feature adoption campaigns
Compare effectiveness of A/B variations for a product page to determine which led to the highest ‘add to cart’ actions. (Hint: take your research a step further by using on-page surveys to understand why one won.)
Re-invest paid ad spend in the variation with product positioning that drives the most clicks
👀 See why users drop off
A click-through rate measures one step in a customer’s journey, but what did they do before and after that moment? Hotjar Funnels lets you visualize where and why users drop off. If you've just launched a new marketing campaign, apply filters to track conversions by channel or country. Then, use other Hotjar tools, like Heatmaps and Recordings, to find and fix issues affecting a specific cohort.
3. Customer acquisition cost
"You have to spend money to make money"—but hopefully you’re not spending too much. Customer acquisition cost (CAC) is the amount of money you spend to get a new customer, and ideally, that figure is as low as possible. Tracking CAC as a product marketer gives you a reference point as your customer base and marketing budget increase to understand how they change relative to each other.
How to measure it: cost of acquiring customers in a given period / number of customers in the same period
How to use it:
Compare the cost of different acquisition channels and campaigns to learn where to keep investing and what to cut off
Measure the CAC for different customer segments to choose who to focus on for the best value
Set up a feedback loop with the sales team to learn about the quality of leads from different sources and product touchpoints
🤝 These tools are better together
Customers interact with your company across multiple touchpoints, and your teams work across as many tools—why not bring them together? Hotjar integrates with tools like HubSpot, Kissmetrics, and Freshpaint, connecting customer and website data so you can view insights from all angles (without having a million tabs open 💆♀️).
4. Conversion rate
When you hear ‘conversion rate’, the percentage of people who purchase typically comes to mind. While sales are part of it, product marketing teams should track product conversion rates for both macro- and micro-conversions.
Macro-conversions are the main events you’re used to tracking—like the percentage of visitors who make a purchase. Micro-conversions are the small steps that lead to that moment, like following a campaign link to your landing page and downloading a product guide.

How to measure it: conversion rate = (number of conversions / total number of visitors) x 100
How to use it:
Compare the conversion rate for visitors who did and didn’t view product marketing materials
Test and iterate pricing pages to increase the conversion rate
Measure conversion rates for product upsells after a product launch email
📈 How re:member increased conversion rates by 43%
re:member is a trademark of Entercard, one of Scandinavia’s leading credit market companies. After noticing that visitors from affiliates had a much lower conversion rate, they used Hotjar Recordings and Heatmaps to investigate why these users were reluctant to fill out an application form. They learned:
Users were interested in the benefits section, given that this section had the most cursor activity
Users who scrolled up and down wanted to find more information
Users who clicked on the benefits were trying to expand the bullet points (to reveal more details)
Users who visited the homepage wanted to learn more about re:member’s products before they filled out the form
So, they redesigned the mobile and desktop forms to display more information, moved the benefits section to the top of the page, and created expandable fields on the desktop version.
The result? The conversion rate improved by 43% from affiliates and 17% overall.
👉 Learn more about how re:member’s Senior Marketing Specialist uses Hotjar
5. Net Promoter Score®
Net Promoter Score, or NPS®, asks customers how likely they are to recommend your brand. Customers respond on a scale of zero to ten, with ‘promoters’ indicating nine or ten and ‘detractors’ ranking zero to six. Folks in the middle are called ‘passives’.
How to measure it: NPS = % of promoters - % of detractors (P.S., we have a free NPS calculator!)
How to use it:
Compare NPS survey results from customers who have been with your company for one, three, and six months to gauge product satisfaction at different points in the customer journey
Identify promoters to use for case studies, use cases, and testimonials
Follow up with detractors to learn where the product or their experience lacks
📅 NPS scores are a long game
Like most product marketing KPIs, insights from NPS surveys are most useful when compared across a time period, campaign, or customer segment. You can keep an eye on your NPS trend with a Hotjar dashboard—simply pin the NPS widget to your customized board to continuously track how user sentiment changes over time.
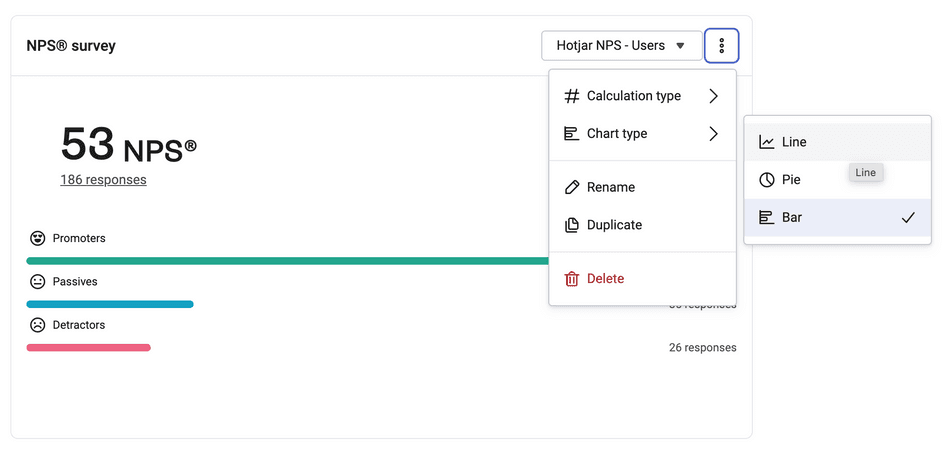
Use a dashboard to see NPS trends at a glance—choose your chart type for easy viewing
6. Customer churn
Customer churn is inevitable—customers come and go—but product marketing teams can work with other departments to reduce the rate of customers who cancel their service or stop buying from you. When you understand why customers leave, you can make changes to keep them around and understand which segments are the best fit to target in the first place.
How to measure it: churn rate = (lost customers / total customers at the beginning of the period) x 100
How to use it:
Survey churned customers to learn why they left, then tweak your strategy with new positioning or information
Investigate which customer segments have the highest churn rates to adjust product marketing campaigns or your target audience
Measure the effectiveness of re-engagement or winback campaigns
🥳 Customer research is a team sport
Product marketers need to know everything about customers and the product, so you need to invest time in external and internal relationships. One way to collaborate across team lines is by hosting Hotjar Watch Parties 🍿 where you invite the product, sales, and support teams to watch real user interactions with your website or product, together. This type of collaboration helps you
Find and fix bugs
Prioritize new features
Optimize UX and UI
Interpret insights from a new perspective
Let customers guide your product marketing efforts
Product marketing OKRs and KPIs are helpful tools for organizing your work, but all the metrics in the world can’t replace curiosity, empathy, and collaboration. Instead of letting metrics turn your customers into numbers, let OKRs and KPIs inspire you to learn and improve consistently.
Start with a goal, measure your progress, share what you learn, and try new ideas.
Let customer insights drive your marketing strategy
Hotjar’s tools let you learn from customers through their interactions and feedback to improve positioning, increase conversions, and create better campaigns.
