Learn / Guides / User sentiment guide
Survey sentiment analysis: how to analyze the sentiment behind your survey responses
Understanding your customers helps you improve your products and the customer experience (CX). But it’s not enough to know what customers do on your website. You also need to know what they’re thinking and feeling at all points of the customer journey.
Surveys are a great way to collect feedback from your customers, but they yield a lot of subjective information that isn’t that easy to turn into objective, actionable insights. Enter: survey sentiment analysis.

This guide explains why and how to perform survey sentiment analysis, including practical tips on how to apply the insights you've gathered to your business and product to create customer delight.
Know how customers really feel about your product
Hotjar Surveys let you gather valuable feedback in customers’ own words—so you can go deep into the why of user behavior.

Why your business needs to analyze survey sentiment
Survey sentiment analysis is the process of sorting customer feelings behind answers to open-ended survey questions into categories and polarities like positive or negative sentiments, or certain themes like the user experience (UX), and then analyzing those sentiments. This is key to measuring a user’s emotional connection to your brand and product. The more connected they feel, the happier they are with your product experience (PX). And the happier they are, the more likely they are to buy, use, or recommend it.
Ask a question like, “How do you feel about our product?” and customers are likely to answer using words like ‘love’, ‘hate’, etc. So the sentiment will be fairly clear. However, if you ask, “What’s stopping you from recommending our product to a friend?” it can be harder—but just as important—to decipher the customer’s sentiment behind their words.
Survey sentiment analysis lets you uncover hidden insights behind your customers’ words, helping you empathize with them—and make changes to your branding, product, and processes to boost customer satisfaction and retention.
For example, an ecommerce shopper might abandon their cart if they can’t find information about your refund policy. To address this, you need to know what they’re thinking and feeling at that point. Analyzing the sentiment of exit-intent surveys tells you what doubts and worries your potential buyers have. Then, you can create materials—like an FAQ section at the point of sale—to provide your users with the answers they need at the right time to build trust and boost conversions.
Or, when SaaS customers cancel their subscriptions, you can identify the emotional factors involved in their decision by analyzing churn surveys. For example, you might discover that end-users hate your user interface (UI). So, user sentiment analysis from churn surveys tells you what you need to change to keep your remaining customers happy. Like all product experience (PX) insights, survey sentiment analysis helps get cross-functional teams on the same page by eliminating disagreements about ‘what the customer really wants.’ It also helps you get stakeholder buy-in for changes.
Survey sentiment analysis means no more second-guessing what customers think and feel, enabling you to make user-centric decisions based on reliable qualitative data.
Let’s look at the different types of survey questions and how survey sentiment analysis helps you take action and make changes based on their answers.
Open-ended vs. closed-ended survey questions
Asking open-ended questions is key to survey sentiment analysis. Let’s take a look at the benefits and challenges involved:
What are open-ended vs. closed-ended questions?
Closed-ended questions can be answered with a simple ‘Yes’ or ‘No.’ For example, “Are you satisfied with our product?” Or with a numerical sentiment score or rating: “Please rate your level of satisfaction on a scale of 1-10.”
By contrast, open-ended questions require more detailed answers. For example, an open-ended follow-up to the above questions would be, “Why did you give us that rating?” But why do you need to ask open-ended questions in the first place?
Open-ended questions provide valuable contextual qualitative data that complements your quantitative data, so you get the what and the why behind user actions. They provide authentic feedback in the customer’s own words that helps you understand things from their perspective, providing context for their actions.
Asking open-ended questions lets you personalize interactions and go deeper into sentiment for specific groups. For example, you can ask slightly different questions of new and returning customers, or of occasional vs. regular users of a SaaS tool.
Open-ended questions also maximize the insights you gain from a relatively small sample size. For example, a SaaS product team planning a launch can survey beta users to find out which features need improvement. These early adopters represent only a small fraction of the eventual target market, but their input is invaluable for achieving product-market fit before rolling out to a larger audience.
Challenges of analyzing open-ended questions and how survey analysis helps
While there are many benefits, it’s harder to analyze open-ended questions than closed-ended ones. Here’s why:
Open-ended questions give you subjective rather than objective answers. You'll need to turn them into objective insights to act on them successfully, and it can be very time-consuming to code and analyze hundreds of long-form answers manually.
It’s more challenging to identify patterns and themes in text data than extract a numerical score from ratings
Your analysis can suffer from observation bias. It’s tempting to ask leading questions like “Tell us why you love our product,” or “What’s the best thing about our new feature?” as opposed to neutral sentiment questions like “How do you feel about our new feature?” Leading questions can cause customers to give a more positive sentiment response than they otherwise would. It’s also tempting to interpret results according to what you’d like to see, so all survey questions need to be carefully written to avoid bias.
Survey sentiment analysis helps overcome these challenges by making it easier to uncover patterns, themes, and trends in qualitative data sets.
Let’s take a look at how it works.
4 steps to run an effective survey sentiment analysis
Performing survey sentiment analysis starts with gathering the right data. Then, you need to organize and analyze your data and act on the insights.
1. Choose your qualitative data analysis method
There are four basic ways to analyze qualitative survey data:
Content analysis examines and groups user responses based on their expressed emotion, helping you understand customer behavior and measure brand reputation.
Thematic analysis identifies and interprets themes and patterns in qualitative data. For example, if you spot that users dislike your new releases, your product teams can make changes to the UI and features.
Grounded theory analysis involves creating theories and hypotheses by examining real-world data. For example, if churn rates are high, you can hypothesize why you’re losing customers and look for data to back it up.
Discourse analysis tells you what people think of a topic, and why. It works best for longer text analysis but is also useful for marketers to understand customer motivations expressed in market research surveys.
The sentiment analysis model you choose depends on what you want to learn about your customers and how you’ll use the insights. If you want to get even more granular, you can conduct aspect-based sentiment analysis (ABSA) to identify specific aspects and associated opinions from survey responses, or conduct public opinion mining on any online text data, including posts on forums, social media platforms, Tweets, news articles, and customer reviews.
2. Gather the right insights
The next step in the sentiment analysis process is information gathering. Here's how to gather information from surveys:
Choose your survey type and tool
There are several types of sentiment surveys you can use to ask open-ended sentiment analysis survey questions:
Net promoter score® (NPS) surveys measure customer loyalty and satisfaction. They’re usually closed-ended, but you can ask open-ended follow-up questions after a rating.
Customer satisfaction surveys tell you what customers feel about your product, brand, and customer support.
Customer effort score (CES) surveys are a type of customer experience survey. They measure the effort involved for customers to use your product or resolve issues with your help desk.
Point of conversion (POS) surveys launch when customers reach specific milestones, like completing a purchase on your site.
Retention surveys tell you why customers cancel or downgrade a subscription or return an item.
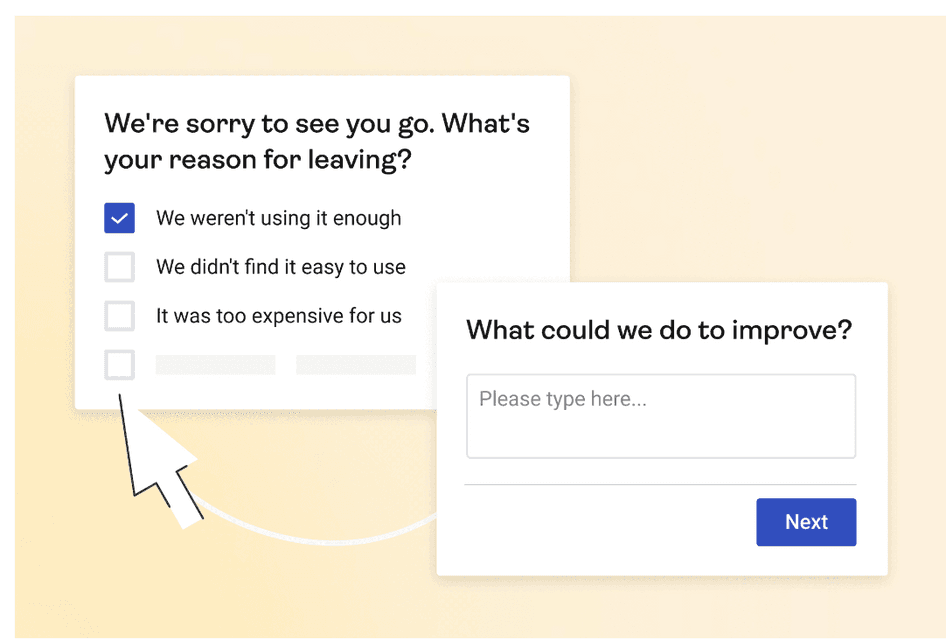
Use Hotjar's Survey tool to run all the sentiment analysis surveys (and more) mentioned above: take advantage of our large survey template library and get inspiration from our question bank on what to ask your users.
Run your survey
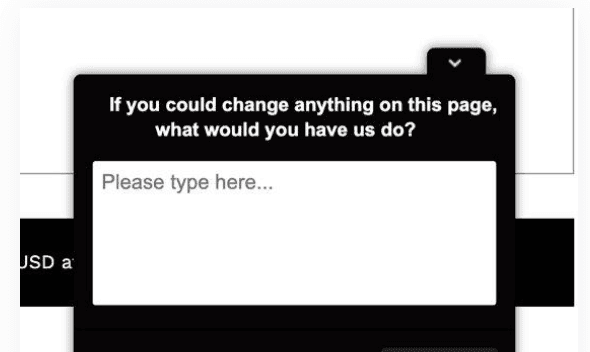
First, create and run an on-site survey (that appears on a website page) or an online survey (that exists on a separate URL). Then, time your survey to pop up at the right time on your website to capture the data you want. For example, a SaaS provider looking to gather point-of-conversion insights can launch their survey when customers sign up for a demo or trial.
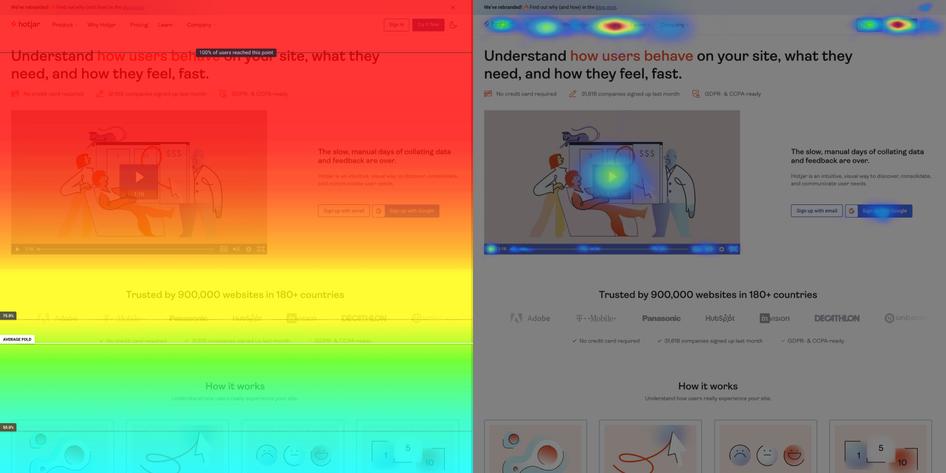
Pro tip: use Hotjar's Observe tools—Heatmaps and Session Recordings—to map the user journey and identify where to place your surveys.
Heatmaps show you which areas of your site get the most attention, whereas Session Recordings reveal where users get frustrated and drop off, helping you determine on which pages to deploy exit surveys. You’ll be able to collect more relevant responses by embedding surveys in appropriate places.
If you know most of your site visitors don’t make it below the fold, you need to place your surveys on the top half of the page.
Finally, use a sample size calculator to determine how many data points you need to achieve statistical significance—and get a representative sample of your customer base. This tells you how many survey responses you need before you can start your analysis.
Once you’ve collected your data, the next step is to organize it.
2. Organize your data
Once your surveys are in, you need to organize the data. You can organize it by type, topic, theme, etc. One way to do this is to upload it to a research repository. This unifies it with other data and makes it easily accessible.
If you're using Hotjar to view your survey data, go to the responses tab and use filters to remove incomplete answers, which could affect the accuracy of your data. Then, use Hotjar Highlights to curate and organize your survey responses. You can create 'Collections' of your survey sentiments, like negative and positive survey answers, or of surveys that contain a specific keyword, so you can quickly share insights with your team to get buy-in for your ideas and product functionality updates.
Know how customers really feel about your product
Hotjar Surveys let you gather valuable feedback in customers’ own words—so you can go deep into the why of user behavior.
3. Analyze your survey data
There are several ways to analyze survey sentiment. You can do it manually or use dedicated sentiment analysis software.
How to analyze survey sentiment manually
If you don’t have the budget to invest in software, you can analyze survey data manually. Here are two ways to do it:
1. Use a spreadsheet like Hotjar’s open-ended question analysis template. This is a quick and affordable way to structure your data and extract quantitative insights from qualitative data.
In a nutshell, this is how it works:
Export data from your surveys to the spreadsheet
Use a text analyzer to identify broad categories of responses
Assign a value to each category. Then, go through the spreadsheet and assign each response to a category. So, if ‘satisfied customers’ are Category 1, label each response that indicates satisfaction with a 1.
Group categories together if you notice respondents use different words to describe the same concept
Represent the data visually by creating a chart in the spreadsheet
2. Look at Hotjar Dashboards to compare metrics over time and filter by month to see how sentiment changes. This makes it easy to spot trends. You can also visualize responses per question as tables, charts, or word clouds.

How to analyze survey sentiment automatically
If you don’t have time for manual data analysis, you can automate it, eliminating bias in the interpretation of surveys.
Use qualitative data analysis tools like Quirkos, ATLAS.ti, or MonkeyLearn, which use machine learning or deep learning to classify data through text and keyword analysis. Sentiment classification helps you find themes in customer feedback and anticipate what your users are going to do next.
Many of these tools use algorithms and natural language processing (NLP), a component of AI that helps computers understand and interpret human language and, more specifically, the lexicon your customers use to talk about you. NLP tools like Thematic and Hotjar AI for Surveys lets you sort survey insights by theme and matches them to historical behavior data, so you can predict users’ future actions—like whether ecommerce shoppers are likely to make a purchase.
In Hotar, you can turn on sentiment analysis and automated tags to let AI do the manual work of categorizing and tagging responses based on user sentiment to save time on survey analysis. Use the charts in the Results tab directly in your presentations to demonstrate real-time user sentiment and how it changes over time.

Or, let AI for Surveys automate the entire process, from creating and running your sentiment survey to organizing the response data into a generated report that includes a summary, key findings, customer quotes, and suggested next steps to take.
4. Act on your survey insights
Once you’ve analyzed survey sentiment, it’s time to act on those insights. First, prepare some charts and graphs to visualize the data (or use AI-generated ones from tools like Hotjar). This will be especially helpful if you need stakeholder buy-in to make product or website optimization changes.
Here are just a few ways you and your customers can benefit from survey sentiment analysis insights:
Address complaints and make changes to improve the customer experience: for example, ask open-ended customer sentiment survey questions to identify user challenges at different touchpoints. Then, based on these survey responses, identify common customer complaints—like timed-out searches, a poor onboarding experience, or unclear policies.
Improve your UX to boost conversions: for example, launching a Hotjar exit survey when visitors are about to leave your website will reveal friction points like unclear language that creates doubt in customers’ minds. Once you know this, you can tweak your copy to make it clearer.
Improve your purchase process: for example, watching user session recordings on an ecommerce site will reveal when visitors rage-click or drop off. Then, you can launch surveys at those points to understand what’s stopping your potential customers from buying. It could be as simple as confusing a non-clickable element for a clickable button, which is easy to fix.
Create compelling marketing campaigns and website content based on the language your satisfied customers use. This brings the voice of the customer to your copy and helps them identify with your brand.
Develop or improve features and onboarding flows to help users get even more value out of your product.
Improve customer support and success to boost customer satisfaction and retention rates. If you’re using Hotjar, you can easily share PX insights via the Slack integration to keep all your teams in the loop and read survey responses as they come in.
Survey sentiment analysis: the key to empathizing with your customers and creating products they love
Survey sentiment analysis puts the voice of the customer at the heart of your decision-making. Combine quantitative insights—what people do—with qualitative data—why they do it—from surveys to experience the customer journey through their eyes, so you can truly empathize with your customers, which puts you in a better position to give them exactly what they want.
Want to know how customers really feel about your product?
Hotjar Surveys let you gather valuable feedback in customers’ own words—so you can go deep into the why of user behavior.