Learn / Guides / Customer retention guide
How to measure and improve customer retention with 7 core metrics and KPIs
Tracking customer retention helps you grow your business by keeping customers happy and loyal. But without the right metrics and data, you won’t know how well you’re doing or see where improvements should be made to drive more success.

This guide will show you how to calculate seven popular retention metrics and key performance indicators (KPIs) and why these metrics are important. With this valuable information, you can benchmark your performance and use data to make optimizations that increase retention—and improve ROI and new customer conversions in the process.
Skip to the metrics you need:
1. Customer retention rate (CRR)
4. Customer lifetime value (LTV)
Insights to improve customer retention
More happy customers means more long-term success for your business. Use Hotjar to learn why customers churn—and how to keep them coming back.

What are customer retention metrics?
Customer retention metrics measure how well your business retains customers and how satisfied those customers are throughout the entire customer journey.
Quantitative metrics, like churn rate and Net Promoter Score®, give you numerical KPIs to track customer retention over time. Pairing them with qualitative data, like Hotjar’s survey feedback and individual session recordings, gives you deeper insight into why you are (or aren’t) retaining customers. The best part? Combining the two also sparks ideas for improvements to grow your business and sales in the future.
7 customer retention metrics and KPIs to track for business growth
These seven customer retention metrics help you measure how well your company currently retains and satisfies customers. Pick two or three that align with your business goals and include a mix of sales data (e.g. how much customers spend) and feedback (e.g. customer comments) to make sure you’re tracking retention and working toward improving it.
1. Customer retention rate (CRR)
Customer retention rate (CRR) is the percentage of customers who stick with a company over time. CRR is often used by subscription and service businesses like SaaS, banking, and telecom companies—the ecommerce equivalent is repeat purchase rate (see below!).
How to calculate customer retention rate: choose a timeframe (usually a month or year), subtract the number of new customers gained during that period from the total number at the end, divide the result by the number of customers at the start, and multiply by 100:
Customer retention rate = ((End number of customers - New customers gained) / Starting number of customers) x 100
For example, if you had 1000 customers on Jan. 1 and 1200 customers on Dec. 31, and gained 400 new customers throughout the year, your annual customer retention rate would be:
((1200 - 400) /1000) x 100 = 80%
What is a good customer retention rate?
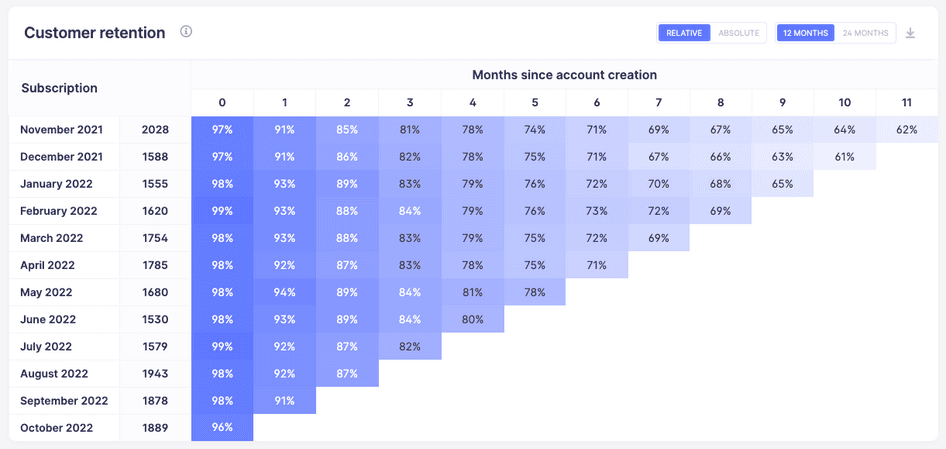
ConvertKit’s customer retention rate by cohort displayed in customer retention tool, Baremetrics
For SaaS companies, a monthly retention rate of 95% (representing 5% churn) is generally considered good. For reference, creator marketing platform ConvertKit has a monthly retention rate of around 96%, and social media toolkit Buffer has a retention rate of around 95%.
A low retention rate could mean your customers have problems when purchasing from you or using your product. To find out what the specific issues are—and avoid losing revenue and reputation to churn—review qualitative customer insights from session recordings, surveys, and feedback widgets.
💡Pro tip: increase customer retention rate by fixing website bugs.
The team at DashThis, a marketing dashboard, used Hotjar Recordings to find out why users weren’t completing their onboarding sequence—an important milestone for SaaS customer retention.
Astrid Boivin, UX Architect at DashThis, reviewed session recordings and saw three recurring issues causing frustration:
Customers didn’t know where to click to add integrations
Buttons were hidden on small screen resolutions
The list of 30+ integrations was overwhelming users
The team was then able to get buy-in to fix these problems and increase onboarding completion rate by 50% in just a few months.
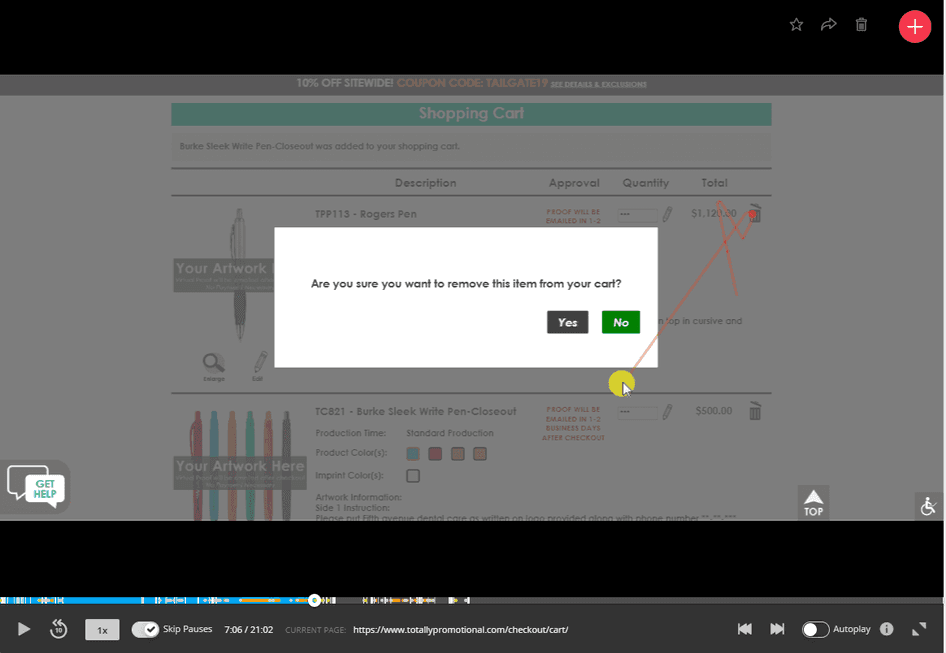
An example Hotjar recording used by Totally Promotional to fix website bugs
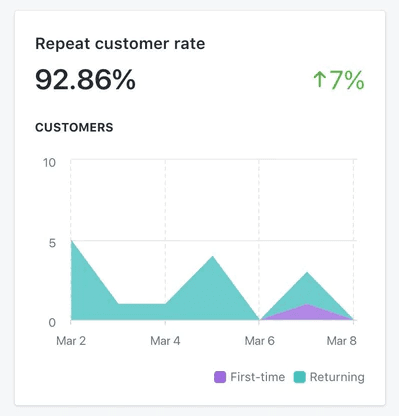
2. Repeat purchase rate (RPR)
Repeat purchase rate (RPR), also known as repeat customer rate (RCR), is the percentage of existing customers who make an additional purchase during a specific period.
How to calculate repeat purchase rate: choose a timeframe, and divide the number of customers who purchased more than once by the total number of customers, then multiply by 100:
Repeat purchase rate = (Number of customers who made more than one purchase / Total number of customers) x 100
If you’re using an ecommerce platform like Shopify, you can usually view repeat customer rates in your sales dashboard.
What is a good repeat purchase rate?
According to customer data collected by ecommerce analytics platform Metrilo, the average repeat purchase rate across industries is 28.2%. Expect lower repeat purchase rates in industries with a lot of seasonality and higher rates for regular-use items like pet products or health supplements.
If your store, comparatively, gets significantly fewer repeat purchases, you need to uncover why to get things on the right track. Try adding a sitewide feedback widget to capture customers’ thoughts wherever they want to share them. Remember: increasing repeat purchase rate increases the revenue you generate from every new customer you attract, too.
3. Customer churn rate
Customer churn rate, also known as user churn rate, is the percentage of customers who leave during a certain time period (usually one month or one year). Churn is typically used by SaaS and subscription businesses that have monthly or annual contracts with customers.
How to calculate customer churn rate: specify a timeframe and divide the number of customers who left during the period by the total number of customers at the start, then multiply by 100:
Customer churn rate = (Number of customers who left / Total number of customers at start of period) x 100
For example, if you had 1000 customers on Jan. 1, but 500 left before Dec. 31, your annual user churn rate is:
(500/1000) x 100 = 50%
What is a good customer churn rate?
For SaaS companies, a monthly customer churn rate of between 3% and 8% is considered good. For reference, Buffer has a monthly customer churn rate of around 5% and ConvertKit around 4%.
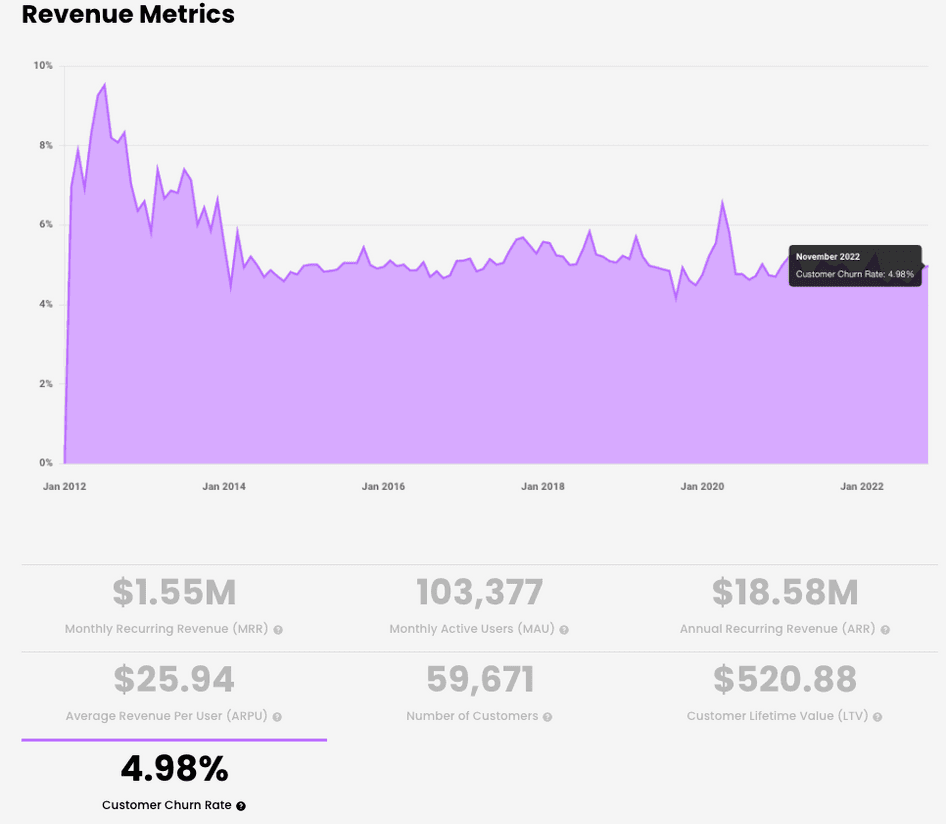
Buffer’s monthly customer churn rate
At Hotjar, we know how important reducing churn is for SaaS businesses: back in 2017, we had an annual revenue churn rate (measuring lost revenue, not customer numbers) of 32%, which we reduced, in part, by sending a survey when customers unsubscribed and making changes based on what they told us. Yes, sometimes, you really can calculate the ROI of a survey!
💡Pro tip: reduce churn by learning why customers leave.
The team at Hussle, a gym pass platform, sent a Hotjar Survey to users who canceled their subscriptions, simply asking: “why did you decide to cancel?”.
Luke Calton, Hussle’s Product Lead, grouped similar responses into themes and found that 26% of churning users were buying memberships from local gyms instead. The team then prioritized a new product feature and allowed users to purchase gym memberships directly through Hussle, leading to a reduction in churn and an increase in customer retention.
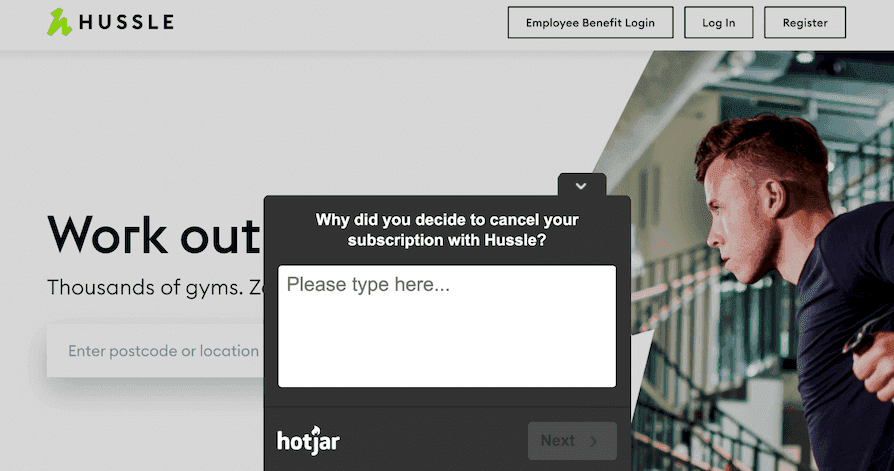
The single Hotjar Survey question that increased customer retention for Hussle
Reduce future churn by asking why customers leave
Send a churn survey with Hotjar and learn why users canceled. Then, make the changes that matter.
4. Customer lifetime value (LTV)
Customer lifetime value (LTV or CLTV) is an estimate of the total value of a customer during their relationship with a company.
How to calculate customer lifetime value: for ecommerce, multiply the average order value by the average number of purchases and the average estimated customer lifespan (how long customers typically keep purchasing from you, not how long they might live!):
Customer lifetime value = Average order value x Average number of purchases x Average customer lifespan
For SaaS companies: divide the monthly average revenue per account (ARPA) by your user churn rate (see below). ARPA is monthly recurring revenue (MRR) divided by the total number of customer accounts.
What is a good customer lifetime value?
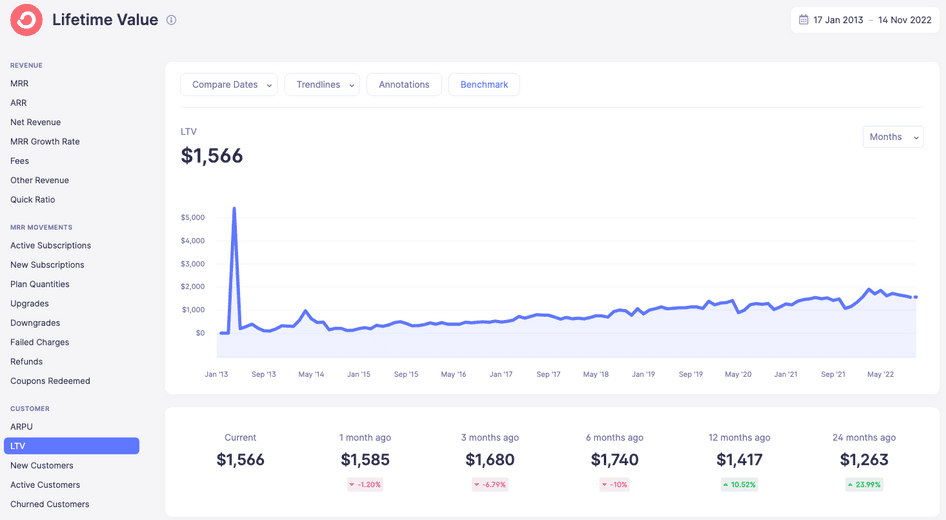
ConvertKit’s LTV growth over time
In general, the higher your LTV, the better. If you’re working to improve retention, you should see LTV increasing over time. In SaaS, LTV is expected to be at least three times more than customer acquisition cost (CAC); i.e. your LTV:CAC ratio should ideally be 3:1 to ensure profitability.
5. Customer satisfaction score (CSAT)
Customer satisfaction score (CSAT) is a measure of how satisfied a customer is with a product or service. CSAT surveys usually contain a simple 5-point scale or binary happy face/sad face option and are sent after a customer has received a product or used a service.
How to calculate customer satisfaction score: add up all the positive responses you receive (those with ‘satisfied’ or ‘very satisfied’ selected), divide by the number of survey respondents, and multiply by 100:
Customer satisfaction score = (Total positive scores / Number of respondents) x 100
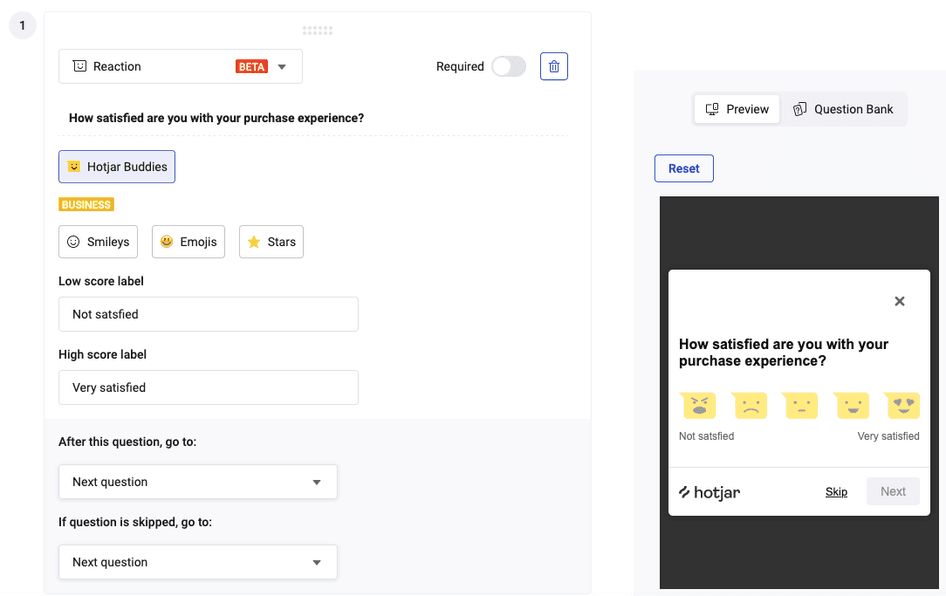
Creating a CSAT survey in Hotjar using the free CSAT survey template
What is a good customer satisfaction score?
If you ask a yes/no CSAT survey question, scores can reach 90% and above, and lower scores may mean you have urgent issues to fix (that’s why you always need to ask follow-up questions!).
A 5-point survey like the one above will generate lower scores as you’ll also capture neutral responses. Survey your customers to create your own benchmark, and you’ll be able to track if satisfaction is increasing or decreasing over time and measure the impact of your optimizations.
6. Net Promoter Score® (NPS)
Net Promoter Score (NPS) is a numerical measurement of customer loyalty, satisfaction, and enthusiasm based on responses to the question: “On a scale from 0 to 10, how likely are you to recommend this product/company to a friend or colleague?”.
How to calculate Net Promoter Score: subtract the percentage of customers who answer with a 6 or lower (known as ‘detractors’) from the percentage of customers who score you a 9 or 10 (known as ‘promoters’).
Net Promoter Score = % promoters - % detractors
If you’re using Hotjar Surveys to send out NPS surveys, it will automatically calculate your score so you can track it over time.
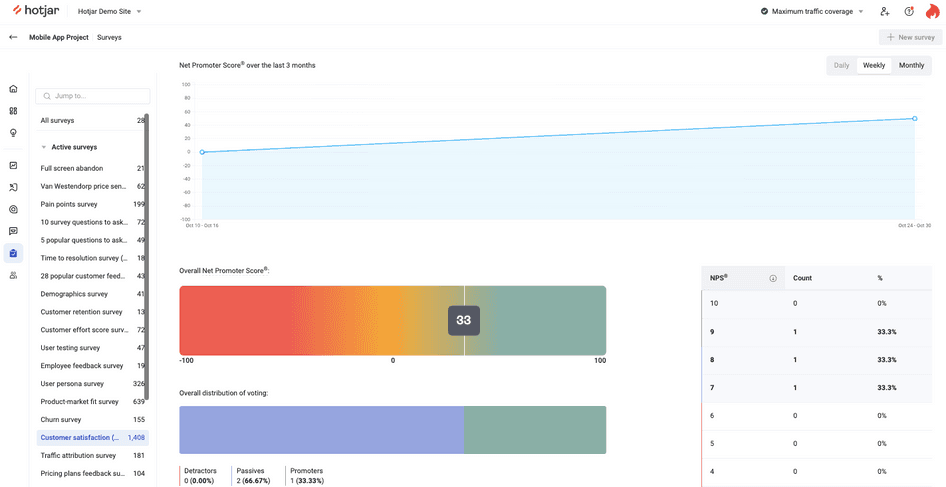
💡Pro tip: customers selecting 7 or 8 on the NPS survey are known as ‘passives’ and don’t count toward the score—but don’t ignore them! They are so close to becoming ‘promoters’ it’s worth reading their feedback and watching session recordings to understand what you could do better/differently to win them over.
What is a good Net Promoter Score?
A Net Promoter Score can range from -100 to +100. But Fred Reichheld, the inventor of NPS, believes a score of 60 or more is an excellent NPS benchmark in any industry.
Top Net Promoter Scores vary greatly by industry, from as high as 80 for specialty stores like Costco to as low as 30 for cable providers like Verizon.
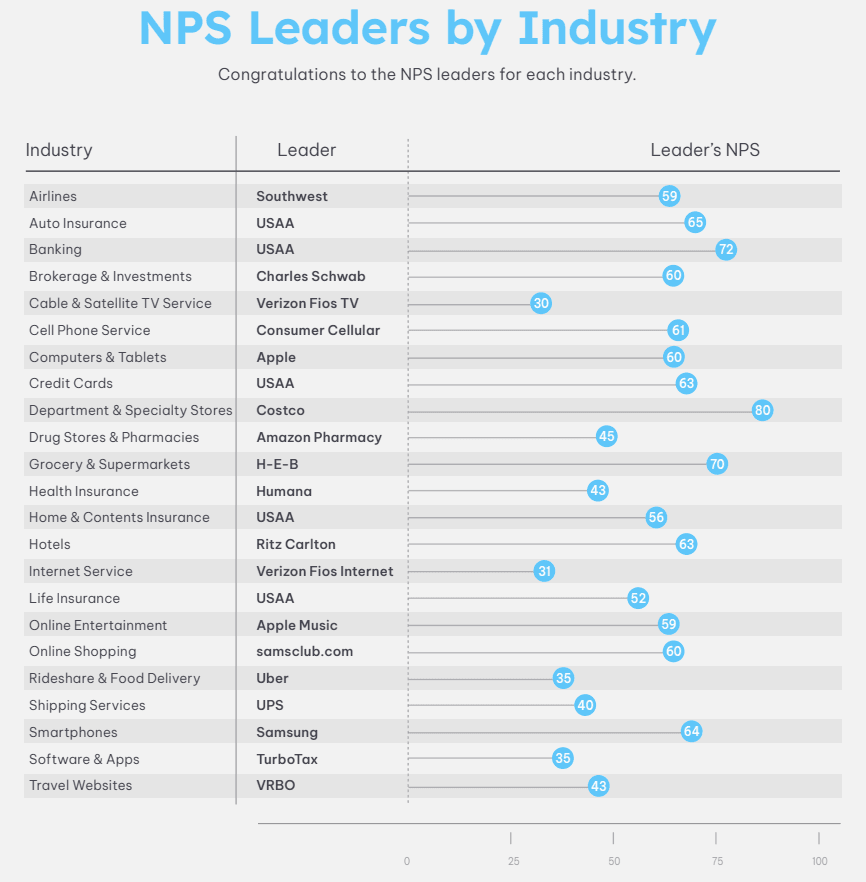
Satmetrix’s list of best Net Promoter Scores by industry in 2022
💡Pro tip: add an open-ended follow-up question to your NPS survey to find out the why behind customer ratings.
Use survey logic to ask customers who give a score of 8 or below (your NPS detractors and passives) to tell you what went wrong. Group responses by theme and you’ll have a list of actionable ideas to work on to improve customer loyalty and retention.
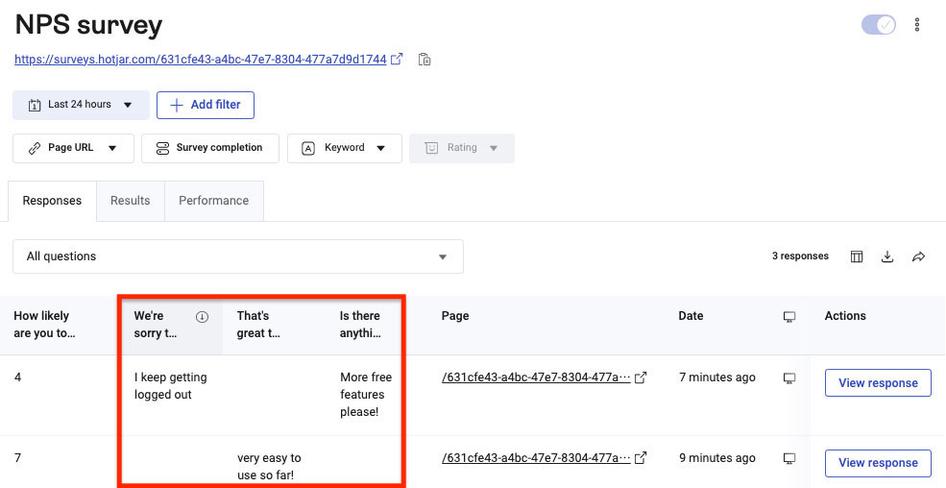
Viewing individual NPS survey responses in Hotjar
7. Customer effort score (CES)
Customer effort score (CES) is a measure of how much effort a customer thinks it took to make a purchase or use a product or service. CES is typically measured on a scale of 1 to 5, with 1 being the most effort and 5 being the least.
How to calculate customer effort score: total all the scores you receive and divide by the number of survey respondents. Divide the result by the total number of options on the survey, and multiply by 100:
Customer effort score = ((Total scores / Number of respondents) / Number of options) x 100
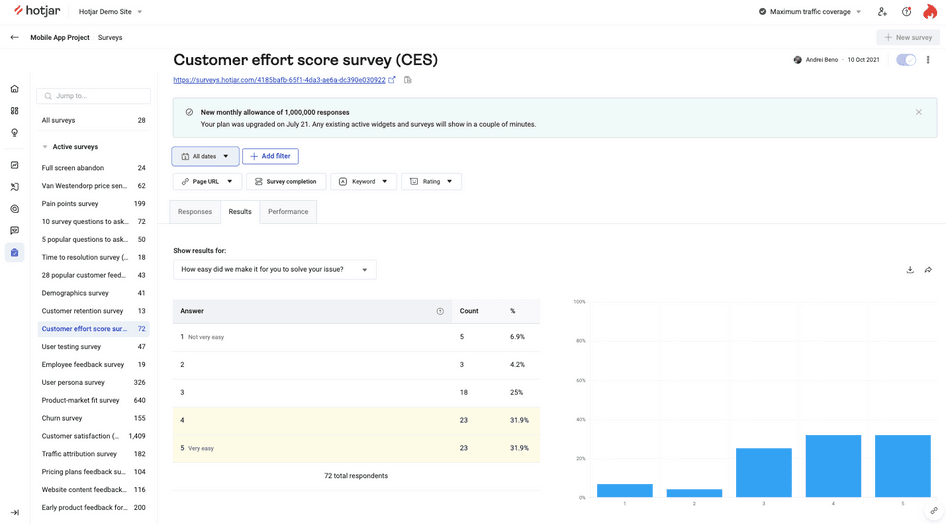
For example, the Hotjar customer effort survey results below have a total score of 272 ((23 x 5) + (23 x 4) + (18 x 3) + (3 x 2) + (5 x 1)) from 72 respondents. There were 5 options on the survey, so the CES is:
(272 / 72) / 5 x 100 = 75%
What is a good customer effort score?
According to the Corporate Executive Board (CEB), the creators of CES, a customer effort score of less than 70% indicates a need for improvement, whereas a score of 90% or higher is strong.
Increase customer retention with data
The quantitative retention metrics above will help you benchmark and track how well you’re retaining customers. But to actually improve retention, you need to see (and hear) what’s really causing people to leave.
Start with Recordings to see what customers see as they browse and Surveys to collect customer feedback, and you’ll soon have a list of optimizations to make to drive repeat purchases and turn casual shoppers into long-term fans of your brand.
Improve your customer retention with Hotjar
Hotjar has a wealth of UX tools that help you create a seamless experience for your customers. Improving your metrics starts right here!