Learn / Guides / Data analysis for marketers
How to use data analysis methods and techniques to create customer-centric marketing campaigns
Putting on your creativity cap to strategize a new marketing campaign is exciting—but what makes your hard work really feel worth it is when it resonates with your audience and performs well.
While some marketers might be lucky enough to find a winning formula on the first try, you need to use data analysis methods to guide your campaign strategy.

Putting customers at the center of your decision-making through data analysis helps you create relevant campaigns that connect with your audience and hit KPI goals. This guide reviews five data analysis methods marketers need to make informed decisions.
TL;DR
The types of data analysis a marketer uses depend on what you want to learn and which data type you have. Marketers use quantitative data—like website traffic totals—and qualitative data—like customer interview transcripts—in data analysis. There are also times when you should combine quant and qual data.
Five data analysis methods marketers use include
Descriptive analytics to summarize quantitative data
Inferential analysis to create and test customer hypotheses
Regression analysis to compare the relationship between variables
Content analysis to quantify text-based insights
Predictive analysis to anticipate trends and learn about customer behavior
5 popular data analysis methods for marketers
Marketers use data analytics to review performance, prioritize campaign updates, and understand customers. As you’ll see in the data analysis techniques below, the method you choose depends on what you learn and the data you collect.
The types of data marketers most commonly use are:
Now that you know the different types of information marketers collect, use the methods below in your data analysis process to get the best results, prioritize product updates, and inform your business decisions.
1. Descriptive analysis
When you want to measure what happened in the past, use descriptive analytics. This data analysis method summarizes quantitative data results, like how many likes a social media post got or your newsletter sign-up rate. Popular descriptive analysis methods include average, median, mode, and simply comparing survey response rates of a multiple-choice question.
How marketers use descriptive analysis:
Benchmark organic traffic each month to understand the impact of content marketing
Compare campaign engagement and conversion results to quarterly goals
Use surveys to measure how prevalent a goal or problem is in your customer base
Benefits and challenges of descriptive analytics:
Many people have some experience with straightforward analysis methods like calculating an average or ranking percentage response, which makes this method quick to implement
Data collection becomes easy through existing web analytics or short surveys
Quantitative data is objective, which means there’s no room for differing interpretations
There are limitations to descriptive analytics:
The process measures an outcome but doesn’t describe why customers chose the response or behaved a certain way
You may lack context about a problem if you only look at one particular data point
You need enough data points to have statistical significance if you want to apply decisions to your entire audience confidently
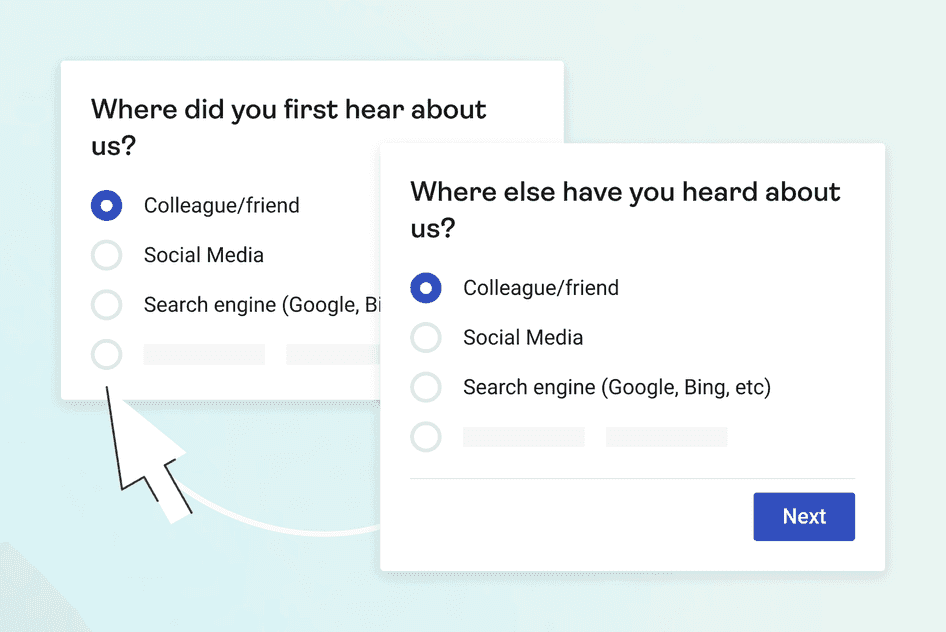
❓ Pro tip: use premade survey questions to easily collect customer feedback.
Asking your audience questions with multiple-choice surveys is a great way to collect quantitative data—assuming you ask the right questions. Your research questions need to be specific enough to get relevant data but not so detailed that you accidentally lead customers to the answer you want to hear.
Use premade survey questions and leverage Hotjar AI to generate survey questions based on your goals to collect the right data.
Here are some survey questions marketers can use:
Where did you first hear about us?
Where else did you hear about us?
What do you use our product/service for?
Which industry does your company belong to?
How relevant is the content you found on our website?
What was your first impression of our product?
Traffic attribution surveys reveal every channel customers hear about you through, instead of only seeing the referral source of your website analytics
2. Inferential analysis
Sometimes, you have a hunch but want to back up your ideas with data. Inferential analysis lets you hypothesize about your customers’ preferences and motivations by using a mix of multiple quantitative or qualitative data points. You create an inference by stacking insights observed at the same time.
For example, an Engagement Zone heatmap combines interaction data on a website page—like clicks and scrolling—to highlight the elements visitors engage with the most. If your heatmap reveals that a particular image or headline draws visitors in, you can use it in a future campaign to test if it drives engagement across other channels.
How marketers use inferential analysis:
Ask multiple questions in a customer interview and combine common themes to create a product narrative
Research customer preferences or priorities between item categories with surveys
Compare on-page customer feedback from different referral sources to learn about your audience coming from each traffic source
Benefits and challenges of inferential analysis:
Comparing customer responses across multiple questions or touchpoints gives you a fuller understanding of user behavior
Weighing customer responses based on specific conditions—like customer segments with the highest average order value—helps you prioritize which feedback and suggestions to implement
Creating hypotheses from actual customer interactions provides campaign ideas you may not have thought about before
There are drawbacks to inferential analysis:
Your hypothesis-building can be subjective, so look for multiple customer responses or data points that validate an assumption instead of relying on a single insight
You need to collect and manage multiple data sets, which can be time-consuming
An inference is an informed guess, so you still need to test your hypothesis with A/B testing
📹 Pro tip: follow up your A/B testing analysis with recordings.
Let’s say your A/B testing reveals that one campaign landing page far outperforms the other. Do you know why? Dig into why particular copy or design was so compelling using recordings—video playbacks of how visitors behaved on your site. Then, you can apply what you learned to future campaigns.
Hotjar Recordings lets you see what customers see
3. Regression analysis
Regression analysis is a powerful statistical analysis method that measures the relationship between data points, like comparing whether increased marketing spending is related to more revenue. The basic process of regression analysis involves plotting your two variables on a chart and then seeing how far those points stray from the regression line. There's a correlation if the data sits close to the line.
Since regression analysis includes multiple variables and some equations, it’s common to use a spreadsheet add-in or a tool like Tableau or The R Project.
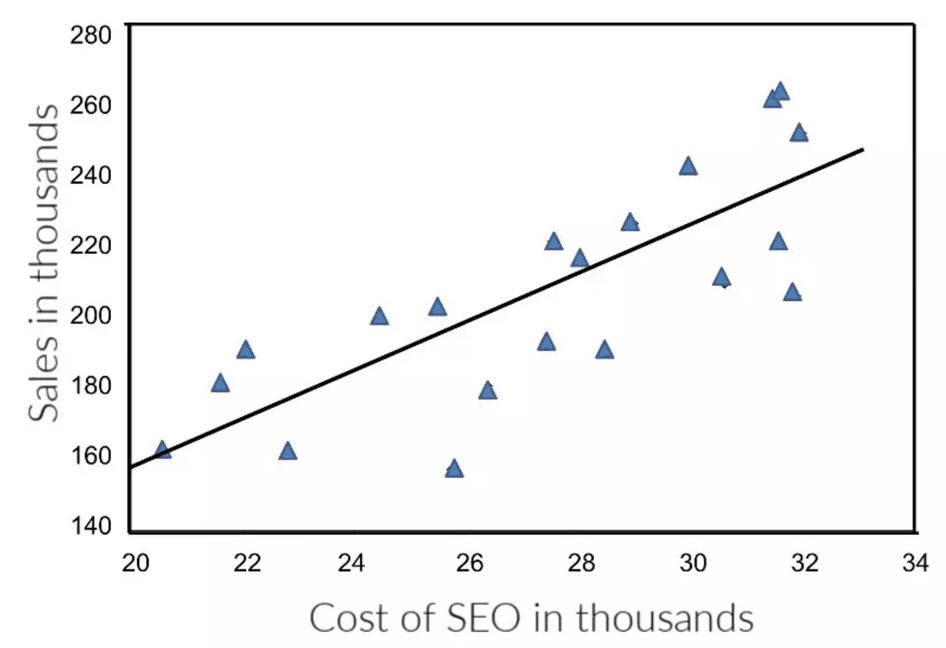
Linear regression analysis can help answer the question, ‘Does more SEO investment lead to more sales?’ Image via PracticalEcommerce
How marketers use regression analysis:
Discover which blogs shared on what social media channels resulted in the highest website traffic to update your social sharing strategy
Compare email engagement metrics to website sales to measure the potential impact of the channel
Learn which customer segment is happiest with your company and product through a survey to refine your targeting and messaging
Regression analysis benefits and challenges:
Measure how variables relate to one another to prove marketing impact
Evaluate what to do more of—for example, if you find a correlation between an investment or campaign and increased sales
Analyze large data sets using regression analysis tools and spreadsheets
There are downsides to regression analysis:
The process is a bit more complicated than simply checking your Google Analytics dashboard, so you’ll need a specialized tool or spreadsheet
Correlation isn’t causation, and you might not account for all potential variables that affect an outcome
A few outliers can easily skew results
4. Content analysis
Content analysis turns qualitative insights into quantifiable results to help you make conclusions about customer perspectives, perceptions, and motivations. For example, you can count how many open-ended survey question responses mentioned particular themes to rank their importance to your audience.
Pull content analysis data from open-ended surveys, recordings of real website interactions, interviews, reviews, testimonials, social comments, and brand mentions. You could even run a content analysis on competitor reviews to find what their customers dislike to position your brand against it.
How marketers use content analysis:
Compare repeating themes across customer interviews
Map the most common customer journey steps by watching recordings to learn how customers navigate your brand’s website before purchasing
Review testimonials to discover what stands out to customers to use in future campaigns
Benefits and challenges of content analysis:
You can pull from a wide range of data sources depending on what you already have access to and the time you have to research
Quantifying responses turns subjective responses into objective numbers
It’s easier to share customer response summaries with stakeholders than sharing multiple clips or large qualitative data sets
There are obstacles with content analysis:
Manual text analysis is slow, but there are tools like Lexalytics that help
There’s still some subjectivity involved since you decide how to group responses
Reducing long responses to simple ideas can leave valuable insights behind
🗂️ Pro tip: keep your insights organized with Hotjar.
Content analysis is time consuming (but impactful!) at the best of times, but you’ll quickly get confused without organization. Hotjar Highlights lets you save and share specific insights, like a high click rate on an image (from a heatmap) or a recording snippet from your newsletter page, to stay organized and collaborate with your team.
5. Predictive analysis
Predictive analytics anticipates future trends or analyzes customer behaviors with big data sets, predictive models, artificial intelligence (AI), and machine learning tools. In other words, it’s a bit advanced. However, marketers can unlock powerful insights, like when L’Oréal and Synthesio used AI to forecast beauty trends.
If you don’t want to work with a specialized agency or consultant, there are predictive analytics tools that help marketers without advanced data analysis skills pull insights from customer data.
How marketers use predictive analytics:
Uncover new customer segments based on small differentiating behaviors and psychographics
Find related products to recommend to customers based on past purchases for personalized experiences
Anticipate trends in your industry to create innovative campaigns
Benefits and challenges of predictive analytics:
You can review vast amounts of quantitative data faster than previously possible with technology like machine learning and AI
Nuanced customer insights and trend data give you a competitive advantage
Easily analyze customer behavior at scale, as opposed to manually reviewing a few interview transcripts
There are drawbacks to predictive analytics:
The output is only as good as the raw data input, so incomplete or inaccurate data within a large dataset can skew results
Collecting the volume and variety of data you need for predictive analytics can be time consuming
You’ll likely need to use a specialized tool or work with a data analyst
🚦 Pro tip: monitor customer behavior with Hotjar Trends.
Hotjar Trends lets you visualize your customer behavior metrics so you can spot trends easily.
For example, you can compare how customer segments interact with your pricing page to spot frustration or confusion that signals your marketing funnel needs an extra step. While trends don’t predict the future, continuous tracking gives you an early signal of wins or challenges.
Hotjar makes data visualization easy, with pie charts, line graphs, or bar graphs that give you a high-level understanding of user behavior
Combine data analysis with empathy to create effective campaigns
When you’re knee-deep in spreadsheets and up to your eyes in statistics, it’s easy to view customers as just numbers on the screen. Leading with empathy and curiosity will give you a new perspective on data analysis methods.
If you have a question, ask your customers in a survey. If you want to understand their motivations, chat with them in an interview. If you want to see how they move through your website’s marketing funnel, watch a recording of their behavior.
Your best strategies and campaigns come from a blend of data and humanity. Simply begin with a question or hypothesis and start investigating and analyzing.
Use customer-centric insights to drive your marketing campaigns
Hotjar’s tools give you a direct line to customers to learn about their goals, challenges, and preferences, so you create successful campaigns.
