Learn / Guides / Holiday readiness guide
How to use Hotjar to analyze your holiday traffic and optimize for year-round conversions
The holiday period doesn’t just bring extra sales: it also gifts you with more website data and user insights. Analyzing them with your team will reveal what worked well and what needs improving, and give your company fresh ideas to keep sales and conversions growing, even during the quieter times.

In this guide, we show you how to quickly analyze your holiday heatmaps, recordings, and feedback to grow and retain your customer base all year round—and ensure you’re prepared for the next bust period.
A SaaS company used Hotjar to increase sign-ups by 300%
It took the team at Brand24 just 12 hours to triple conversions using nothing but session recordings. Imagine what Hotjar could do for your business.

What you can use holiday UX data for

If you’ve been collecting user behavior data throughout the busy period, you can now use it to:
Measure if your holiday readiness optimizations worked as intended and report on your successes
See where users got stuck and fix bugs or obstacles before they get in the way of more sales
Compare holiday behavior to other periods to understand how holiday shoppers behave differently
Share insights with your team and stakeholders so everyone can understand the impact of their work on real users and customers, and get clear evidence of what to build or improve next
Benchmark and improve key metrics, like sales conversion rate, average order value (AOV), checkout rate, cart abandonment rate, and CSAT (customer satisfaction score), before the next holiday season

The Totally Promotional team reviewing a Hotjar Heatmap
How to use Hotjar to analyze holiday traffic and optimize for the next busy period
Assuming you’ve had Hotjar up and running while traffic was peaking, the next phase would be following the steps below to analyze your site’s performance and optimize conversions before the next busy period—because you know there’ll always be another one!
Analyze heatmaps on popular pages to see what got clicked or ignored
Heatmaps show you where users click on any website page. If you’re using Hotjar and had session capture enabled, our Continuous Heatmaps will have collected heatmap data everywhere the tracking code is installed—so it doesn’t matter if you forgot to set up specific heatmaps before the holidays. 😉

A Hotjar heatmap used on plant-based snack ecommerce Wyldsson’s homepage to increase sales
Follow these eight steps to get value from heatmap data collected during the high-traffic season:
1. Since heatmaps depict the collective actions of all users, they’re most useful on your highest-traffic pages for uncovering the most impactful insights: start by viewing heatmaps on popular pages like your homepage, category landing pages, and checkout flow.
2. Filter your heatmap by date (e.g., a single big day like Cyber Monday or your entire busy period) to see where holiday shoppers clicked, tapped, and scrolled during your chosen timeframe.
3. Compare your holiday heatmap against a pre- or post-holiday period of the same length to visualize how seasonality affects user behavior: do holiday shoppers click different CTAs? Are they more interested in certain information (e.g., returns or shipping)? Use any differences you find to promote and reposition relevant content next season.
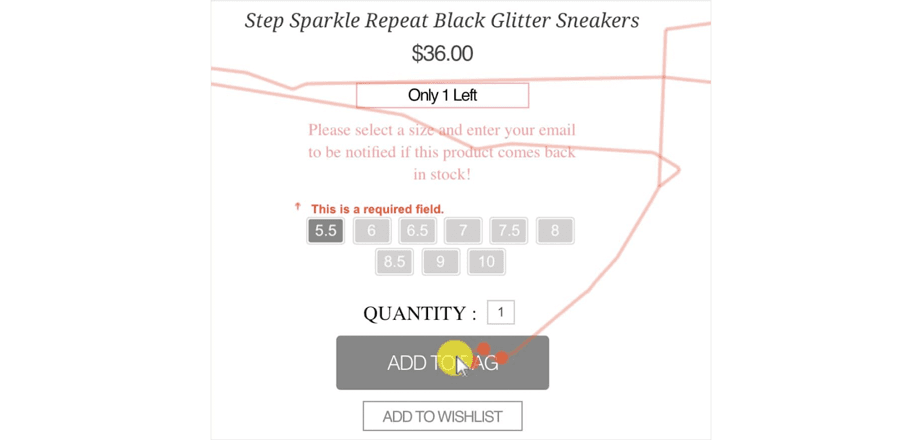
4. View a click map to see which elements got the most clicks during the busy period: were these your main CTAs? Were users bouncing by clicking other links?
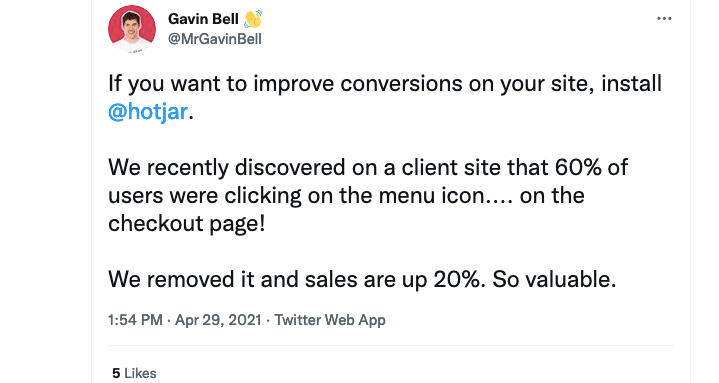
Gavin Bell, from lead-gen agency Yatter, used Hotjar Heatmaps to reduce unwanted clicks and improve checkout conversion rate
5. Look for ‘dead clicks’, i.e., non-clickable elements that get clicked a lot: are visitors getting confused or not finding what they need?
6. Check a scroll map to see the average scroll depth: are visitors missing important content below the average fold?
7. Compare mobile and desktop heatmaps: are there differences in click behavior and scroll depth? Are mobile users missing important CTAs? You may need to design different interfaces for mobile and desktop to ensure good UX across devices.
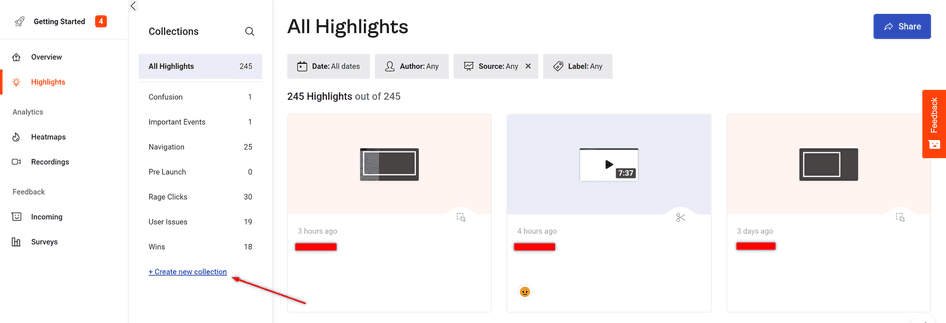
8. When you find an insight you want to action later, create a Highlight, tag it with a comment (e.g., “users are clicking the menu in checkout”), and add it to a Collection (a highlights folder; call it something like “Holiday insights to action”). Share relevant highlights with your team to make sure you’re showcasing your most impactful findings to the right people in your company. That way, nobody’s wasting time going through the same insights twice, and everybody’s attention is focused on the highest-impact fixes and optimizations.
Filter, clip, and share the most revealing Recordings with your team
Session recordings recreate real user browsing activity across your entire website. If you had Hotjar’s tracking code added to your site and session capture enabled, our Recordings tool will have automatically tracked sessions across holiday visitors’ full journeys (the maximum number of daily sessions recorded depends on your plan).
Part of the Hotjar Recording used by Ecommerce Warriors to find a usability issue that caused visitors to bounce
Here are eight ways to efficiently analyze your holiday recordings and use the insights to optimize your site:
1. Filter your Hotjar Recordings by date to view sessions captured during the high-traffic period.
2. You’ll (hopefully!) have too many holiday recordings to watch them all, so filter recordings to cut straight to the impactful stuff: add an Exit page filter with your Shopping Cart or Checkout as the URL to find sessions where people left just before purchasing, and look for what might have led to the bounce. Save your favorite filters as Segments to apply them quickly next time.
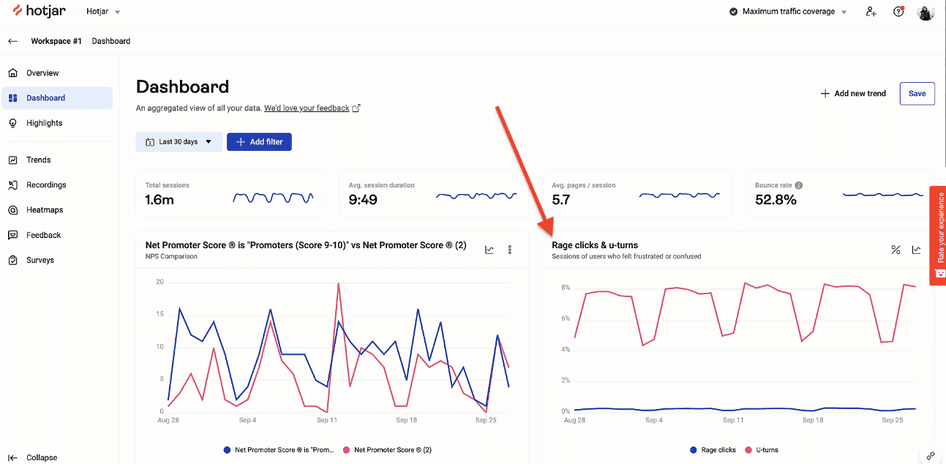
3. Check the Hotjar Dashboard for the Rage clicks and u-turns widget: you’ll see how each trended over the busy period. Click to view recordings containing each type of behavior to investigate what happened.
4. Filter by Referrer URL to compare browsing behavior from different sources (for example, organic search vs. paid ad campaign) and look for patterns: did users coming from ads result in more or fewer rage clicks and bounces? This will help you improve marketing budget allocation and messaging next season.
5. Hotjar automatically tags Recordings by ‘Relevance score’ and predicts how useful each might be based on the session duration, pages visited, and click behavior in each: click to sort sessions by relevance and watch the ‘very high’ and ‘high’ ones first to save time.
6. If you’ve run surveys or collected feedback during the busy period, watch Recordings of users who left feedback by viewing your Survey or Feedback results and clicking the black play icon where available. This will give you some of the context behind each Recording and help you make stronger conclusions about what the user was experiencing and any changes you need to make as a result. Start with recordings of users who left ‘dislike’ or negative comments to understand why they weren’t satisfied.
7. When you find a recording clip you want to action, save it as a Highlight, and you won’t need to waste time re-watching it or struggling to remember which bits to share later.
8. Organize a watch party and invite your team to watch selected recordings together (in the meeting room or via Zoom!). Bring people from different departments together.
Your product managers and developers will appreciate seeing how real people interact with the functionality they build, your design team might get inspired to tweak page layouts and element hierarchy, and your leadership team will be motivated to give you the resources you need to make improvements. Start from your Highlight clips and brainstorm possible solutions with your team while watching.
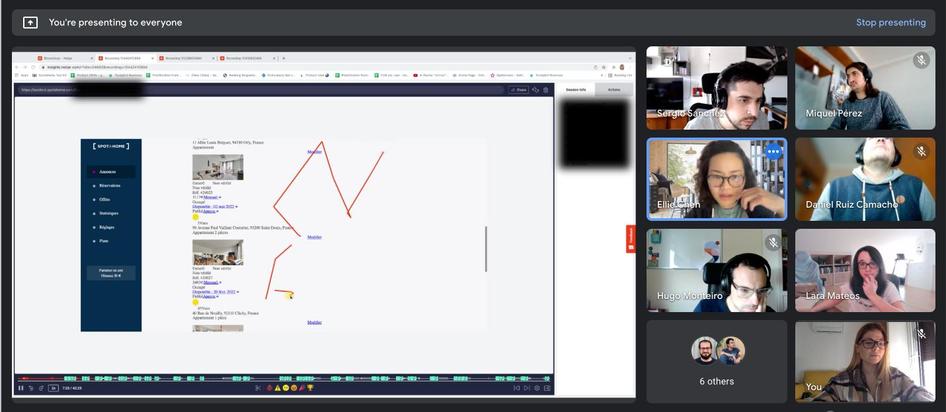
The Spotahome team reviewing Hotjar Recordings together 🍿
Analyze feedback from your holiday customers
If you set up a survey or had Hotjar’s Feedback widget running on your site during the traffic peak, you’ll now have plenty of user feedback to sort through. You'll get just as much (if not more) from the negative feedback as the positive, so brace yourself for some home(page) truths before you dive in!
Here are four efficient ways to collect, quantify, and action feedback from your holiday shoppers:
1. Make a copy of our open-ended question analysis template: this will help you categorize and quantify all your feedback so the biggest issues rise to the top.
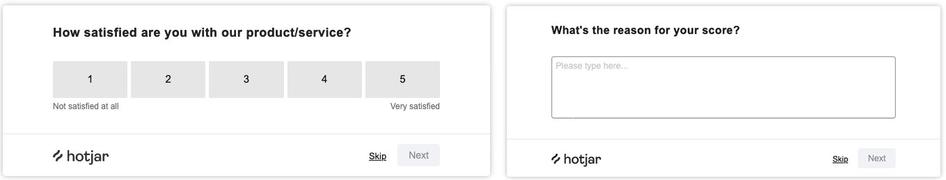
2. Analyze the results of your CSAT survey or post-purchase survey to measure how satisfied customers were with their experience: the Likert scale responses will become a benchmark metric for you to improve by the next busy season, plus responses to the open-ended follow-up question will tell you what led to high or low levels of satisfaction.
3. Analyze the results of your exit-intent survey to understand what caused visitors to leave without making a purchase. You might assume that holiday shoppers leave because they were just browsing or looking for deals, but there are often fixable UX issues that stop people completing the checkout process.
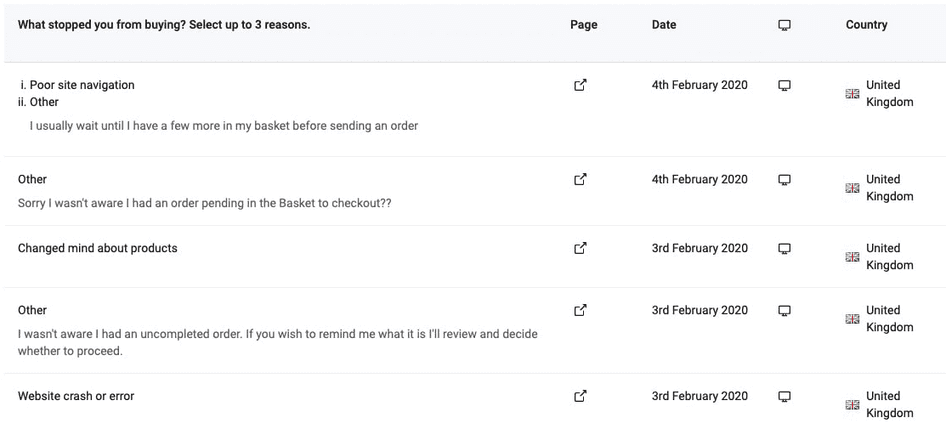
Results from an exit-intent survey run by agency NerdCow revealed that visitors were leaving due to fixable website issues
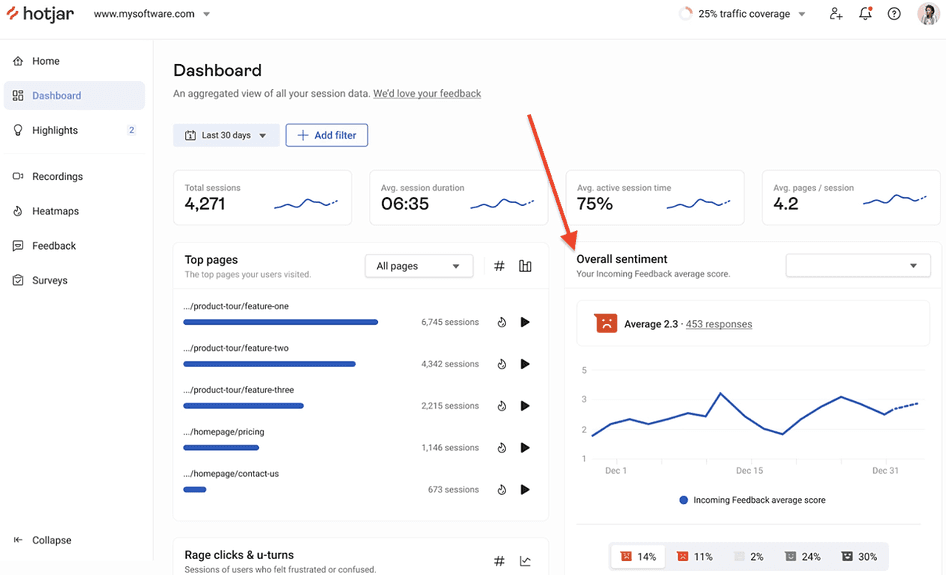
4. Go to your Dashboard and look at the ‘Overall sentiment’ widget to see a summary of all the feedback you collected: filter by negative responses, then look for peaks. Click through to see Recordings from users that left negative feedback, and you’ll see the context behind their comments.
Advanced filtering and data connection tips for premium users
If you’re signed up to one of Hotjar’s premium plans, follow these five advanced tips to apply valuable filters to your user behavior insights and connect them with data from other platforms:
1. Apply advanced filters with Hotjar’s Trends tool
Use Trends to filter your heatmaps, recordings, and feedback by any audience segment and visualize and monitor custom metrics over time in the Dashboard.
2. Analyze your experiments even more closely
If you ran A/B tests during the holiday season, look at recordings, heatmaps, and feedback from winning variants to understand why they performed well and get ideas for future tests. Even if your test is over, you can view Heatmaps of test variations by applying URL or session filters.
3. Learn exactly what made your users convert
Use Events to filter for specific actions, like a user clicking a CTA or saving an item to a wishlist. Filter insights by your most valuable customer actions to pinpoint what led them to convert so you can optimize the customer journey for others.
4. Get insights customized to your site
With User Attributes, connect your Hotjar insights with any other customer data—for example, from a support ticket, UTM campaign, or sales data—to get more context behind customer behavior. For example, you can view session recordings of users who spent over $200 during the holidays and see what convinced them to complete their purchase.
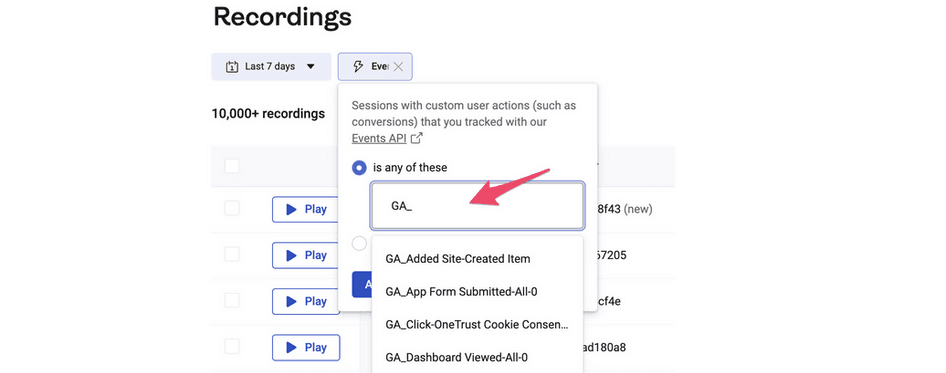
5. Integrate Hotjar with Google Analytics
Connect Hotjar with Google Analytics to see the real user behavior and feedback behind any GA metric. For example, if you want to understand why new customers converted worse than returning customers during the holidays, filter by GA Event (in this case, to include the ‘first_visit’ GA event) and watch Recordings of how new users behaved.
💡Pro tip: your conclusions will be stronger if you collect unsampled UX data—by tracking every possible interaction, you can be confident that every decision you make is based on full coverage and not fragments of data.
The holidays are over, but your UX improvements aren’t
Analyzing holiday user behavior data will help you fix bugs and optimize for conversions in the short term, but for long-term growth, you need to make reviewing and actioning these insights a regular part of your workflow.
The more user behavior data you collect over a longer period, the better positioned you’ll be to spot patterns, fix issues, and ideate new design optimizations. One holiday period may just be over, but there’ll always be another one—and it’s never too late (or early) to start optimizing your website to improve the metrics that matter to your business.
Learn from your website’s holiday performance
Hotjar’s tools help you fix bugs, improve conversions, and drive sales year-round. Analyze past performance to make sure you’re ready for future success!