Learn / Guides / Performance reporting guide
How to use website performance reporting to improve the user experience
Website performance reporting helps businesses zero in on the good, the bad, and the ugly of their site—showing them what’s running smoothly, what needs improvement, and how to create a better user experience.

Tracking website performance is essential to maintaining an excellent site, loyal and delighted customers, and a smooth stream of conversions.
This chapter of our performance reporting guide takes you on a step-by-step journey to creating a website performance report, with examples and metrics to better understand how people interact with your site, so you can elevate their experience.
Use Hotjar to go deeper into website performance reporting
Hotjar helps you boost your website optimization efforts with product experience insights that traditional performance reporting doesn't cover.

What is website performance reporting and why is it important?
Website performance reporting is the practice of testing and analyzing a website's performance in relation to metrics like traffic, speed, SEO, and user insights. This helps you understand which changes you need to make to improve the user experience (UX) and drive business growth.
When you keep a check on website performance, you zero in on issues faster and take data-informed actions to resolve them, preventing damage to your customer experience (CX), reputation, and your business’ bottom line.
Other major benefits of monitoring and reporting your website performance are:
The essentials of website performance reporting
Basic metrics like website speed, SEO, and traffic analysis only ever tell part of the story behind your website’s performance. If you want an in-depth, holistic view of your website’s current performance—and how to build a roadmap for its optimization—you need knowledge of the user experience.
A comprehensive and actionable website performance report looks at both quantitative and qualitative data to understand what is and isn’t working on your website and why that’s happening:
Analytics-based monitoring data gives you important insights into your website’s performance, like tracking user traffic and understanding which key performance indicators (KPIs) correspond to key user actions—such as leaving your site or making a purchase.
Real user monitoring data or a user-centric approach involves tracking website performance while a real user explores your website, and helps you understand the context and motivations behind their behavior.
When you focus on improving basic website performance metrics—like page speed, conversion rate, or average session duration—and complement them with user-driven insights, you can be sure that it’ll make a big difference in your website’s overall performance and quality.
Numbers in isolation can be deceiving, and they don't enable you to build a comprehensive enough picture of your website's performance.
The best way to tackle this is to layer in qualitative insights, too, to get a fuller picture of the user experience. Combined, you can make better judgments that ultimately help you deliver a better website experience.
A 5-step framework to make the most of your website performance reporting
Given the benefits of monitoring your site, good website performance reporting helps you maximize results for your business and create user-centric experiences for your customers.
Follow this step-by-step framework to create a website performance report that paints the full picture on:
Which KPIs and metrics are most relevant for your user and business objectives
What’s going right and wrong as users navigate your website
How you can improve performance and optimize your results
1. Get a clear understanding of your business goals
You need to determine specific business goals, benchmarks, and KPIs to get the most out of your web performance reporting efforts.
Before you dive into optimization tests, ask big-picture, broad, and strategic questions to get clear on the key aims of your website:
What user problems is your website designed to solve?
What’s the overall goal of your site?
What’s your website’s unique selling point?
Then, fine-tune your strategy toward reaching your goals by selecting strong KPIs for revenue and other metrics you can use to measure your progress, such as:
Monthly website traffic
Call to action (CTA) conversion rate
Search engine results page (SERP) rankings
Customer acquisition cost (CAC)
Number of marketing qualified leads (MQLs)
Asking questions and defining objectives helps you move beyond assumptions and ensures that every decision you make about your website’s performance will impact your end-user and organizational goals.
2. Define website performance KPIs to measure progress
The next step after defining your goals is measuring your progress on each objective. That means defining website performance metrics that measure granular details and tell you what’s working on your site—and what isn’t.
Monitoring these metrics over time will also provide you with benchmarks so you can set data-based objectives for your website’s performance.
Page speed
This metric measures connection speed. That is, how fast your website loads when someone visits a specific page.
Why it matters: any slow-loading web page can negatively impact the user experience. A slower response time means fewer customers, less engagement, dwindling conversions, and lower sales.
Page speed is also a key ranking factor for search engines, and your position in the SERPs will take a hit if your site takes too long to load.
How to establish a benchmark: research your industry’s norms for page speed objectives. In general,your site should take less than five seconds to load. But if you have an ecommerce store, your website shouldn’t take longer than three seconds to boot up.
(💡Perceived performance is another interesting, but subjective, measure of website performance: it focuses on how fast a website seems to the user rather than technical metrics, and is crucial for user-centric optimization.)
Page views
This metric measures the number of times visitors land on a specific web page.
Why it matters: tracking page views lets you see which pages attract traffic and which get overlooked. Use these patterns in user behavior to inform decisions on which website UX design changes will have the most impact.
How to establish a benchmark: lean into your website’s historical data and report on the average number of views across all your different pages. Take note of specific web pages that experience significant boosts in traffic over a particular period.
Conversion rate
Conversion rates reflect the percentage of visitors who complete a desired action on your website—like making a purchase, opting into an email list, or signing up for a free trial.
Why it matters: a good conversion rate indicates that you’re achieving one of your most important goals—turning traffic into leads or paying customers.
How to establish a benchmark: look at your site’s historical data. Use a tool like Google Analytics to research your average conversion rate over time and work on improving your metric.
Note: conversion rates vary between industries, but anything between 2–5% is considered good.
Pro tip: understand your customers’ wants and needs to improve conversions.
A low conversion rate can be a sign that you aren’t connecting with your users effectively. Use Hotjar Ask to dig deeper into customer problems and pain points, get to know them better, and optimize your website performance accordingly:
Feedback widgets help you understand why people visit your site in the first place by letting you hear from customers right on your homepage
Surveys help you investigate what prevents conversions by allowing you to question users who drop off your site or unsubcribe from your service to figure out what influenced their decision
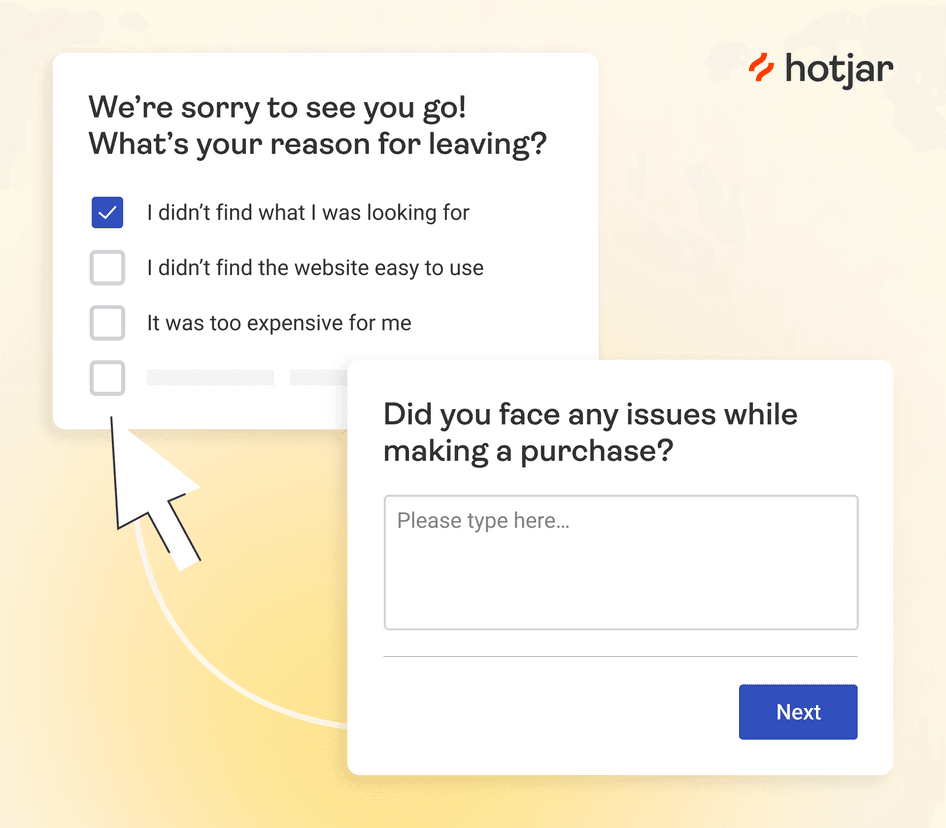
Hotjar Surveys let you obtain accurate data from visitors in real-time
Bounce rate
Bounce rate measures the percentage of visitors who access your website and leave immediately, without continuing to view other pages.
Why it matters: a high bounce rate indicates that users may be confused or uninterested in the content you’re presenting. If your website depends on users navigating through multiple pages—like product or feature pages—this can be particularly damaging.
How to establish a benchmark: use website performance monitoring tools and calculate your site’s average bounce rate over a month for future reference.
Scroll depth
Another metric that relies on user attention, scroll depth measures how far down users scroll on one of your webpages.
Why it matters: this type of insight highlights which site elements users engage with and when you lose their attention. Scroll depth helps teams make design decisions that foster great UX—like what information to place above the fold, how to optimize your page layout, or what to adjust in your web page copy.
How to establish a benchmark: for scroll depth, benchmarking helps you understand what works well above and below the fold. Along with metrics on how far your users scroll on a given webpage, this lets you optimize your layout accordingly.
Average session duration
This metric analyzes how much time people spend on your site during one visit.
Why it matters: the average time of user sessions on your website speaks to how engaged visitors are and whether they’re interested in your content or what you have to offer.
If you want to know why people spend a long or short time on your site, you’ll need to use tools like Hotjar Recordings, which show you what your customers do throughout their sessions.
How to establish a benchmark: it’s helpful to investigate industry averages and pair them with your historical data. Even though 2–3 minutes is considered a good ecommerce average session duration, only you know if your website would benefit from shorter or longer sessions based on its design.
Pro tip: dive deeper into website performance metrics with qualitative insights.
Use Hotjar Observe and Ask to complement your quantitative website metrics with key qualitative insights from your users.
Once your research pinpoints where your performance is lacking, collect user feedback to explore why—and what you can do about it.
For example, start by reviewing heatmaps to highlight unpopular elements on your homepage. Then, collect voice-of-the-customer (VoC) feedback using surveys and a feedback widget to understand why people don’t like those elements.
Qualitative insights like these lead you in the right direction to make recommendations to optimize your website performance, and provide your customers with a smooth, consistent, high-performing site.
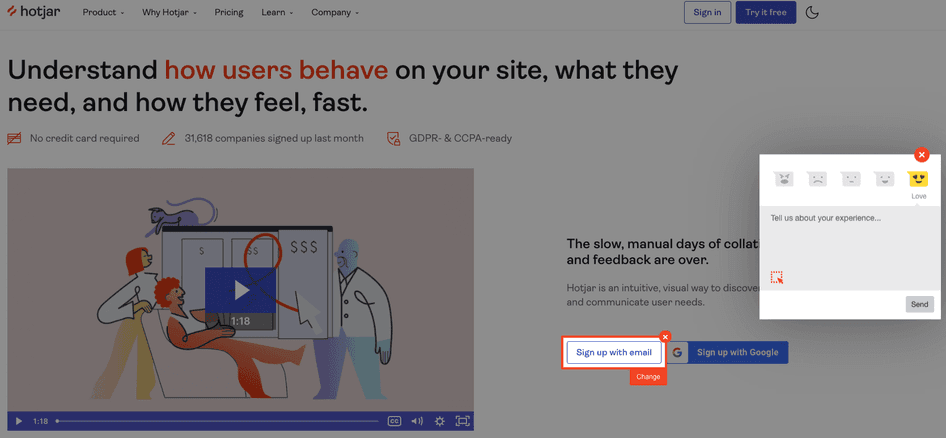
The Hotjar Feedback widget gives you valuable user-backed insights to increase customer satisfaction
3. Run a comprehensive website analysis
A website analysis uses traditional analytics tools, SEO investigation, usability tests, and user-centric evaluations to ensure every component of your site is in optimal working order.
Everyone wants a site that runs fast, ranks well on Google, and has no significant usability issues. Standard website analysis helps you achieve all of the above. But you can leverage another form of insight, which is 100% unique to your website: your users’ perspective.
Analyzing your website from a user-centric point of view reveals how people use specific features, what they want from you, and how to turn them into loyal customers. This type of analysis gives you the holistic insight you need to build a great website experience for the people who visit your website day in and day out.
Here’s how to run a website analysis that evaluates performance based on both traditional analytics and user-centric insights:
Perform a basic website analysis
Analyze website traffic: this helps you monitor the activities of users on your site and identify the most successful pages and traffic-generation techniques
Audit your site’s SEO process and results: check your search engine rankings and authority, make sure your site is up to date with on-site SEO best practices, and perform a backlink analysis
Measure your page speed: run a speed test to investigate your load time using WebPageTest or Google’s PageSpeed Insights for both desktop and mobile devices
Check for website errors: use the Google Search Console to identify performance issues and fix bugs—like broken links and error pages—that frustrate users and cause Google to penalize you
Analyze mobile responsiveness: use Google’s mobile responsiveness checker to ensure your website looks and functions well on any screen size, and that it loads fast on mobile
Perform a user-centric website analysis
Find what drives people to your website: use on-site surveys to discover your visitors’ drivers by asking them to describe what they're looking for on your site, and why, in their own words
Define the barriers that stop or drive users away: run a funnel analysis to identify the high-traffic exit pages where you lose most of your visitors. Then, analyze heatmaps and recordings to understand how individual users interact with them.
Find what persuades people to act: use a survey or a feedback widget to collect insights from visitors and better understand the hooks, or selling points, that persuade them to stay on the page and eventually convert, and their fears or objections to taking action.
Use strategic tools to discover the weak aspects of your website
The right website analysis tools can help you identify user pain points and streamline the process of finding solutions to optimize your website’s performance.
Leverage these types of tools to generate a full-picture website performance report that covers all your bases:
Web analytics tools like Google Analytics, to understand the quantitative performance of your website and spot trends in user behavior
Web performance monitoring software like GTmetrix or Pingdom, to see exactly how your site is performing and what to improve
SEO tools like Clearscope or Ahrefs, to ensure that your content has the right keywords
A/B testing tools like Google Optimize or Omniconvert, to see which UX design variant resonates with users
CRM platforms for insights into persona-based purchasing history, past user interactions, and sales figures to draw connections between spikes in website activity and conversion
Heatmaps of user activity on your web pages to see where visitors click and how far they scroll to determine if you’re creating an engaging, intuitive user and website experience
Session recording tools to observe how users experience your site and whether your web design, content layout, and navigation elements make sense throughout their journey
Feedback widgets on key areas of your site to ask people if you’re creating an intuitive user experience and what you could improve
Pro tip: use Hotjar’s behavior analytics tools and feedback insights for a full website analysis.
Your users are the extra source of knowledge you need to grow your website and business—they have all the information you need about what’s working (and what isn’t) on your website.
Hotjar helps you collect this knowledge to answer valuable business questions, such as:
Where on a page do users get stuck and struggle before dropping off?
How do people interact (or fail to) with individual page elements and sections?
What are they interested in or ignoring across the website?
What do they actually want from the website or product?
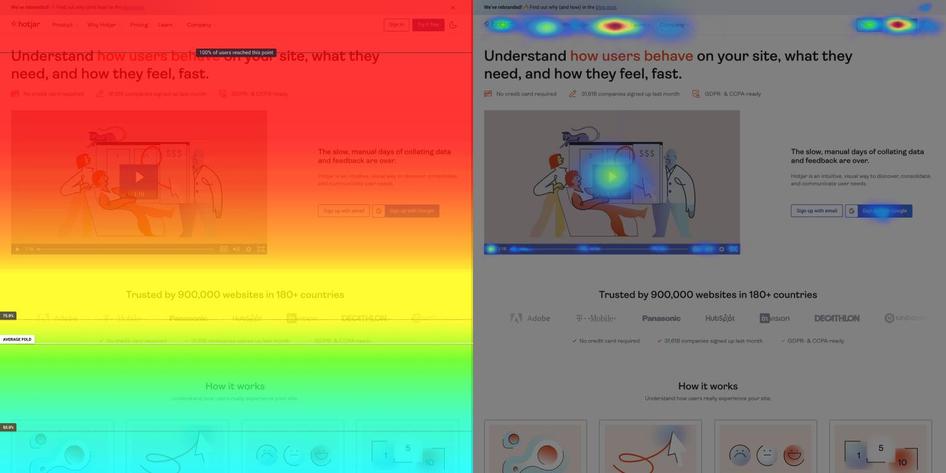
Hotjar Heatmaps show you important patterns in user activity on your website
4. Summarize your findings and develop an action plan
As you go through these evaluation steps, your website’s strongest and weakest points will become apparent. Some areas might need more investigation and details, but you should have enough data to make informed recommendations on where you could improve your website’s performance.
As you develop an action plan with a set of next steps—and suggest priorities—ask yourself specific optimization questions like:
Is your page load time affecting user retention?
Is your website easy to find and navigate?
How targeted is your keyword research?
Are you optimized for mobile?
How much increase in conversion rates did you expect? How much did you get?
Which website pages do you need to optimize for maximum impact and conversion?
This plan will outline all your user goals—aligned with your business objectives—and list the actions or steps to achieve these goals.
Ask a mix of big-picture and specific optimization questions to help you understand, implement, and track changes. Develop clear hypotheses on what you need to optimize to meet user and organizational goals—and then validate your idea by testing it out with users.
Leverage user insights to sharpen your intent
To help focus the intent behind your questions and hypotheses, turn to the people who matter most: your users.
User interviews, surveys, and feedback tools help you test your existing assumptions about your website while giving you direct insight into what you need to prioritize. They also direct your attention toward the most pressing user issues and validate your website optimization strategies, reducing ineffective decisions based on guesswork.
Ask users to share their opinions about everything from UX design and content relevancy, to page speed and usability across devices. Learning directly from your users about their experience with your website is the first step to addressing those issues and improving web performance.
Even after implementing initial website optimization techniques, keep checking in with your users to guide further insights and refine your priorities and process.
5. Tie it all together in a website performance report
Once you’ve evaluated your website from all possible angles and completed the initial research, you can wrap everything up into a website performance report and present your findings.
By consolidating and comparing the results from each of these types of analysis, you’ll be able to build a report that:
Triangulates the key issues that are affecting your site’s performance
Develops a website performance summary of changes and actions
Offers a broad overview of quantitative and qualitative data
Starts chalking out a game plan for website performance optimization
Keep your presentation user-focused with a data-informed strategy and roadmap. Engage your future audience with visual aids that use graphic elements to present website performance data and insights in a way that’s easy to follow and interpret.
Next steps to website performance reporting
Your website reporting process should adapt as your website evolves. A big part of website performance reporting is ensuring your platform reflects the key values of your product and brand, and helps users meet their needs.
With the right planning, website performance reporting doesn’t have to be daunting or overwhelming. Instead, it becomes a dependable process you can repeat each time you need to review web performance and continue your journey toward an optimized website.
Use Hotjar to go deeper into website performance reporting
Hotjar helps you boost your website optimization efforts with product experience insights that traditional performance reporting doesn't cover.