Learn / Guides / Quantitative data analysis guide
The top 9 quantitative data analysis tools you should try in 2024
Quantitative data analysis software helps you track how well your website is doing, understand which marketing channels bring in the most traffic, and increase your chances of turning visitors into customers. But with so many analytics tools to choose from, finding the right solution for your needs can take time and effort.

To help you narrow down your options, we’ve compiled a list of the top nine quantitative data analysis tools, along with helpful tips on choosing the best tools for your needs. We also share some practical ways to pair Hotjar with your chosen tool to gain in-depth user insights and increase customer delight.
Gather quantitative user insights with Hotjar
Use Hotjar Funnels, Heatmaps, and Trends to collect user insights, measure customer satisfaction levels, and improve the user experience.

9 quantitative data analysis tools you should consider adding to your tech stack
Quantitative data analysis involves analyzing and interpreting numerical data to identify meaningful patterns and trends in user behavior.
For example, if you want more people to sign up for your product, you can use quantitative data analysis to learn how many people looked at your product or pricing page, how long they stayed on these pages, and how often they signed up.
The true purpose of analytics is to help you make good decisions. If you have an idea, you can use data to check the concept. Is it likely to affect a lot of visitors? Just a few? And once you make the changes, you can use data to see how well it worked. Did it make an impact? Was there a measurable change?
To help you stay on top of your site’s performance, let’s explore the best nine tools for quantitative data analysis, including what each tool does, why you should consider adding it to your tech stack, and how to use it.
1. Google Analytics
Google Analytics is a (very) popular website analytics software for quantitative data analysis and research that lets you track what's happening on your site.
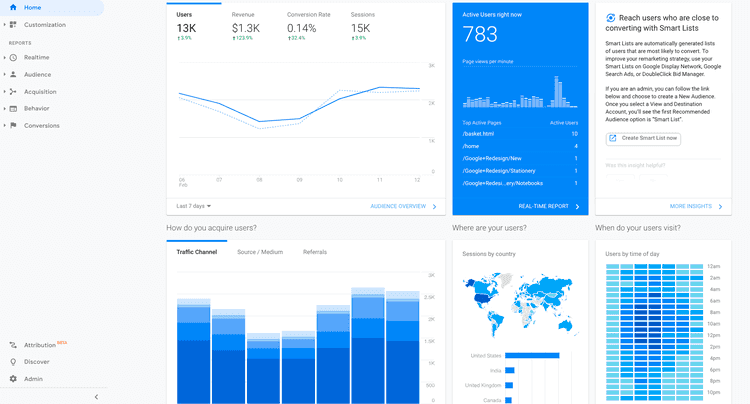
How it helps: use Google Analytics to monitor website user behavior and learn
How many people visit your site
Where they come from (search engines, social media, or referrals)
What devices they use to access your site (desktop or mobile)
Which pages they visit
How long they spend on each page
Which pages are the most popular
Where visitors drop off
How to use it: to start using Google Analytics, create an account and set up a property for your website or app. Once you've set up the software, it automatically collects data on every page view, bounce, drop off, and conversion. You can also configure goals, set up conversion tracking, create custom reports, and explore user behavior in real time.
Note: from July 1, 2023, Google Analytics Universal no longer processes data, but the Hotjar integration remains functional.
💡 Pro tip: use the Hotjar and Google Analytics integration to gain deeper insights into how users interact with your website.
For example, say you want to optimize the checkout process for your ecommerce site to reduce cart abandonment rate. Google Analytics shows you what’s happening on your site, but it doesn't tell you why the drop-offs occur. Hotjar, on the other hand, helps you understand the 'why' behind those numbers.
Take session recordings, for instance:

Session recordings let you see exactly how users navigate through the checkout process and spot potential issues that made them drop off
Recordings let you observe users' mouse movements, clicks, and hesitations, helping you uncover specific areas where they might get confused or frustrated.
Combining quantitative and qualitative data gives you a more complete understanding of user behavior, which empowers you to identify and address specific issues, optimize your site’s UX, and ultimately increase your conversion rates.
The problem is that Google Analytics on its own isn’t enough. It tells me that 100 people have visited a page, whereas Hotjar shows how one specific person engages on a specific part of the page—that’s invaluable!
2. Hotjar
Hotjar (that’s us 👋) is a product experience insights and behavior analytics platform with quantitative and qualitative tools and features that help you
Observe user behavior with funnels, trends, session recordings, and heatmaps to see what users are doing on your site and where they're dropping off
Ask for direct feedback through feedback widgets and surveys to understand why they're dropping off
Engage with users and customers through one-on-one interviews
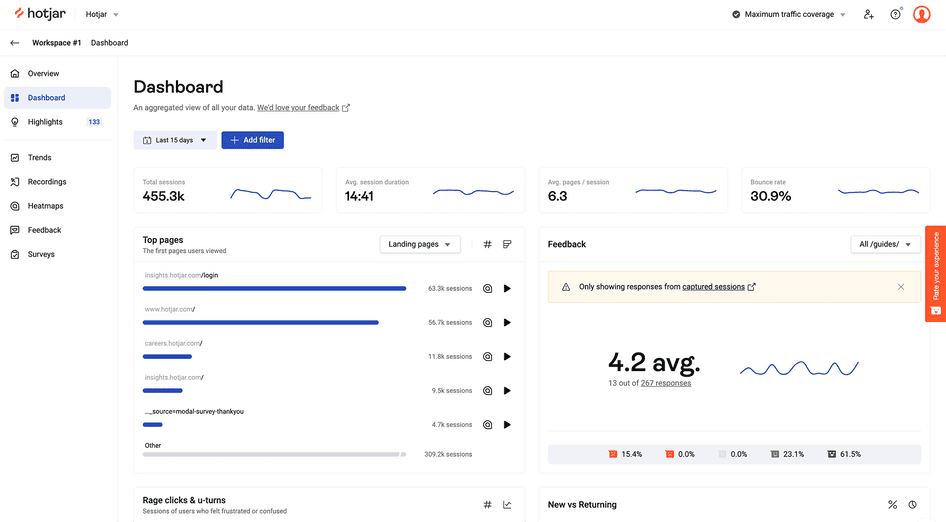
How it helps: Hotjar shows you what your users do on your site and why—you can access visual quantitative and behavior insights, real-time user feedback, and one-to-one interviews, all in one place.
For example, Hotjar Funnels measures how many users converted or dropped off, and Recordings shows you their entire experience while using your site, so you can tell why they dropped off. You can also combine behavior analytics insights from Hotjar with quantitative data from traditional tools like Google Analytics or Mixpanel to
Get a more complete picture of user behavior
Pinpoint specific issues your users might be having
Improve the overall user experience
Ultimately increase conversions
How to use it: if you're looking to use Hotjar for quantitative data analysis, you can approach it in many different ways since our tools and features complement each other. Here are three ideas to help you get started.
1. Use heatmaps to identify where visitors click on your most important pages
When it comes to optimizing your site’s UX, relying on gut feelings or copying competitors won’t take you far, especially since your audiences aren’t exactly the same. You need specific insights about your own users to understand and improve their experience.
Heatmaps show you how users interact with your most important pages—how far they scroll, which elements they ignore, and the buttons they click (or don't click), which helps you identify obstacles that keep them from converting and make informed changes.
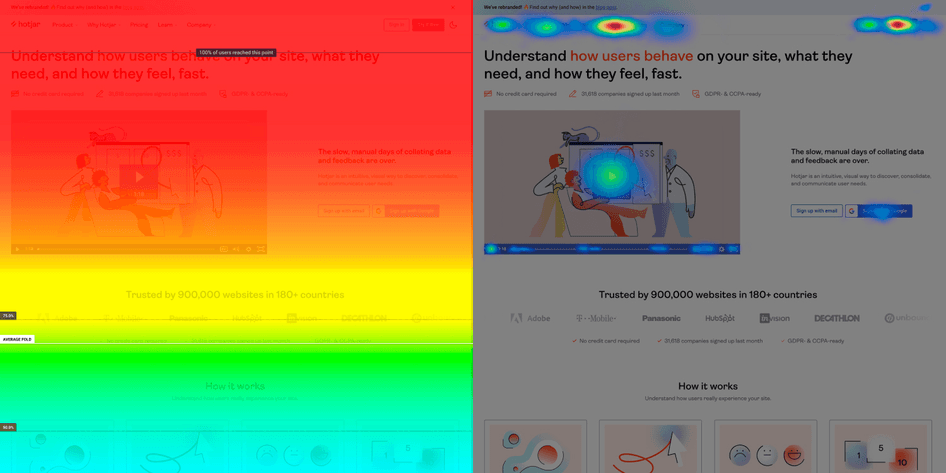
For example, software company TechSmith used Heatmaps to find out where visitors click and how far they scroll on their most important pages. The team found many website visitors clicked on their product icons instead of the CTA buttons. After optimizing those areas, they created a better experience for prospects.
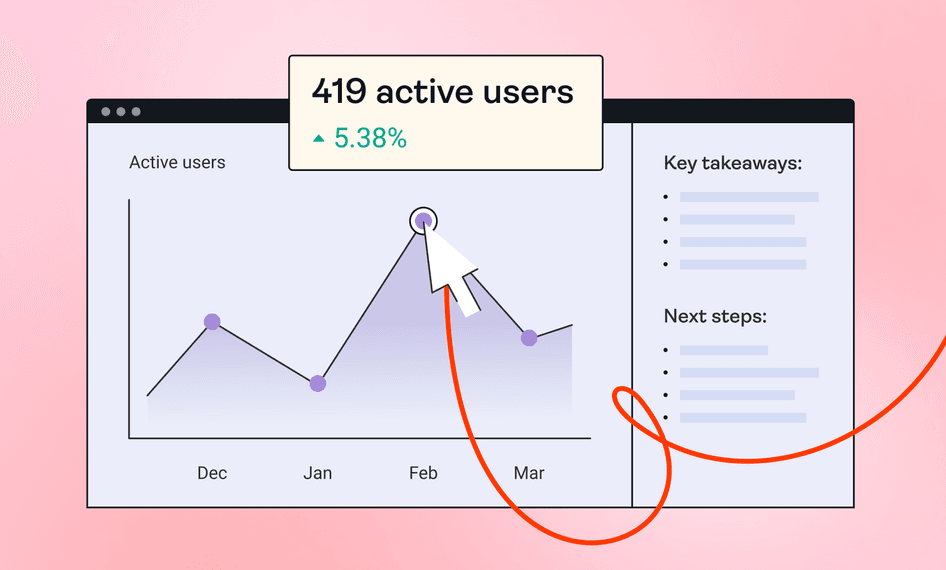
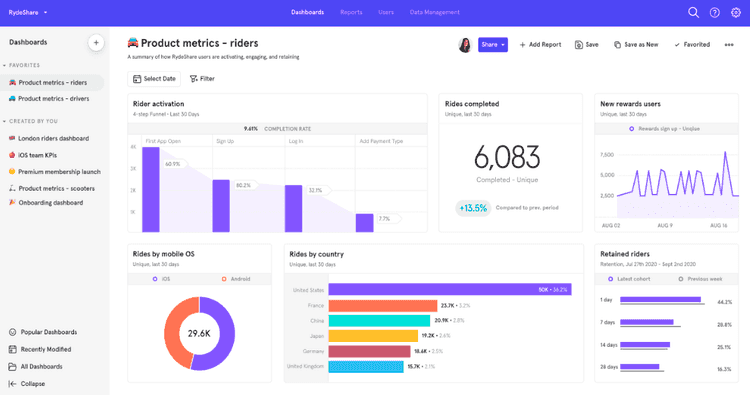
2. Use trends to spot patterns in user behavior
Hotjar Trends gives you the complete picture, so you can visualize your metrics, uncover patterns in user behavior, and understand the real 'why' behind the numbers. Trends let you
See your custom conversion metrics and track their changes over time
Review individual recordings to discover the reasons behind the metrics
Analyze errors spotted in recordings or patterns in rage click maps to determine if the behavior is isolated or widespread
For example, to make your site's checkout process smoother for users, you can use Trends to visualize the checkout conversion rate over time and notice any changes. To better understand their behavior, you can review individual session recordings to see why users abandoned the checkout process and where they struggled.
Trends also lets you segment your data based on user groups, such as new versus returning customers. By comparing their behavior, you may find new users have a higher cart abandonment rate than returning ones, which helps you focus on improving the onboarding process and providing clearer instructions to new users during checkout.
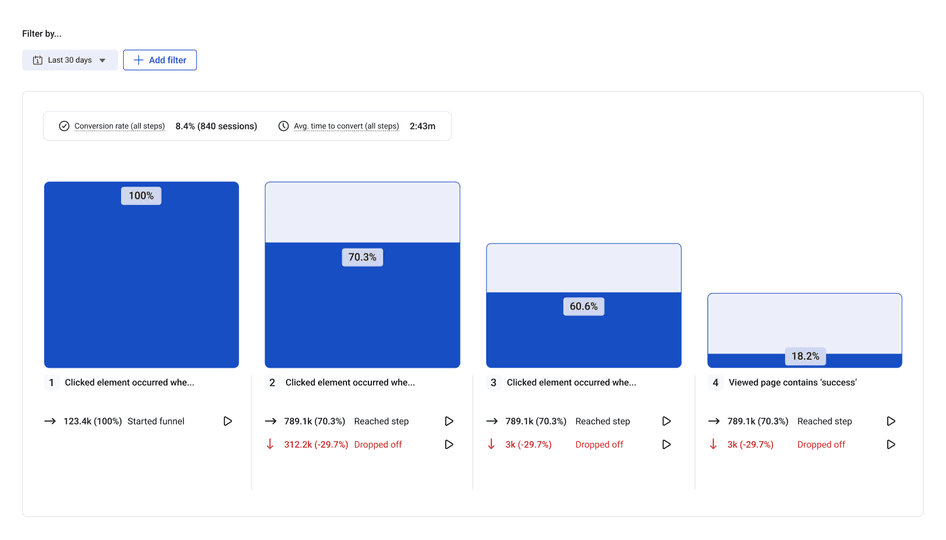
3. Use funnels to identify where in the customer journey users drop off
Hotjar Funnels lets you track how visitors interact with your website and see where visitors convert or drop off. With Funnels, you can
View specific recordings from relevant funnels to see why users churn
See your lowest-converting steps, so you can identify how to improve these areas
Compare conversion performance between different marketing channels and more
Gather rich insights using filters and user attributes
For example, Gogoprint (formerly Zenprint), an online printing service, noticed users were dropping off their site. While Google Analytics provided useful metrics like page time and bounce rate, it didn't reveal how users interacted with the page.
To dig deeper, they combined Hotjar with Google Analytics to identify specific sections of the product page that caused the drop-off and optimized them to improve the customer journey. As a result, Gogoprint saw 7% fewer drop-offs than before.
Hotjar reveals what numbers don’t. Funnels helped me identify where in the customer journey people drop off. Recorded user sessions let me understand what people see when they arrive on our website—what they click and what they don’t click. Heatmaps helped me identify where they spend most of their time and assess if they should be spending time there or not.
3. Mixpanel
Mixpanel is an advanced analytics tool that helps you understand how people use your site, app, or other digital products, so you can make data-backed improvements.
How it helps: use Mixpanel to
See how users go through different steps or actions
Understand which features are working well and which ones need adjustments
Create and analyze reports about how users behave
Group users into categories and track them over time
Make informed changes to increase conversions
How to use it: to start using Mixpanel, you need to integrate it into your product or service by adding tracking code or using its SDKs. Once the integration is complete, Mixpanel starts collecting and analyzing user data.
💡 Pro tip: use Hotjar’s Mixpanel integration to filter and send targeted surveys.
Say you have an ecommerce website that sells clothing, and you want to gather insights about customer preferences to improve the shopping experience.
With Mixpanel, you can track customer actions and segment them based on their behaviors and preferences. Then, with Hotjar, you can send targeted surveys to gather insights about the customer experience and collect suggestions for improvement.
This combination of quantitative and qualitative insights will help you personalize and improve the buying experience for users, ultimately increasing their satisfaction.
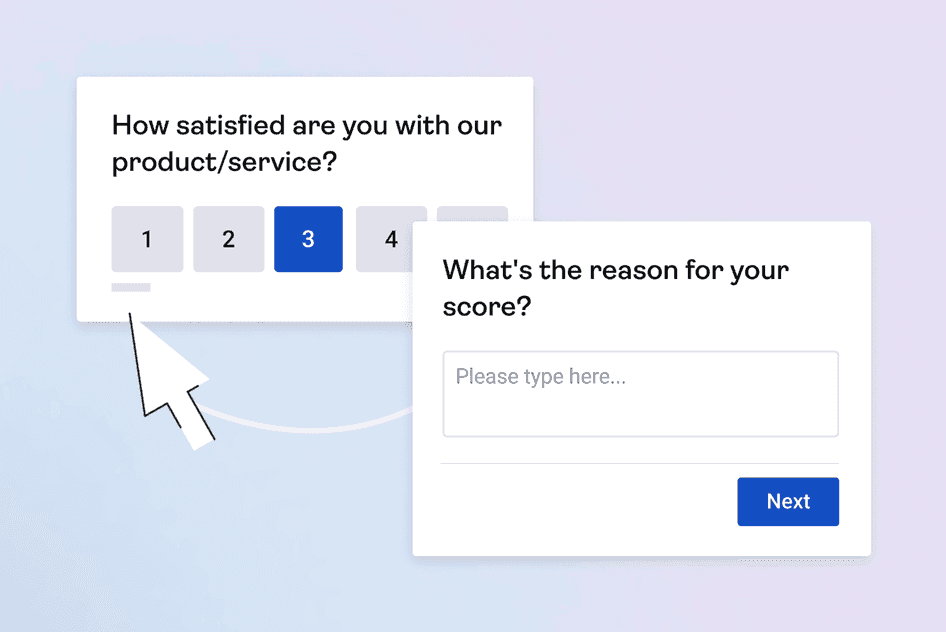
Use a Hotjar survey to learn about customer satisfaction with your site, product, or service
4. Amplitude
Amplitude is a product analytics and event tracking platform that helps you analyze user behavior, track key metrics, and gain insights into product performance.
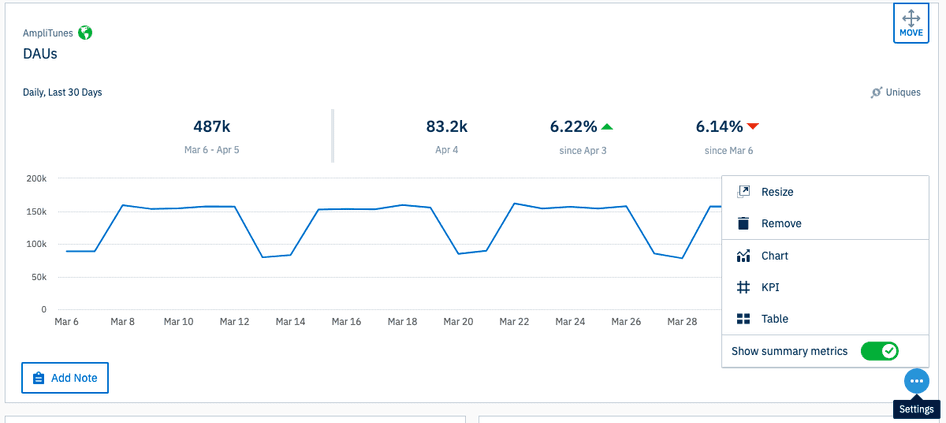
How it helps: Amplitude specializes in behavior analytics—helping you understand how users interact with your product, so you can identify patterns, trends, and opportunities to optimize your site. Amplitude also offers retention tracking and engagement analysis tools that measure user retention over time.
How to use it: to use Amplitude, you need to integrate it into your product or service by adding its tracking code. Once integrated, Amplitude will start collecting and processing user interaction data, so you can see what’s happening on your site.
5. Optimizely
Optimizely is a digital experience platform that lets you A/B test different variations of your site and run experiments to compare their performance and improve the user experience.
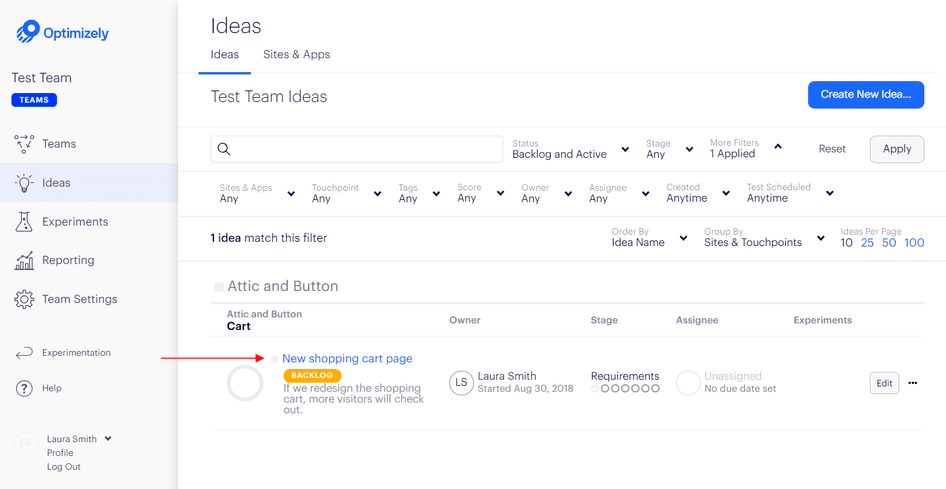
How it helps: Optimizely lets you test variations of your website to understand which version performs better in terms of conversions and click-through rates. Its experiment builder allows you to easily set up A/B tests or multivariate experiments without requiring technical expertise.
How to use it: integrate Optimizely into your website or app by adding its code snippet. After integrating the tool, set up your first experiment by defining the variations, selecting the audience segments, and specifying the goals you want to achieve. Optimizely then tracks user interactions, collects data, and provides analysis and insights to evaluate the experiment results.
💡 Pro tip: combine Optimizely A/B tests with Hotjar Recordings and Surveys to understand how users interact with different versions of your product and learn what they think in their own words.
These tools provide a comprehensive understanding of user behavior, preferences, and opinions, allowing you to optimize your product pages based on real data and deliver a better user experience.
The changes made from the Hotjar survey gave us enough confidence to begin designing the new page template, which we then A/B tested to get to the final version. Ultimately, we saw a 10% boost in conversions.
6. Kissmetrics
Kissmetrics is a software for quantitative data analysis that focuses on customer analytics and helps businesses understand user behavior and customer journeys.
How it helps: Kissmetrics lets you track individual user behavior over time to understand the specific actions users take, engagement levels, and their impact on your business goals. The tool also provides cohort analysis, so you can group users based on their signup or acquisition date and analyze their behavior over time.
How to use it: to use Kissmetrics, integrate their tracking code into your website or application. Then, use the tool to define and track events relevant to your business.
7. Omniconvert
Omniconvert is a website optimization platform with A/B testing, surveys, web personalization, customer segmentation, and behavioral targeting features.
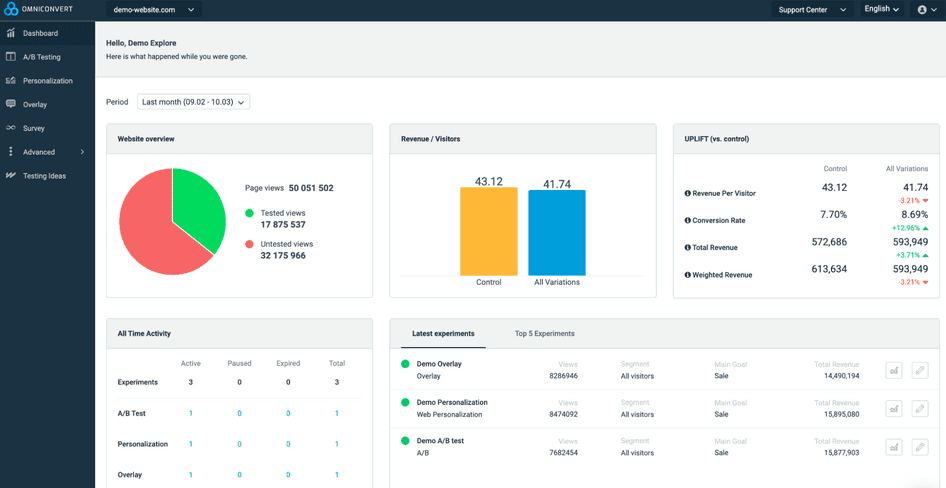
How it helps: Omniconvert focuses on conversion rate optimization, helping you analyze user interactions, identify areas of improvement, and run experiments to increase conversion rates. The tool also provides advanced analytics features to track and measure key user behavior, conversions, and engagement metrics to help you understand the performance of your marketing efforts.
How to use it: to use Omniconvert, integrate its tracking code or use its plugins with your website or app. After integrating, you can set up A/B tests, define segments, and track user interactions.
💡 Pro tip: connect your Omniconvert A/B test experiments to your Hotjar account and start using heatmaps and session recordings to understand user behavior and make changes that ultimately convert more users.
For example, if you want to understand why users aren’t signing up for your product from your site, you can set up a conversion funnel in Omniconvert to track the entire signup process and identify the specific step where users drop off. With Hotjar Recordings, you can watch users experience the signup process to gain insights into their behaviors, struggles, and potential reasons for abandonment.
When you start watching Hotjar recordings, you’ll think, ‘surely this user will complete the action!’ But once you’ve seen 20 people make the same mistake, you know the problem is with your site, not the users.
8. Heap
Heap is a website analytics solution that offers product managers a comprehensive toolkit to understand customer behavior on a large scale.
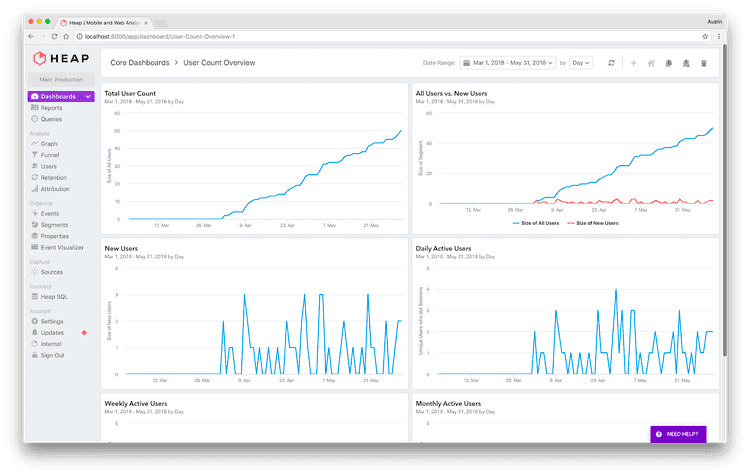
How it helps: Heap's automatic data capture eliminates the need for manual event tracking. The tool also has a retroactive analysis capability that lets you gain insights from past data and make changes without worrying about missed tracking opportunities.
How to use it: to use Heap, integrate its tracking code or install its SDKs in your website or app. You can then log into the Heap platform to explore captured user data, create funnels, segment your audience, and make decisions to improve your site’s UX.
9. HubSpot
HubSpot is a comprehensive customer relationship management platform that offers a wide range of tools to support your marketing, sales, and customer service efforts.
How it helps: with HubSpot, you can track various metrics and data points related to your marketing, sales, and customer service activities, such as website traffic, email open rates, conversion rates, and customer interactions.
Plus, customizable dashboards and reports make it easy to get a quick overview of how things are going—analyze data trends, identify patterns, and gain insights into the performance of your campaigns, content, and channels.
How to use it: to use HubSpot, create an account and set up your marketing, sales, and customer service processes within the platform. Integrate it with your website, CRM, and other relevant tools (including Hotjar!). Then customize your analytics dashboards to track the metrics that matter most to your business, and HubSpot will collect and analyze the data on your behalf.
💡 Pro tip: pair Hubspot with Hotjar to speed up the process of solving customer support issues and make users happier.
Say you have a SaaS product and notice increased support tickets related to a specific feature. By analyzing a Hotjar rage click or Engagement Zone heatmap, you can see where users struggle.
Once you identify the spots where users are having trouble, create a knowledge base article in HubSpot, with clear instructions and helpful screenshots, to guide users through the process smoothly. You can also improve your support email templates in HubSpot, ensuring they direct users to the article for more help.
As you implement these changes, use Hotjar feedback tools to gather continuous feedback, so you can tell if users truly find these resources helpful. That's how you strengthen customer relationships and speed up your support process.
How to pick the best quantitative data analysis software for your business
Choosing the best quantitative data analysis tool for your business will help you gather the most accurate and relevant data for your team to make informed decisions. Here are eight tips for choosing the software that best suits your needs.
Know what you need: before choosing a solution, think about the type of data you work with and the kind of analysis you want to perform
Do your research: look for well-known tools and read reviews from other users on third-party sites to get an idea of their experiences
Check the features: look closely at what each tool offers to ensure it has what you need to make sense of your data
User-friendliness matters: choose a tool that's easy to use and doesn't require a steep learning curve—you want something that your team can quickly adapt to and start using effectively
Consider the cost: think about what you're willing to spend and look for a tool that fits your budget while providing the features your team needs
Give it a test run: many tools offer free trials or demos, so try them out first to determine if it’s the right fit for your business
Ask for recommendations: reach out to other businesses or colleagues who have used any of the data analysis tools you might be considering to hear what they have to say about the product
Support matters, too: consider the level of support the tool provides—look for resources like documentation, tutorials, and responsive customer support
Use a product experience insights platform to gather more holistic, actionable user data
Quantitative data analysis tools focus on the numbers, like how many people visited your website or how much revenue you generated, but they don’t tell you why your customers took a specific action.
A product experience insights platform like Hotjar shows you what's happening and why, giving you a more complete and well-rounded understanding of your users. You can see the big picture while diving deep into the behavior behind the numbers. This combination helps you uncover valuable user insights that create more delight and loyalty.