Learn / Blog / Article
How to set up a free Google Analytics heat map
If you’ve come here to learn more about Google Analytics heat maps, we have good and bad news for you.
The bad news 😥: Google deprecated its free heatmap add-on in 2017. Recent reviews confirm it no longer works and is not compatible with GA4.
The good news 🤗: there's another way for you to generate a free heatmap by combining Google Analytics data with Hotjar—and we guarantee this one will work.


This article takes you through what GA heatmaps are, why they’re useful, and how to set one up in five simple steps.
Set up a heatmap today 🔥
Sign up for a free Hotjar trial and use heatmaps to find out how users move, click, and scroll through your pages.

What is a Google Analytics heat map?
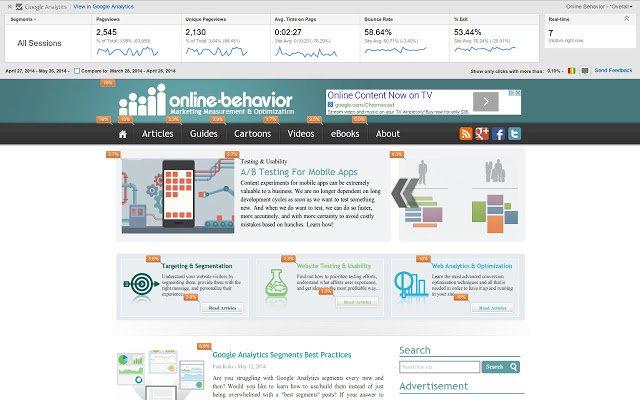
A Google Analytics heat map is a visual representation of where visitors click on your website. It’s powered by data GA collects through its tracking snippet. Prior to 2019, GA users could generate a free heatmap using Google's heat map extension, Page Analytics (by Google).
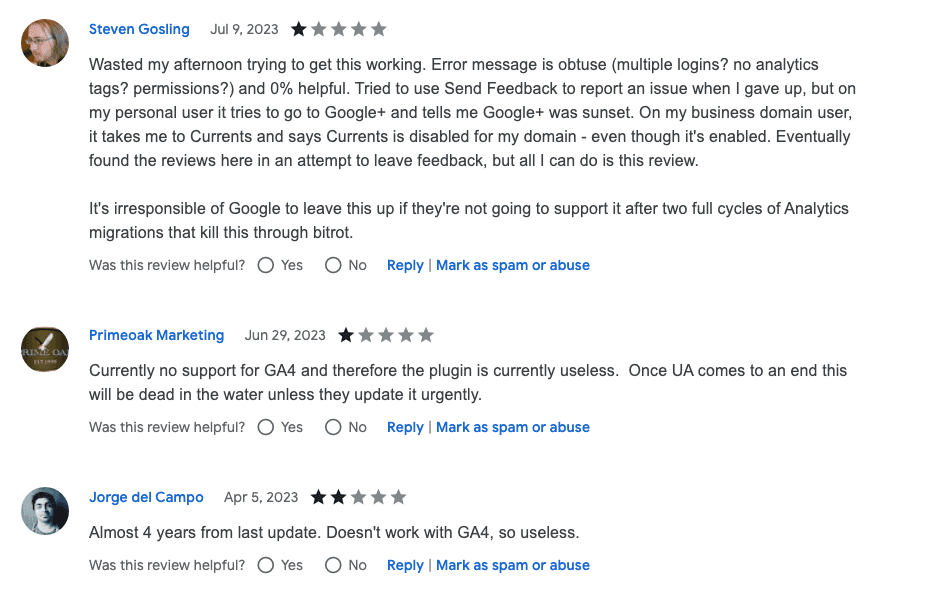
Unfortunately, Page Analytics (by Google) was deprecated in 2017 and hasn’t been updated since 2019. There’s no support for GA4, and many users (including us!) struggle to get it to work, leading to several one-star reviews on the Chrome web store.
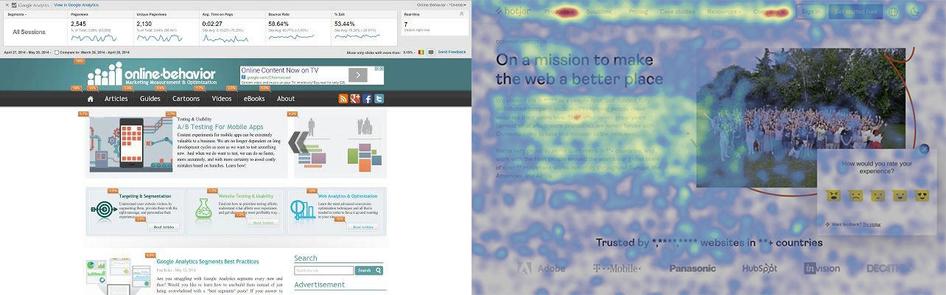
Even if you do get it to work (good luck! 😮💨), GA heatmaps have limited functionality—you’d only get a basic click map with percentages, not the colorful data visualization you might be expecting.
Why do GA users want to view heatmaps, anyway?

Aside from being fun to look at, heatmaps give you a shareable and easy-to-understand visual overview of any website page’s performance. However you create them, heatmaps help you
👩💻 Quickly visualize user behavior
🖱 See what users click on (and ignore)
📈 Identify page areas with high engagement
⬇️ View how far users scroll down the page
🐞 Find and fix bugs and broken page elements
🤝 Get stakeholder buy-in for website optimizations
📊 Showcase results to managers and clients
💡 Generate ideas for conversion rate optimization (CRO)
🔎 Analyze A/B testing results and iterate improvements
Luckily, the end of Google Analytics heat maps doesn’t mean you have to miss out on these brilliant heatmap benefits. Hotjar Heatmaps is one of the world’s best-loved heatmap tools—and we let you generate as many heatmaps as you want. Read on to find out how. 👇
How to set up a free website heatmap in Hotjar
Hotjar (that’s us, 👋 hello!) is a best-in-class product experience insights platform used on over 1 million websites. Aside from our advanced plans for growing businesses, Hotjar also offers a free-forever plan with unlimited heatmaps. You read that right: unlimited heatmaps.
By using Hotjar Heatmaps instead of Google’s old heat map tool, you’ll be able to do the following:
Automatically generate multiple types of heatmap at once. These include
Click maps: visualize the number of clicks on any element
Scroll maps: see how far down the page visitors scroll
Move maps: see how users move and hover their mouse as they browse
Rage click maps: quickly find broken or confusing elements
Engagement Zones maps: combined click, scroll, and move maps to show elements that attract the most attention and interaction
View heatmaps segmented by visitor data like country, device, and traffic source
Share a link to any heatmap with your colleagues, stakeholders, and clients
Download and export heatmap data as an image or .jpg file for further data analysis
Click through to view session recordings of individual user browsing journeys
And since Hotjar integrates with Google Analytics (Business plan and higher), you can also segment heatmaps by GA events.
We put Hotjar on all our pages. If our conversion rate drops after a change, our heatmaps help us identify and solve the issue. Hotjar has helped define our website strategy and make the experience even better for our customers.
Ready to get started? Here’s how to set up a Hotjar heatmap in five steps.
Step 1: sign up for Hotjar
Sign up with your Google account or email address. Hotjar offers a free-forever plan and free trials for premium plans. Check your email for a confirmation code to verify your address, then set a secure password and answer the setup questions. Enter your site URL (e.g. mywebsite.com) and click ‘Start Using Hotjar’.
Step 2: add Hotjar’s tracking code to your website and integrate it with GA
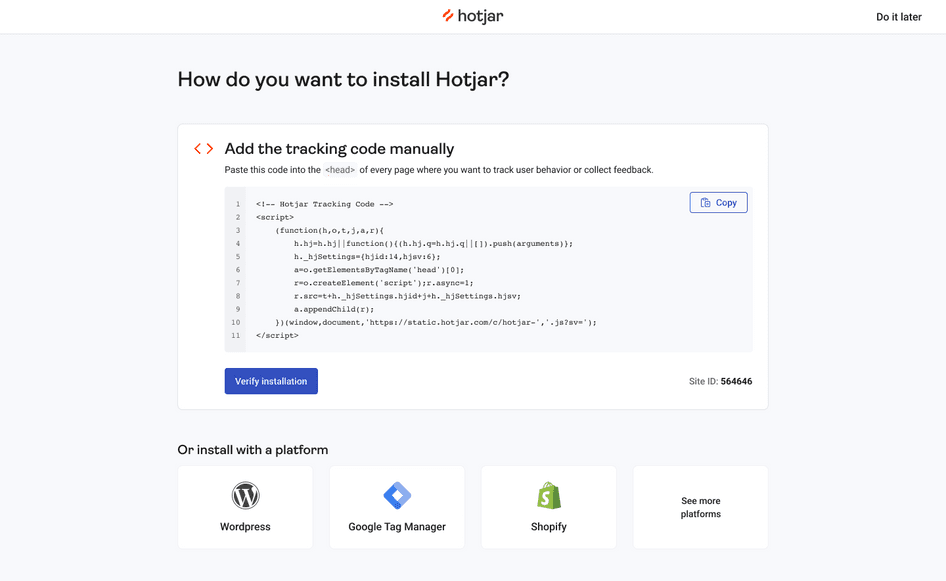
Hotjar tracks your website visitors in a similar way to Google Analytics. You can install Hotjar’s tracking code in several ways, including via Google Tag Manager and WordPress plugin, or by manually copy/pasting the JavaScript snippet into the <head> of every website page you want to track.
At this point, you can also set up the Google Analytics integration (Business plan and higher) to segment heatmaps by Google Analytics events (more on this in Step 5 👇).
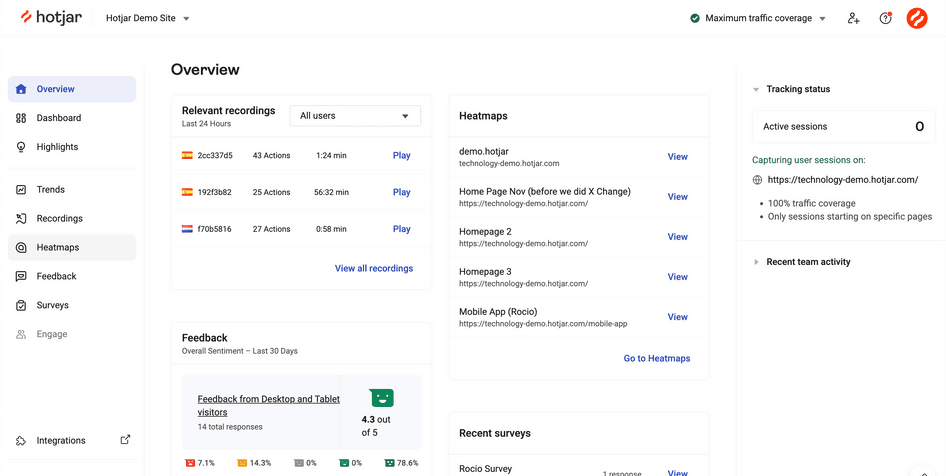
Step 3: open the Heatmaps tool
Once you’ve given the tracking code time to track some visitors, click on the Heatmaps tool in the left-hand navigation menu.
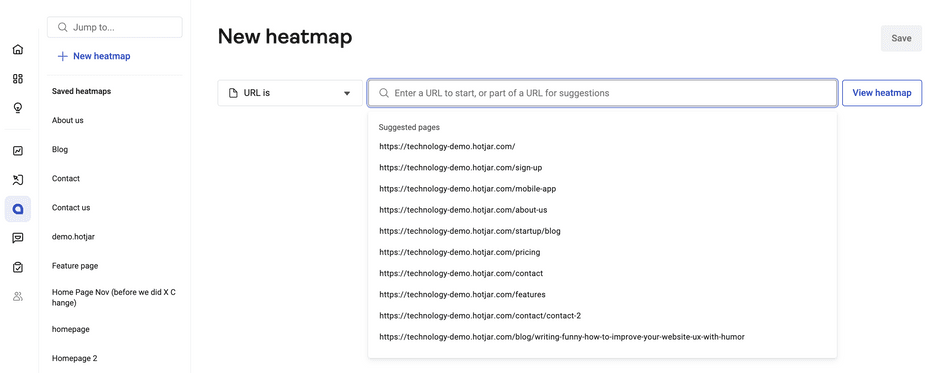
Step 4: enter the URL of your heatmap or select from the popular pages list
Use the search bar at the top of the Heatmaps page to view a heatmap for any page on your site by entering the URL or selecting from the suggested popular pages.
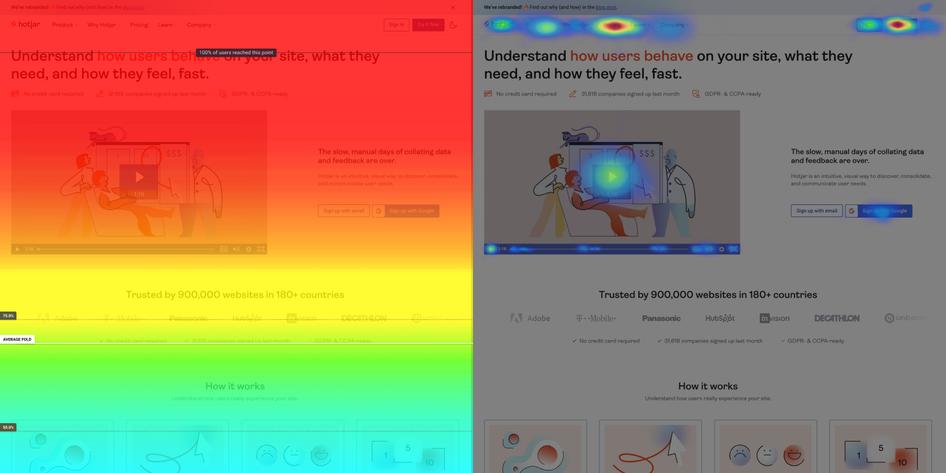
Step 5: toggle between different heatmap types and filter by Google Analytics events
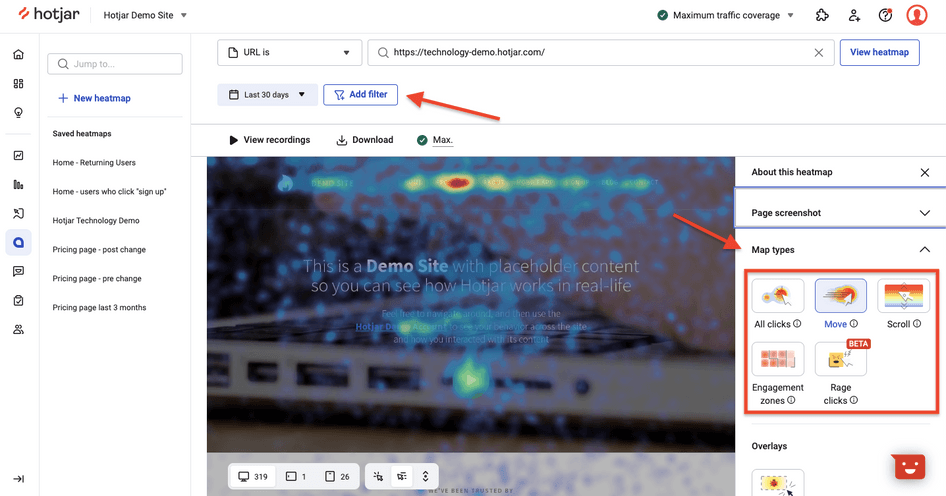
Click the map type icons to toggle between each heatmap type.
Since Hotjar tracks a lot of the same data as Google Analytics, you can filter your heatmaps by multiple metrics, including date range, device, and exit page on any plan.
And if you’ve integrated GA4 with Hotjar, you can also filter heatmaps by any Google Analytics event.
For more on interpreting heat map data, see our guide on how to analyze a heatmap
Which pages should I generate a heatmap for?
This is where GA comes in handy when used alongside Hotjar: log into your Google Analytics account and look for areas of low performance—for example, pages with a high bounce rate or exit rate and low conversion rates. In Hotjar, generate heatmaps on these pages to see what confuses users and causes them to leave: are they rage-clicking on broken elements? Not scrolling far enough to see calls to action (CTAs)?
On the flip side, a heatmap on your best-converting web pages shows you which elements attract attention, so you can do more of what works.
You can also use the official Google Analytics and Hotjar integration to pass GA events directly to Hotjar and filter by metrics like ‘add_to_cart’ or ‘begin_checkout’ to quickly view heatmaps of users who do and don’t convert.
Add qualitative insights to your heatmaps and GA website data
Using heatmaps alongside Google Analytics data won’t improve user experience (UX) on your site overnight, but it will point you toward the key changes you can make to get there.
However, quantitative web analytics data alone won’t help you understand what really motivates your customers to choose you, stay loyal, and recommend your products.
Get the full picture by combining GA and heatmaps with other Hotjar tools like session recordings, surveys, and user interviews—all available within the Hotjar platform. It’s your first step to making data-driven business decisions to optimize your site and increase revenue by delivering better experiences than your competitors.
Set up a heatmap today 🔥
Sign up for a free Hotjar trial and use heatmaps to find out how users move, click, and scroll through your pages.
FAQs about Google Analytics heat maps
Related articles

Behavior analytics
How to use the Hotjar-AB Tasty integration: 3 powerful use cases
Figuring out exactly what your users need involves two things: getting to know them and some old-fashioned trial and error.
With the Hotjar-AB Tasty integration, we’ve got you covered on both counts. Hotjar helps you understand user behavior, and AB Tasty lets you create experiments and personalizations on your site. Learn how these tools work together to create a digital experience that’s enjoyable for your users and excellent for your conversions.

Behavior analytics
The best way to track scroll depth (it’s not Google Analytics 4)
Knowing which parts of a web page bore, engage, or persuade your website visitors can be a superpower for digital marketers, UX designers, product teams, and ecommerce managers.
Tracking scroll depth gives you this power, providing actionable insights to improve the user experience (UX) by revealing your site visitors’ scrolling behavior.

Ayush Sood

Behavior analytics
10 ways to improve your data analytics processes using Hotjar
As your team's data partner, you empower colleagues to make predictions and decisions by seeking out valuable insights into your users, products, or services. But who—or what—empowers you? What data analytics tools do you rely on to accomplish your day-to-day work?
If you still need to find your go-to solution, try Hotjar.

Shadz Loresco