Learn / Blog / Article
The best way to track scroll depth (it’s not Google Analytics 4)
Knowing which parts of a web page bore, engage, or persuade your website visitors can be a superpower for digital marketers, UX designers, product teams, and ecommerce managers.
Tracking scroll depth gives you this power, providing actionable insights to improve the user experience (UX) by revealing your site visitors’ scrolling behavior.


This article is your comprehensive introduction to scroll depth. We discuss why you should track it and how to use it to make data-backed website changes.
We also look at scroll depth tracking using Google Analytics 4—and explore a better option for monitoring scroll depth and improving the user experience (hint: it’s Hotjar 👋).
Summary
Scroll depth measures how far users scroll down a web page, offering insights into user behavior and helping you improve overall user experience
Scroll depth is tracked in three main ways: through JavaScript, Google Analytics (GA) and Google Tag Manager (GTM), or behavior analytics tools like Hotjar
While GA remains a popular option for measuring scroll depth, Hotjar’s color-coded scroll maps provide a more visual, digestible representation of users’ scrolling behavior
For deeper analysis, the Hotjar platform includes complementary tools like Recordings (session recordings) and Feedback (an always-on website widget), plus four additional heatmap types
Using Hotjar gives you a wealth of benefits: understand user behavior, detect false bottoms, optimize content placement, ensure content accessibility, and enhance cross-device experiences
What is scroll depth, and why should you track it?
Scroll depth is a measurement of how far users scroll down a web page, helping you understand user behavior and improve customer experience. For example, suppose you're A/B testing a crucial landing page and want to know which design layout or copy attracts more scrolling. Or, perhaps you want to know if visitors make it all the way down to customer testimonials and call-to-action (CTA) buttons.
By tracking scroll depth, you gain valuable insights into how your visitors interact with your website and what changes will keep them engaged.
How do you measure scroll depth?
There are many ways to track a page’s scroll depth. Here are three of the most common ones:
JavaScript: requires coding skills and can be challenging to implement on complex websites
Google Analytics and Google Tag Manager: a popular solution for tracking scroll depth, but doesn’t offer as many features as third-party tools
Third-party website analytics tools: heatmap tools like Hotjar Heatmaps offer better features and data representation than Google Analytics
Most tools that monitor scroll depth represent it in percentages, pixels, or visually through a type of heatmap known as a scroll map.
A scroll map in Hotjar
Heatmap vs. scroll map: what’s the difference?
A heatmap is a visual representation of user interactions on a web page. Using a color spectrum, areas with high engagement are shown in warm colors like red and orange, while less engaged areas appear in cooler shades like blue.
A scroll map is a specific type of heatmap showcasing how far users scroll down a page. The Hotjar Heatmaps tool offers scroll maps as part of our heatmap suite, as well as these four additional heatmap types:
Click map: shows where users click on your page, helping you understand if CTAs, buttons, and links effectively capture user attention
Move map: displays where users move their mouse, giving insights into what captures their attention
Engagement Zones map: combines data from clicks, moves, and scrolls, offering a comprehensive view of user interaction
Rage click maps: highlights areas where users repeatedly click out of frustration, indicating potential issues or confusion
👉 Ready to get started? Read our guide on setting up Hotjar Heatmaps
Scroll tracking using Google Analytics and Google Tag Manager
The combination of Google Analytics 4 (GA4) and Google Tag Manager (GTM) is a popular option for scroll tracking. Here’s why:
Built-in scroll tracking in Google Analytics 4: GA4 offers a straightforward view of user scrolling behavior with its built-in event that triggers around 90% scroll depth
Custom tracking with Google Tag Manager: GTM allows users to set specific scroll depth thresholds in percentages or pixels and activate tags based on those thresholds. Whether you're curious about 25%, 50%, or 75% scrolls, GTM has you covered.
Smooth integration: as part of the Google suite, GA and GTM work seamlessly with other Google services, streamlining data analysis
However, while Google Analytics provides a basic view and Google Tag Manager allows for detailed customization, they may not always provide a complete picture of user behavior.
For instance, when reading on a mobile device, people tend to scroll quickly, and may skim over longer articles. Simply looking at how far someone scrolls and whether they leave the page doesn't reveal if they are truly engaged with the content.
Hotjar, on the other hand, allows you to track scroll depth using scroll maps. Plus, additional tools within the platform provide qualitative insights to complement your scroll depth data, giving you a holistic understanding of user interactions and improving website performance.
Set up your heatmap today
Sign up for a free Hotjar account, add the tracking code to your site, and start using Heatmaps today.

Why you should use Hotjar to measure scroll depth and improve UX
Hotjar provides an intuitive and comprehensive analysis of user behavior, including scroll maps, user feedback, session recordings, and various heatmaps.
Visual insights: Hotjar’s ability to visualize scroll data via scroll maps and quickly highlight areas of interest or concern on a web page makes it more intuitive than Google Analytics. Instead of just percentages and pixels, you get a vivid, color-coded representation of user engagement, enabling you to pinpoint at a glance where users linger, breeze past, and drop off.
User feedback integration: Hotjar’s Surveys and Feedback tools allow for direct user feedback and a clear picture of user sentiment. For instance, ClickMechanic used Hotjar Surveys to directly ask users about barriers to conversion, leading to actionable insights.
Comprehensive analysis: additional tools like Recordings allow you to see how real users navigate the website and provide a deeper understanding of your customers to complement insights from scroll tracking.
Engagement Zones: Hotjar's Engagement Zones heatmap combines data from click, scroll, and move heatmaps into a single view, making the analysis process faster and more comprehensive
Highlights in Hotjar: this feature allows for easy collaboration and sharing of user insights to drive stakeholder buy-in. Use it to share your scroll map findings or website issues, tag and notify specific team members, and organize your highlights into collections. (Read our detailed guide on using Hotjar Highlights here.)
Specific insights: Hotjar's various types of heatmaps pinpoint specific issues, like whether users are confused by non-clickable elements or if they're getting distracted by unnecessary content. These insights lead to direct and impactful changes.
Hotjar Heatmaps’ page insights panel makes it easy to switch between different types of heatmaps: click, move, scroll, Engagement Zones, and rage clicks
Scroll depth tracking: Google Analytics vs. Hotjar
The table below outlines the main differences between scroll tracking with two popular platforms: Google Analytics and Google Tag Manager vs. Hotjar.
5 ways to use Hotjar for scroll tracking
Now that you’ve seen the unique visual insights scroll maps provide, let's delve deeper into how tracking scroll data with Hotjar elevates your analysis.
1. Understand user behavior
Understanding user behavior goes beyond numbers: it’s about knowing the ‘why’ behind real interactions. Hotjar's scroll maps show how users move through your site using a color gradient from red to blue. Blue areas indicate that fewer visitors scroll to a particular area, allowing for targeted improvements.
Want to track scroll depth for specific user segments? Filters in the Hotjar dashboard allow for a deeper understanding of user interactions on your site.
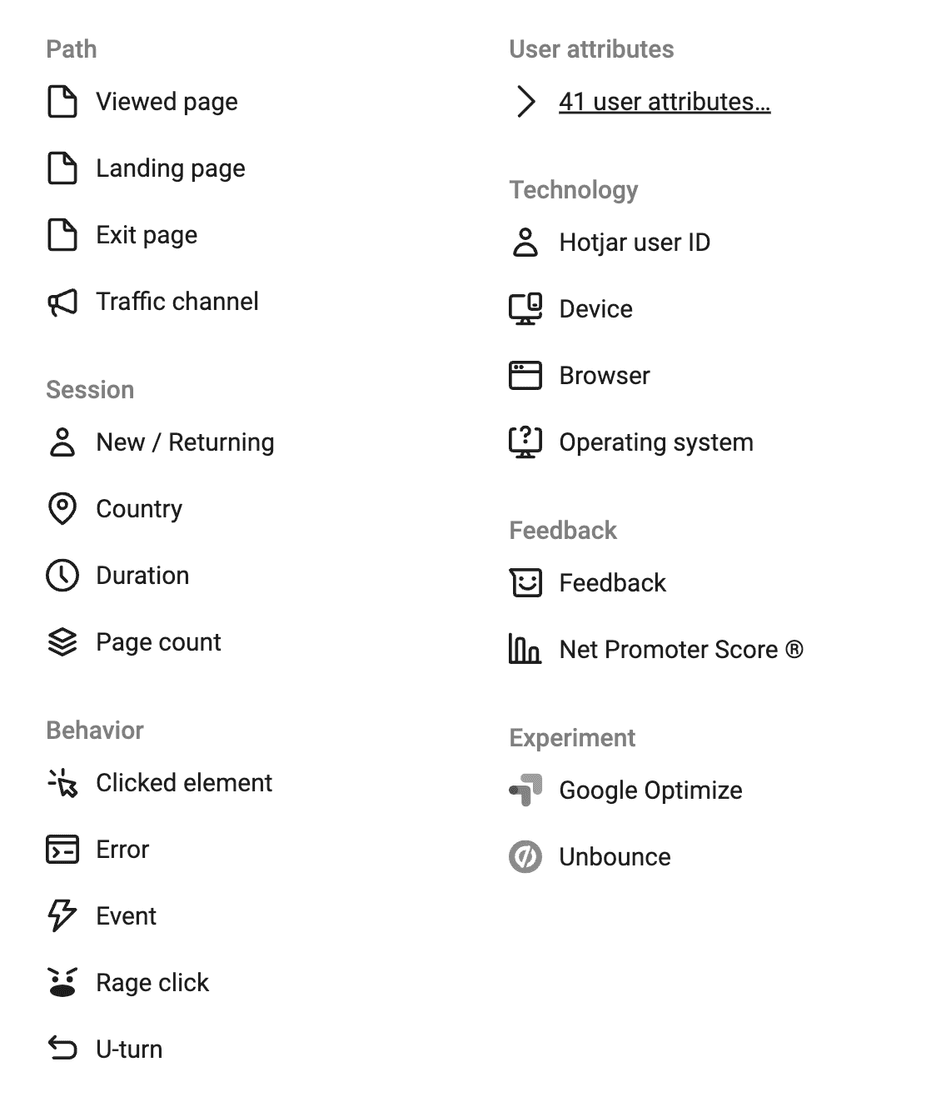
Filter your heatmaps using the vast number of filters available in the Hotjar dashboard
Available filters in Hotjar include
Date
User type
Location
Technology
Behavioral filters
User attributes: segment users based on custom attributes you've set up, like those who made a purchase vs. those who didn't
Feedback: understand user sentiment by filtering sessions where feedback was provided via Hotjar’s Feedback tool
💡 Pro tip: try these smart ways to use filters in Hotjar Heatmaps. 👇
Homepage analysis: compare how new and returning visitors interact with your homepage. Check if returning users can easily find the login button.
Exit analysis: understand why users leave your site after landing on a specific page
A/B testing: compare heatmap data for different page variants to see which design or content layout performs better
Checkout flow optimization: identify where users drop off during the checkout process and if a specific step causes confusion
Campaign performance: analyze how users from specific paid campaigns interact with your landing pages. Check if they scroll down enough to see crucial CTAs or if some sections get unexpected attention.
2. Detect false bottoms
At some point, you've probably thought you scrolled to the bottom of a web page and bounced off without realizing there was still more content to see—and people are likely doing the same on your website. This is called a 'false bottom', and it causes visitors to miss valuable content at the end of the page, such as contact details, CTAs, and customer ratings. This is usually because a large image or section break gives the impression the page has ended.
Hotjar illuminates deceptive areas on your site by highlighting cooler colors where users pause, indicating potential false bottoms. By identifying and addressing these false bottoms, you ensure users see all the content and page elements you’ve created, increasing engagement with your site.
Heatmaps showed us that very few users scroll down beyond our hero, so when redesigning our landing pages, we used this information to redesign only that section. This reduced our costs in terms of design and engineering overhead whilst delivering a 15% increase in our conversion rate.
3. Optimize content placement
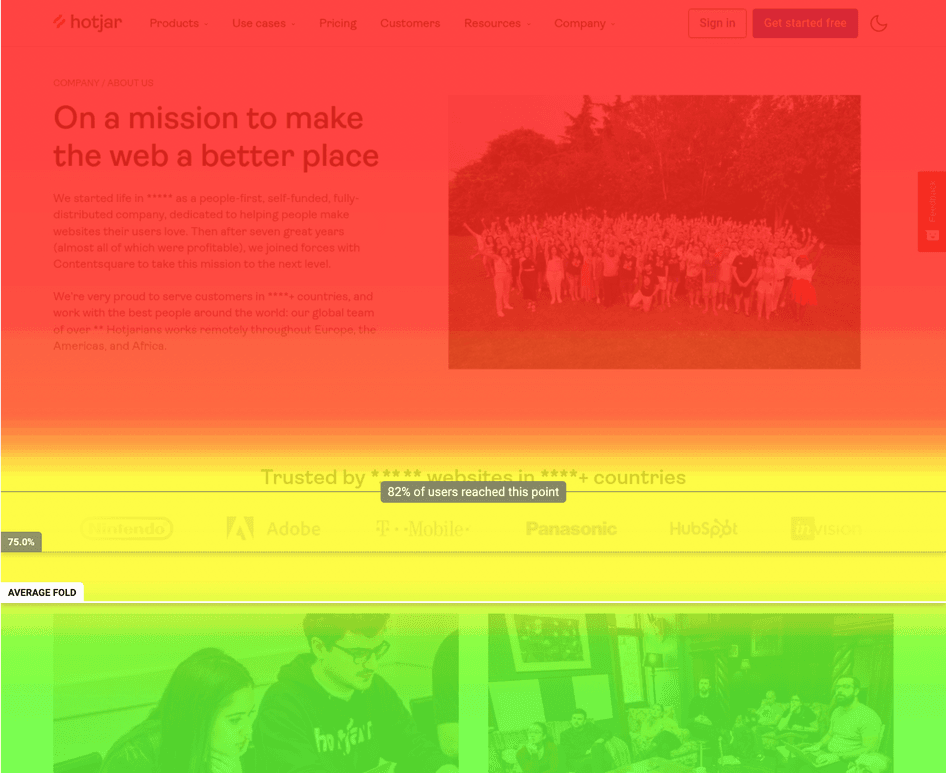
The 'fold' is the point on a web page where users must start scrolling to see more content. The average fold refers to the median point on a web page users can see without scrolling when they first access the page. On a Hotjar scroll map, this point is marked as a distinct line labeled ‘AVERAGE FOLD’.
With Hotjar, content placement becomes a science, not a guess. Scroll maps show where users engage the most and what areas they might skip, letting you pinpoint high-traffic areas and potential blind spots and strategically position essential content where it's most likely to captivate your audience.
The scroll map showed that on mobile, 75% of users didn't see our main CTA. We moved it above the fold and saw an immediate increase in users landing on our key pages.
4. Ensure content accessibility
Users who scroll too much might have trouble finding what they need. On the surface, your content may seem engaging because heatmaps show users scrolling through the entire page—but the conversion and bounce rates contradict this hypothesis.
Hotjar helps you identify these areas and optimize your site's navigation by watching session recordings of how real users interact with your website using the Recordings tool.
💡 Pro tip: want to dive deeper? The Hotjar Heatmaps page insights panel makes further analysis easy, providing additional insights to complement your scroll maps’ visual data.
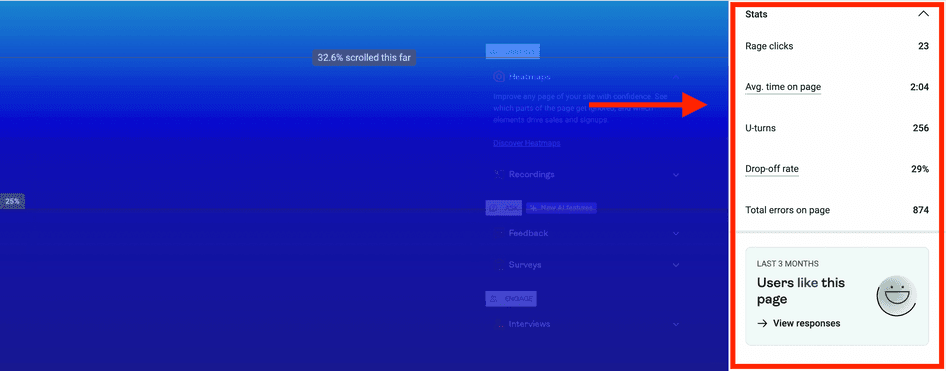
Found on the right-hand side of every heatmap, this panel shows you the average user sentiment (in the form of a feedback score) and pinpoints areas of potential frustration by highlighting behavioral patterns such as rage clicks. If users frequently rage click in a section that requires further scrolling, it could suggest that underlying content or design issues need attention.
In addition to visual data, the panel provides quantitative metrics like average time on page, drop-off rate, and console errors to offer context to your scroll data. If users spend a lot of time on a page without scrolling, it could indicate they need help finding the information they need.
The Hotjar Heatmaps side panel providing additional context
5. Better cross-device experience
User behavior on a website differs depending on the device used. Hotjar's scroll maps (and Hotjar in general) reveal these differences by having separate mobile, desktop, and tablet heatmaps.
Take Vimcar's rebranding challenge as an example. Amid the redesign, Anna Grünanger, Vimcar's Head of Acquisition, spotted navigation issues on their UK site, with key features overshadowing their main CTA. Hotjar's insights showed that 75% of mobile users overlooked Vimcar's primary CTA. A strategic shift above the fold led to a notable boost in user engagement on crucial pages.
Hotjar's scroll maps guided Vimcar to refine its content placement, enhancing the cross-device user experience. For any customer-centric company, these insights are invaluable.
Make the most of scroll tracking
Understanding your website visitors’ scroll behavior empowers you to make strategic changes on your website that improve the user experience and increase conversions. But as you’ve seen, scroll depth shouldn’t be used in isolation to make major modifications on your website—it only tells you how people engage with your site, but not why.
The solution? Use Hotjar, the behavior analytics tool that gives you a more comprehensive understanding of user behavior with a suite of sophisticated tools like session recordings, heatmaps, and user feedback.
Ready to elevate your website's user experience?
Set up your scroll heatmap today
Sign up for a free Hotjar account, add the tracking code to your site, and find out how your users scroll through it.
FAQs about scroll tracking
Related articles
Behavior analytics
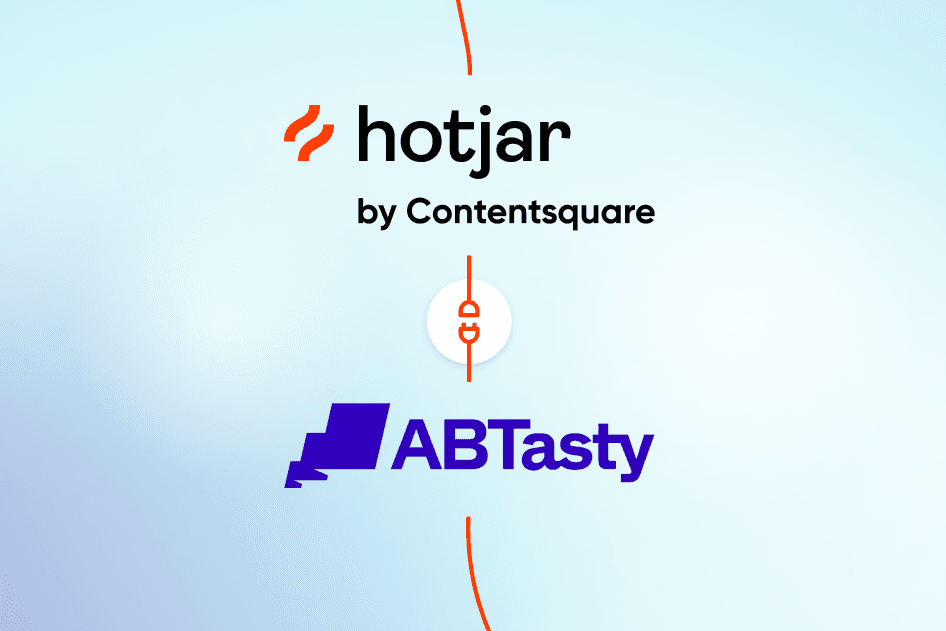
How to use the Hotjar-AB Tasty integration: 3 powerful use cases
Figuring out exactly what your users need involves two things: getting to know them and some old-fashioned trial and error.
With the Hotjar-AB Tasty integration, we’ve got you covered on both counts. Hotjar helps you understand user behavior, and AB Tasty lets you create experiments and personalizations on your site. Learn how these tools work together to create a digital experience that’s enjoyable for your users and excellent for your conversions.

Behavior analytics
10 ways to improve your data analytics processes using Hotjar
As your team's data partner, you empower colleagues to make predictions and decisions by seeking out valuable insights into your users, products, or services. But who—or what—empowers you? What data analytics tools do you rely on to accomplish your day-to-day work?
If you still need to find your go-to solution, try Hotjar.

Shadz Loresco

Behavior analytics
7 best Mixpanel alternatives to understand your users
Mixpanel is an analytics platform that excels in collecting quantitative user data. But sometimes, product managers, marketers, and website owners need more—the 'why' behind the 'what’. The good news is there are plenty of Mixpanel alternatives that combine quantitative analytics with powerful qualitative insights.

Hotjar team