Learn / Guides / Website analysis guide
How to analyze and optimize your website in 9 simple steps
Website analysis is the key to serving users better and unlocking new revenue, helping you ensure people—and search engines—find it appealing. But when there are seemingly limitless ways you could modify your site, how do you identify and prioritize the most impactful changes?

Depending on your business, your website functions as a salesperson, product showroom, content library—or all of the above. With so many hats to wear, your site has a massive impact on how users view your business. And it ultimately dictates how much they spend with you.
There are thousands—if not millions—of websites like yours: that’s why analyzing your website regularly is crucial to stay ahead of the competition.
This guide gives you an actionable, step-by-step process for analyzing (and improving) your website to keep it functioning at optimal performance. With the insights shared here, you’ll uncover the greatest opportunities for improvement.
See what users do on your website
When analyzing your website, use Hotjar to learn where visitors click, scroll, and get stuck.

How to conduct a user-driven website analysis
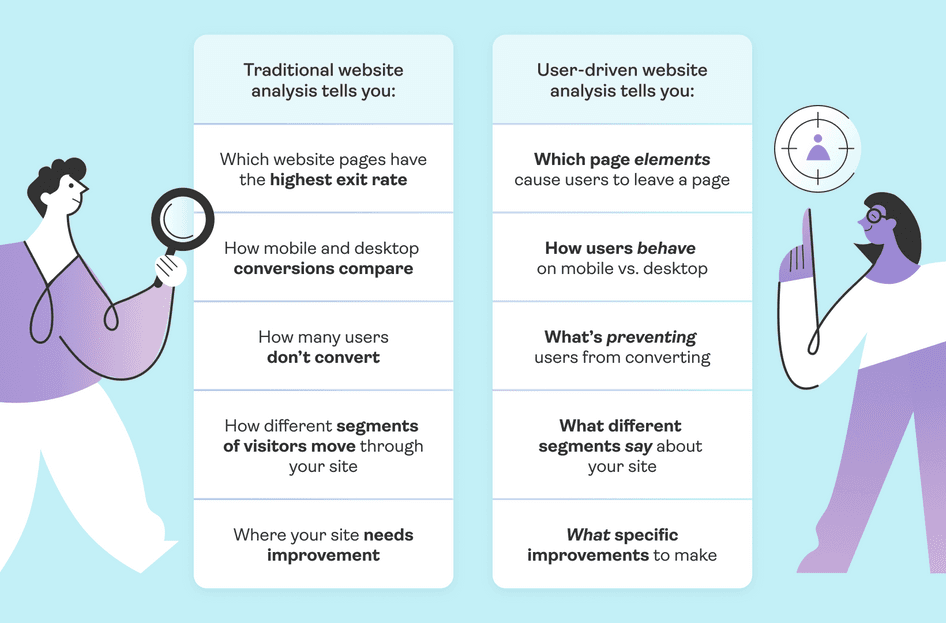
If you do some quick research, you’ll notice the standard website analysis process mostly focuses on search engine optimization (SEO) and surface-level metrics, such as:
Page loading speed
Traffic source
Bounce rate
These essential web analytics metrics affect your user experience (UX) and search engine rankings. However, this kind of data only gives you a partial picture of what’s happening.
For example, your bounce rate might tell you visitors are leaving a certain page, but it won’t tell you why. And most importantly, it won’t tell you what to do to improve the page and keep users sticking around.
That’s why we at Hotjar recommend a user-driven approach to website analysis—one that reveals how users think, feel, and act on your site.
Follow these nine steps to gauge how your website is performing in terms of SEO, user sentiment, and competitive positioning—then make the changes that matter.
1. Inspect your technical and SEO fundamentals
Your user journeys begin when potential customers find your website, so the first step is to ensure it’s set up to satisfy search engines. Here's how:
Run an SEO audit: look for technical issues affecting your organic search rankings, like missing title tags, improper redirections, or broken links. You can run technical audits with SEO platforms like Semrush, Moz, and Ahrefs, but it may be a good idea to get guidance from an expert when resolving these issues.
Assess how your website ranks on search engines: online, your sales opportunities are only as good as your website traffic. Use SEO analysis tools and Google Search Console to check how you rank for important search terms in relevant locations.
Measure your page loading speed: slow websites are a drag for your customers and a red flag for search engines—so if your site’s a slow loader, you might end up further down the search engine rankings. Fortunately, free website analysis tools like Google PageSpeed Insights can measure your page load speed for you.
You can also check your website authority score in the SEO platforms mentioned above. If it’s much lower than your competitors’ scores, it could be time to step up your content marketing and SEO game.
✅ For more resources on analyzing your technical and SEO fundamentals, see our website analysis checklist.
2. Analyze your site’s performance across devices and browsers
Poor responsiveness across devices often goes unnoticed, so it’s important to check that your site displays correctly for all users. Here's how:
Compare performance metrics for desktop vs. mobile: there'll always be some variance in how users behave on mobile vs. desktop. But if your bounce rates are more than 8% higher on mobile, or if you’re seeing a conversion rate difference of more than 2-3%, your site might not be responsive.
Find performance differences across browsers: if your site doesn’t display well on older versions of web browsers, it could worsen your users’ browsing experience. Use your web analytics platform to compare conversion rates from different browsers.
Carry out usability testing on your mobile site: small issues with your mobile experience aren’t always obvious. If you observe significant differences between your mobile and desktop conversions, carry out usability testing to find out how users experience your mobile site.
🔥 If using Hotjar
Hotjar Recordings lets you watch users’ journeys on your site as if you were sitting in the room with them. Filter your recordings from your dashboard to bring up mobile journeys only and see how these users are behaving.
3. Get reacquainted with your target market
Your users are unique, and so is the way you serve them. So when you want to know how well your website does its job, start by understanding the people visiting it on a deeper level. Here's how:
Create profiles of your target audience: with research-driven user personas, you keep their needs, motivations, and pain points in mind throughout your analysis
Map out the journey for each key user persona: customer journey mapping gives you a framework to understand what your users need from each page they navigate to
Start segmenting your website visitors: use surveys to identify key audience segments by asking visitors their job title, industry, or other demographic questions. Then, combine these insights with website tracking data to learn more about your audience segments.
💡Pro tip: use Hotjar Surveys to create automated flows of open- and closed-ended, and multiple-choice questions. For example, first ask visitors a multiple-choice question to segment them, then follow up with open-ended questions to learn more.
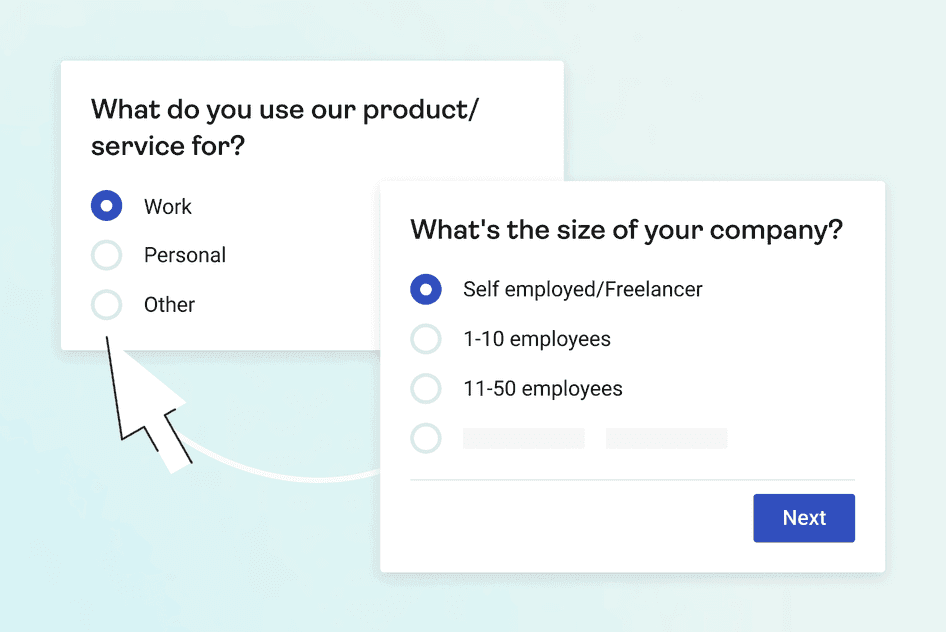
Use a Hotjar user persona survey to segment your website visitors
4. Run a competitor analysis
Customers always want the best products, most efficient service, and easiest website experience. Regularly scope out the competition to see how your website compares in key areas—even if you’ve already got loyal users. Here's how:
Analyze product/service offerings: what are your competitors selling, and how does it stack up against your offer? Are they offering a delivery method your users might appreciate, like gift cards or a unique subscription model?
Compare website messaging: how are your competitors addressing user desires and pain points? What (relevant) messages and guidance do they provide that you don’t?
Check backlinks: who’s linking to your competitors? Use SEO tools to find out. See what strategies your competitors use to get links, so you can replicate them and bring new traffic to your site.
❗️A quick caveat on competitor analysis
Looking at your competitors’ sites brings valuable inspiration and helps you get a sense of current best practices.
However, don’t assume that just because a competitor has done something differently, the decision is paying off—or that it'll work for your customers. Product teams do get things wrong, and only data (like conversion metrics and customer feedback) can tell you what’s really working.
5. Understand how customers move through your site
To analyze how well your website is serving users, it’s helpful to understand the common journeys they take through it.
Traditional analytics tools like Google Analytics help you look at these journeys in terms of hard numbers. Click on GA's Behavior Flow report to see which pages visitors most commonly navigate to and where they drop off.
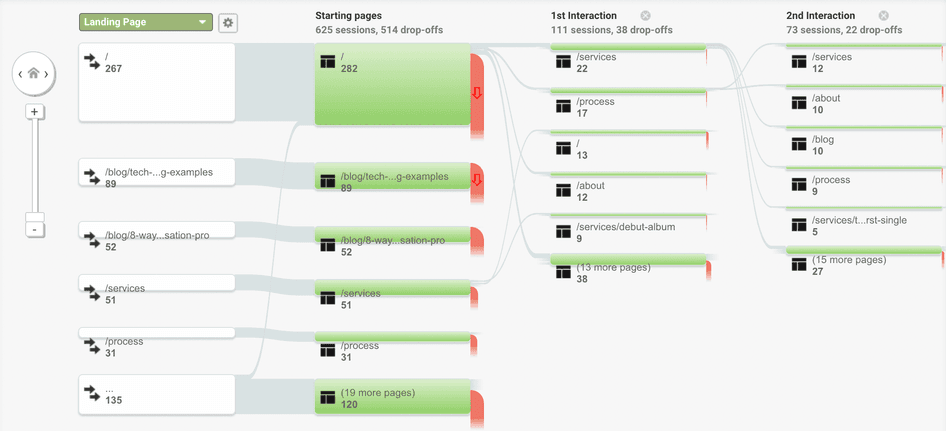
What you’ll learn from analyzing the user journey
See how journeys from key segments differ
You can also segment your data in Google Analytics to see Behavior Flow reports for different segments—like website traffic coming from paid ads, or visitors from Germany.
Keep in mind that different traffic sources often correspond with different stages of the buying journey. For example, users who visit blogs are often purely seeking information. But users who click on a promotional email may be ready to buy.
Looking for trends in their behavior can help you optimize the site for their journeys. For example:
Visitors who come from email tend to visit your support pages: this could suggest they’re ready to buy your products, but they’re having a problem—like a coupon code that isn’t working
Visitors who go directly to your homepage often navigate to a specific product: if the market is highly aware of one of your products, streamline the journey by linking to it directly from your homepage
🔥 If using Hotjar
Want to view session recordings or survey answers from visitors who entered via a specific page on your site? Use the referrer URL filter to find Hotjar data from the pages you’re interested in.
Find out what content captures users’ attention
What pages do key segments commonly navigate to on their journeys? As well as helping you determine your most popular products, this insight can lead to impactful site improvements. For example:
Capitalize on the blog content users love: identifying your most popular content shows you what your users are interested in and may want to read more about. And if users tend to go further down your sales funnel after reading a specific piece of content, signposting that page across your site could win you more business.
Identify which informational pages help users convert: you might notice visitors who buy clothing products often navigate to a page with size charts first on your ecommerce store. With this insight, you streamline their buying journey by modifying your product pages to include the size charts.
💡Pro tip: use Hotjar Heatmaps to see how far down your page users scroll. If readers aren’t finding key information they need to make a buying decision, consider moving it to a more prominent location.
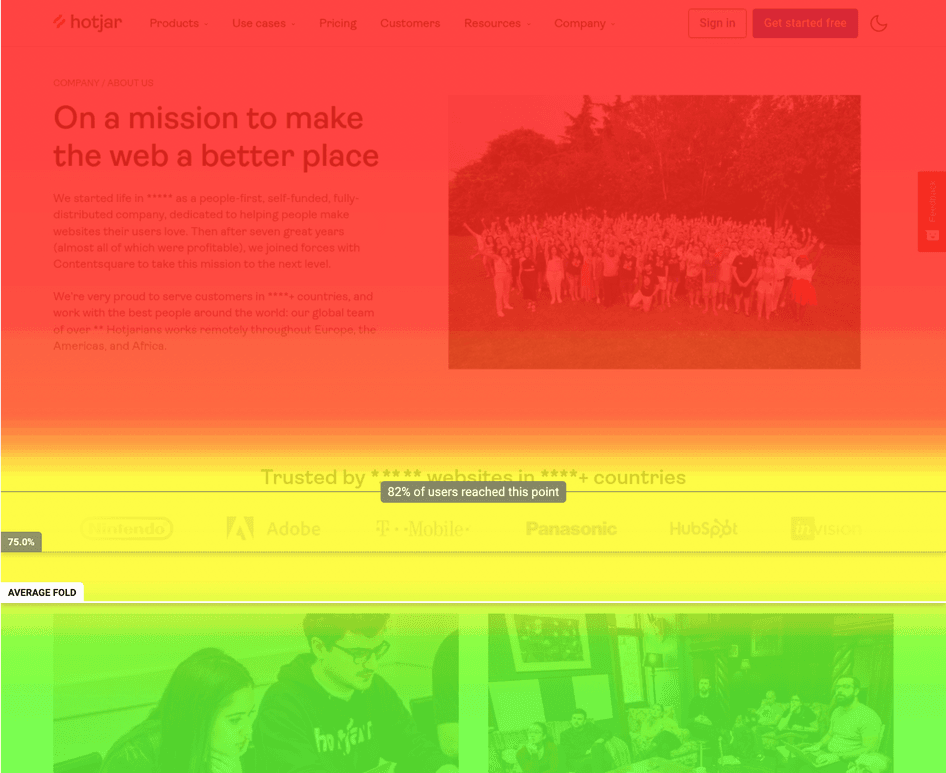
Heatmaps show you where users scrolled to, with blue representing the least viewed area
Find out where users drop off
User journeys should naturally conclude on certain pages, such as your Contact Us page. But if your funnel analysis reveals that users commonly drop off in places you don’t want them to, it’s worth taking a closer look.
Note down any pages with a noticeably high drop-off rate—we’ll look at them more closely in the next step.
6. Observe user needs and perspectives on key pages
Now, it’s time to use behavior analytics tools (like Hotjar! 👋) to better understand user sentiment on the pages you identified in the previous step.
On pages where users commonly drop off, you’ll want to learn their motivations and doubts. And on pages users frequently navigate to, you’ll need to know what they’re interested in and what they want next.
It’s also a good idea to look at user behavior and needs on pages you simply know to be important, such as your homepage. For example, do users typically navigate using your dropdown menus or your search bar?
Let's take a look at how to understand what motivates and discourages users on your site:
Ask visitors what they need
Analytics data gives you clues about what users need—but often, the best way to learn is by simply asking them.
Use on-site surveys to ask more insightful questions, like:
What could we do to improve this page?
What kind of content would you like to see from us next?
Will you make a purchase today? (If the visitor clicks ‘no’, use follow-up questions to ask why)
✅ You'll find more example questions in our website analysis checklist.
Discover what grabs the attention of different segments
In an earlier step, you identified the most common journeys different audience segments take through your site. Behavior analysis tools help you expand on these insights by answering questions about your users’ motivations on key pages. For example:
What interests first-time visitors most on your homepage?
Which support links do trial users of your app click on?
Which menu items do users from a specific industry navigate to?
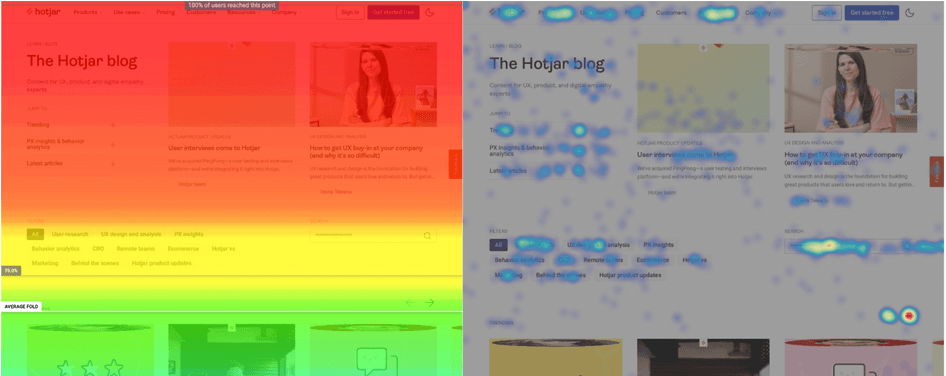
One of the best ways to gather these insights is with heatmaps. By using a heatmap tool with advanced data filters (like Hotjar!), you can visualize where different segments click and scroll to on key pages.
🔥 If using Hotjar
Leverage User Attributes in Hotjar to filter your results using data points from other platforms. For example, integrate your data from Segment to view heatmaps from users who previously spent over $500.
I use heatmaps—specifically click maps—to discover one of the most common conversion issues on websites: the element visibility issue. This is when an element that’s important in the user's decision-making process is not seen, either because people don't scroll on a page or because it's hidden under a slider, a dropdown, or a tab.
These are often some of the easiest and cheapest changes you can make, because they don't require additional copy or design changes but simply moving elements around to make them more visible.
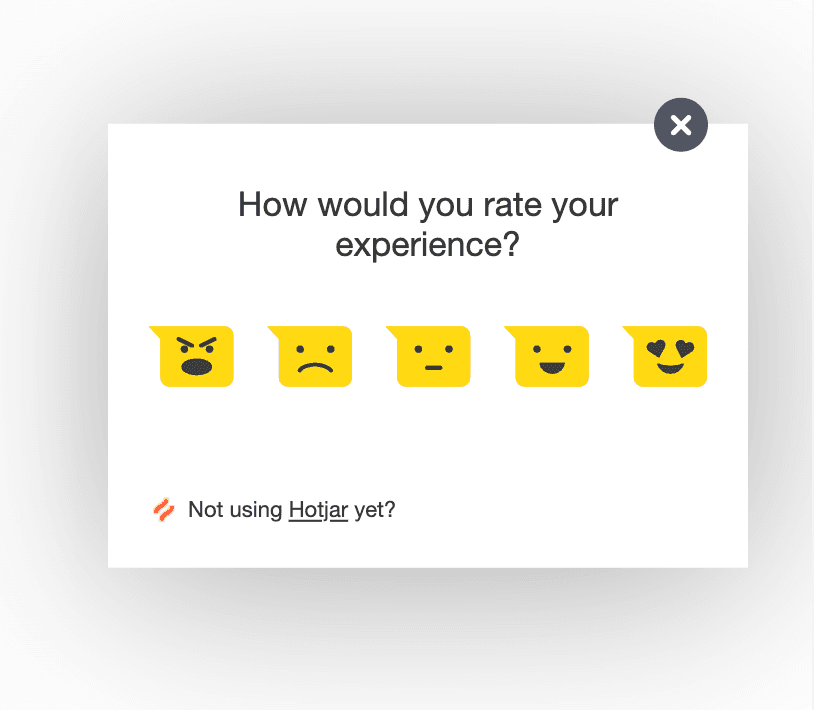
Get quantitative data on user sentiment
To understand users’ perspectives, you ideally want to gather both qualitative and quantitative data about their experiences.
While open-ended questions let you explore individual users’ perspectives, Hotjar Feedback widgets help you quantify how entire audience segments feel.
This is helpful in two ways:
See how sentiment changes across the customer journey: let’s imagine most visitors travel through five key pages before exiting. With aggregated feedback scores, you find that most pages are rated 4.5 on average—but on a page where users are dropping, the average score is just 3.
Track how effective your optimization efforts are: after making a key change to your content, did the improvements actually work? Check whether your average user sentiment has changed to find out if your content is still what’s holding users back.
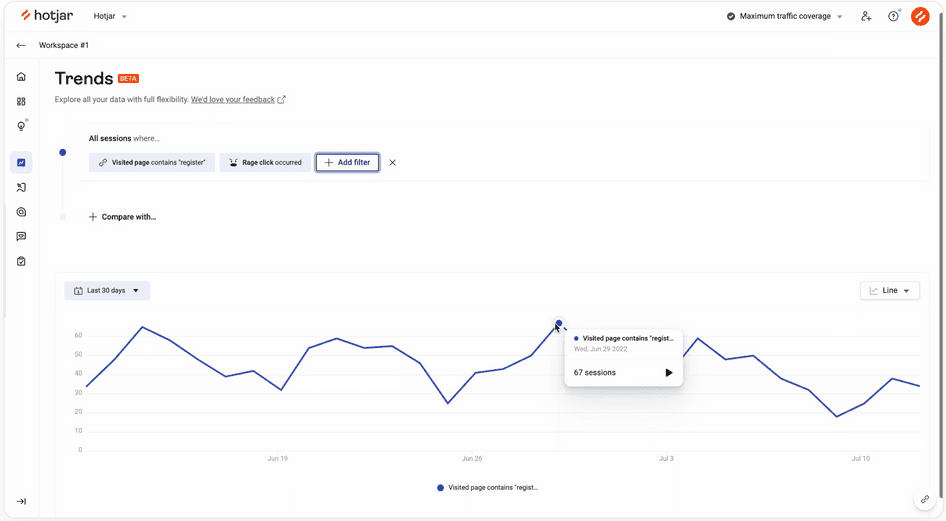
🔥 If using Hotjar
Hotjar’s Observe Scale plan gives you access to the Trends tool so you can get a clear visualization of how data changes over time. Trends plots graphs and charts of your data, with handy filters that let you analyze and compare key segments with ease.
7. Get to the bottom of why visitors are leaving
When users are dropping off conversion-focused web pages (like your checkout), it often represents a deeper problem. Here's how to understand why visitors are failing to convert on important pages:
Find the most problematic pages: do any of your pages have significantly higher bounce or exit rates than others? Are there differences in how much your audience segments leave from specific pages?
💡Pro-tip: find drop-off points faster with Funnels!
Hotjar’s brand-new tool, Funnels, lets you visualize your entire funnel at a glance. Use it to see where users are dropping off, then click to view recordings of their journeys.
A user finds the main drop-off point in their funnel, then starts watching recordings of users who exited from there
Use exit-intent surveys to find out why users are leaving: exit-intent surveys appear when the user looks like they’re closing the page or tab—the perfect moment to get helpful feedback from them
Watch recordings to see how users behave on those pages: replay the users’ journeys to see what they did just before leaving. Were they encountering bugs, showing signs of confusion, or getting distracted by something?
Boosting form conversions: Hotjar + re:member
re:member is a trademark of Entercard, one of Scandinavia’s leading credit market companies. Its senior marketing specialist, Steffen Quistgaard, saw users bouncing off the company’s credit card form application more than usual.
Analyzing Hotjar Recordings and Heatmaps, Steffen noticed that users were:
1. Hovering their mouse over the ‘benefits’ section near the form
2. Scrolling up and down the form rather than filling it out
3. Attempting to click on the benefits section (which was non-clickable)
4. Clicking through to the homepage
Steffen concluded that users were interested in the credit card but didn’t understand its benefits well enough to make a decision.
Steffen and his team redesigned the forms to display more information so users didn’t need to search around. The result was impressive: a 43% increase in conversions.
8. Ask for feedback from users who converted
It's a plausible assumption that users who converted were satisfied with their website experience—and there’s still plenty you can learn from them. Luckily, a user who’s had an overall positive experience on your site is often more inclined to answer your questions.
Use surveys to ask key questions like:
What almost stopped you from buying from us today?
What was your biggest challenge, frustration, or problem with finding us online?
What other providers did you look at when researching this purchase?
On a scale of 1–10, how likely are you to recommend us to a friend?
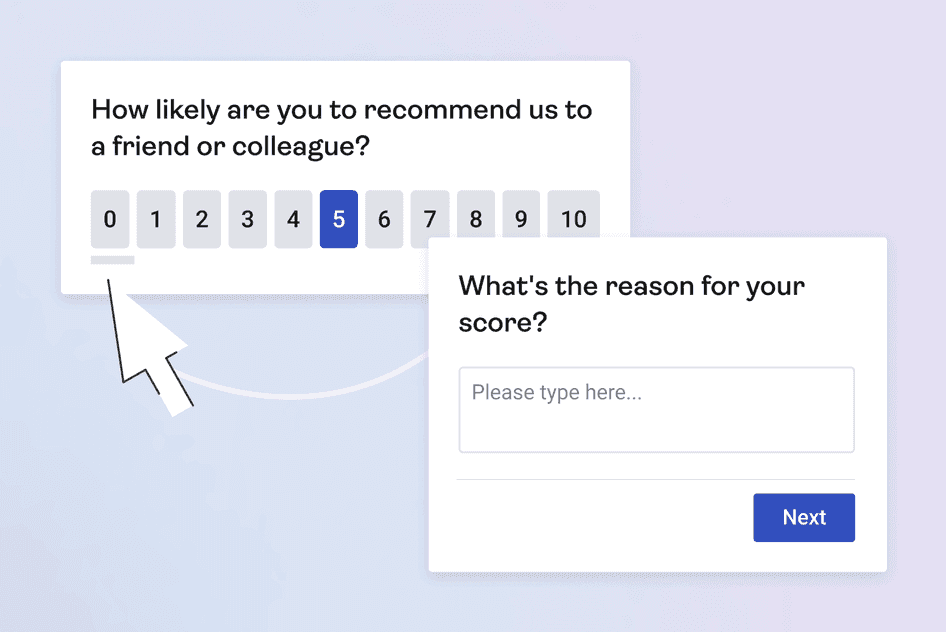
💡Pro tip: asking how likely customers are to recommend you gives you your Net Promoter Score (NPS)—a widely used method for gauging customer satisfaction. Use our ready-made templates to set up NPS surveys quickly in Hotjar, then visualize your NPS score over time with Trends.
9. Prioritize next steps in a final analysis
By the end of this process, you should have an idea of:
Whether you have any major technical and SEO issues
How you stack up against competitor websites
What users care about on your strongest (and weakest) web pages
Which user needs you could serve better to stop visitors from leaving
Use these insights to compile a list of potential improvements you could make to your website. Next, put them in order using prioritization frameworks, like the RICE method, to determine what changes you should work on next.
A successful website analysis starts with the right data
The more your business relies on your website to generate revenue, the more important it is to carry out regular analyses. After all, your customers’ needs continue to evolve and change—and so do the companies you’re competing with.
But if you want to get the edge on your competition, you can’t rely solely on best practices or industry trends. The answers to your most difficult questions will come from the people that matter most: your users. By gathering data on their needs and experiences, you get right to the bottom of what’s happening on your website.
Learn more about your users with Hotjar
Use Surveys, Recordings, Heatmaps, and Interviews to get detailed insights that fuel your website analysis.