Learn / Blog / Article
Hotjar vs. Smartlook: choosing the right platform for your business
Hotjar and Smartlook have similar analytics tools and features, but there are some key differences to consider when choosing the best option for your business. While Smartlook offers a reliable, basic package for analyzing user behavior, Hotjar’s uniquely customer-centric tools put empathy at the forefront to drive a deeper understanding of your UX.
Keep reading for a deep-dive comparison between Hotjar and Smartlook, and learn more about what each platform offers for analyzing your user behavior. We cover:
Grow your business with Hotjar
Use Hotjar’s comprehensive suite of user experience and behavior analytics tools to make data-backed, customer-centric product decisions.

TL;DR
Here are the highlights of what you need to know about Smartlook vs. Hotjar:
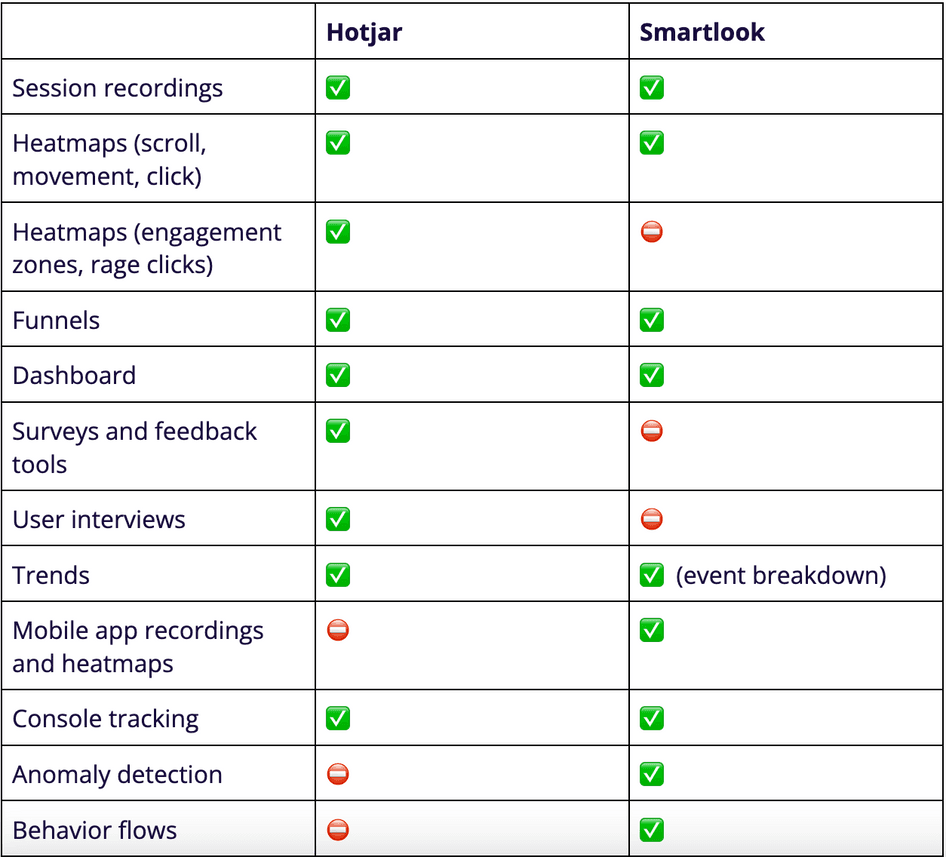
Hotjar’s voice-of-the-customer (VOC) tools make the platform a fully-rounded, customer-centric choice for gaining user empathy and tapping into real user insights. Smartlook does not offer any VOC tools.
Smartlook is a bit more expensive, with its Pro plan providing only 30 heatmaps a month and three months of storage. Hotjar’s equivalent Business plan offers unlimited heatmaps, 12 months of data storage, and access to VOC tools.
Hotjar’s broad spectrum of tools works holistically, making it great for all businesses. Smartlook works better for smaller companies looking to cover the basics of user analytics.
It’s tricky to analyze dynamic content in Smartlook Heatmaps. Hotjar has a flexible screenshot retaker tool that allows you to see interactions on drop-downs and pop-ups.
Smartlook’s heatmaps show scroll, click, and cursor movements. Hotjar offers these plus advanced heatmaps to measure engagement and frustration.
Hotjar’s collaborative tools drive knowledge sharing in cross-functional teams, whereas Smartlook’s collaboration capabilities are limited.
Smartlook’s short-term data storage means that, without using their pricey add-ons, it’s difficult to monitor your website improvements over time.
Smartlook can analyze user behavior gathered from mobile apps, whereas Hotjar only collects insights from websites and web-based applications.
A brief note on Smartlook’s future
Smartlook was acquired by Cisco in mid-2023. It’s still unclear in 2024 what plans Cisco has for Smartlook in the years to come. And we won’t speculate on that here. But it’s a notable bit of news that you might want to consider if you’re evaluating tools for the long-term.
The main differences between Hotjar and Smartlook
Before diving into a deeper comparison of what Hotjar and Smartlook have in common, let's look at some key differences in the tools and features.
Hotjar provides visual behavior insights, in-the-moment feedback, and user interviews, giving you everything you need to analyze your website and understand your users in one place.
Smartlook offers a good basic package of heatmaps, recordings, and analytics that gives you an overview of website performance and user behavior.
In this blog post, we focus primarily on Hotjar and Smartlook's free plans, looking at the following:
User feedback and surveys
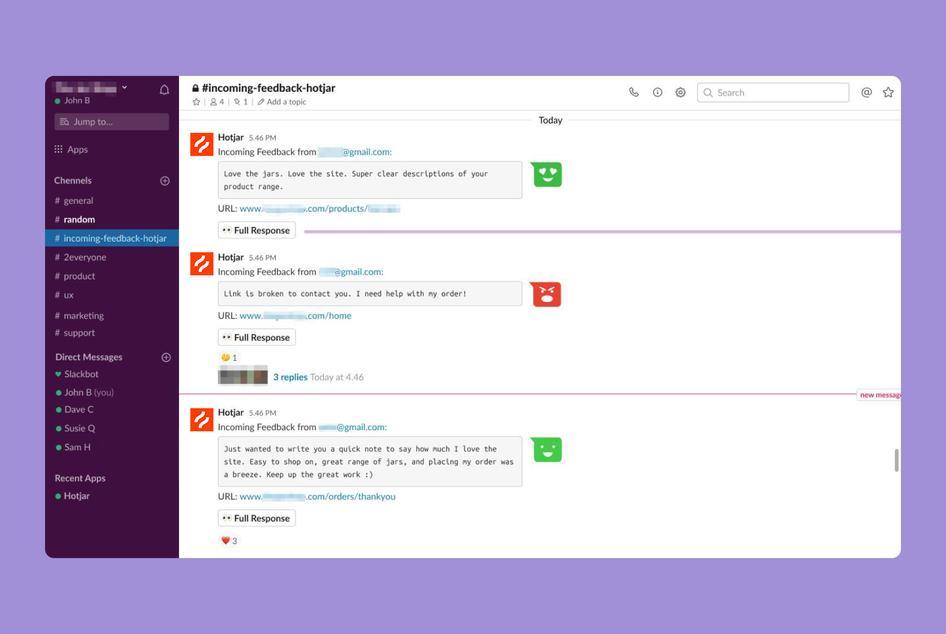
User feedback and survey tools immediately set Hotjar apart in this comparison. Hotjar offers Feedback and Surveys in our Ask product, available on the free forever Basic plan.
The Hotjar Feedback widget is a simple, discreet way to capture in-the-moment opinions from users as they explore your site, giving you insight into the user experience without subjective analysis or guesswork.
With Feedback, visitors can:
Rate their experience with stars or emojis
Add a comment
Attach a screenshot of an element on the page
Leave their contact details if they want a follow-up
If you want to assess whether user sentiment changes after site updates or redesigns, you can review feedback scores over time and compare results.
Hotjar Surveys takes a different approach to gathering feedback, but is also designed to gather actionable, unfiltered user insights.
Surveys lets you ask visitors as many questions as you like and provides free ready-made templates with question guidance to inspire you when you’re getting started. While Feedback is excellent for catching spontaneous comments, you can send Surveys via email after your user has left your site so they can answer in their own time and go into more detail.
You can also trigger surveys to appear on pages based on:
Specific user attributes, like subscription type, country, and role
Events or user actions (e.g. when someone exits a page or cancels their subscription)
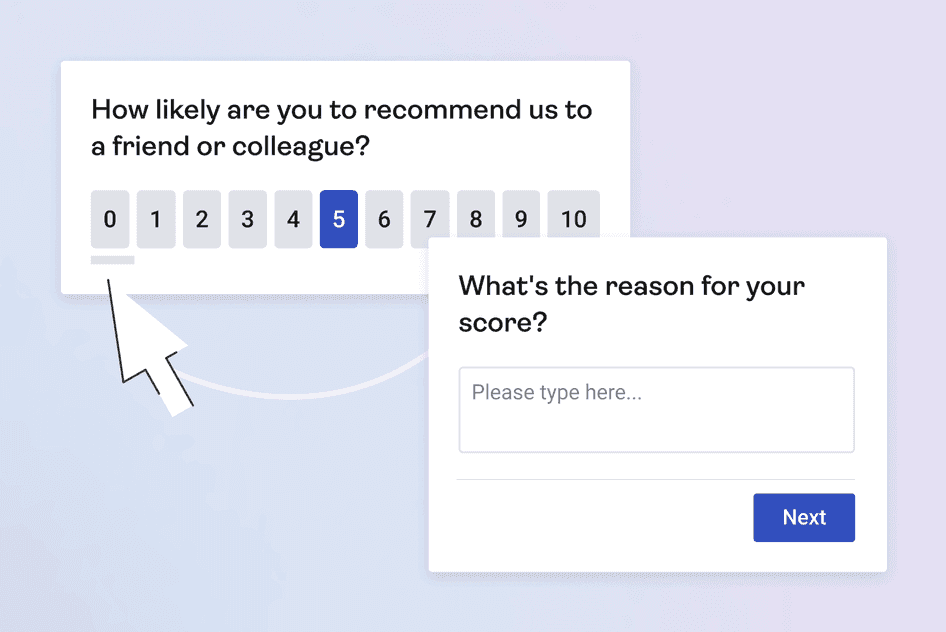
An example of an NPS® survey created with Hotjar
You can even integrate Feedback and Surveys to send real-time user feedback to your relevant channels, like Slack, Microsoft Teams, or Gmail. This means you can immediately take action to fix any bugs or pain points for your users without waiting around for dedicated analyses.
Smartlook doesn’t provide any VOC tools that let you gather user and product feedback.
💡 Pro tip: watch recordings that accompany feedback responses and see through your users’ eyes to understand what they were experiencing during their time on your site.
User interviews
The Hotjar Engage product lets you hold user interviews that reveal people’s perceptions of your brand, product, or user experience.
Within the Engage tool, you can host, record, and transcribe calls with users to fully understand what they think of your site. Instead of watching isolated recordings or heatmaps and trying to understand the people behind the data, user interviews bring you face-to-face with your audience so you can see what they love or hate firsthand.
On Hotjar’s free Basic plan, you can host up to 60 30-minute interviews and store your website visitor recordings for two weeks. Upgrading to a paid plan gives exclusive access to Hotjar’s private pool of 200k+ testers.
Smartlook doesn’t include any user interview tools as part of its platform.
💡 Pro tip: level up your collaboration and add your team as interview observers so everyone can be a part of the conversation. It’s a great way to build a human connection and drive user empathy for everyone involved.
Mobile app user analysis
Smartlook lets you analyze user behavior on mobile devices and is compatible with iOS and Android apps. They integrate with multiple platforms for cohesive user analysis.
Smartlook lets you analyze user behavior with:
Native rendering to provide a more accurate representation of the user experience
Wireframe mode so distractions are kept to a minimum when analyzing user behavior
Recordings that show the user experience in real time as they interact with an app
Hotjar does not currently offer insights into how people behave on mobile apps, but does let you analyze how users behave on digital products like websites and web apps.
Knowledge sharing and collaboration
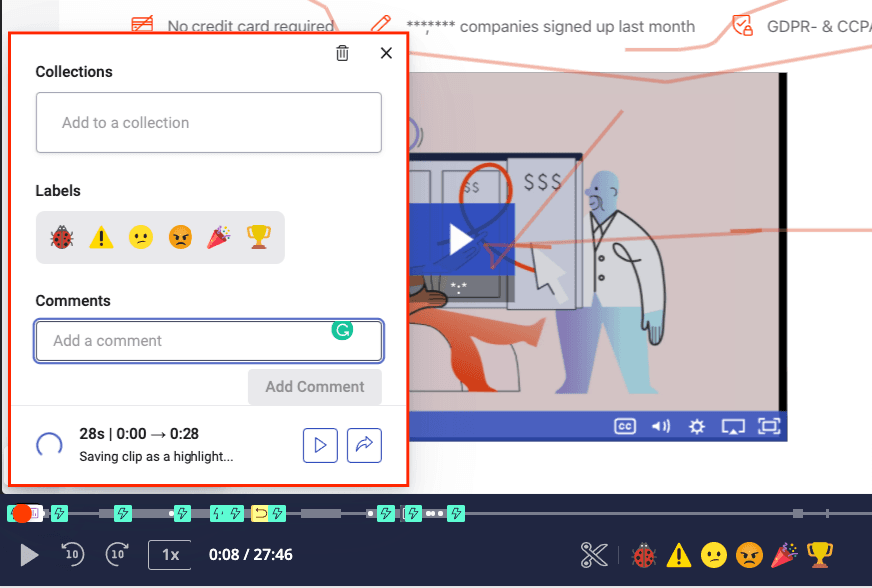
Hotjar Highlights is designed to make knowledge sharing and collaboration a natural part of your workflow, and is available on the free Basic plan.
Highlights lets you create snippets of recordings or heatmaps that catch your eye, then organize them by parameters such as location, date, or type of user behavior (like confusion or conversions) and save them to review later with your team.
Spot some unique user behavior you’d like to analyze further? Check out the feedback or survey response you received from the same user to build a complete picture of their experience, and share your learnings with your team to determine what steps you need to take next.
While Smartlook allows you to share data and tag team members, collaboration capabilities are limited and rely on the primary users to distribute results manually.
💡 Pro tip: Hotjar Highlights makes it easy to create comprehensive reports for sharing with your team. Combine your favorite parts of recordings, heatmaps, and user feedback for a complete picture of your user experience that brings actionable insights to your coworkers or stakeholders.
What are Hotjar and Smartlook’s key tools?
Hotjar and Smartlook offer similar tools, with some key differences in functionality and capabilities.
Let’s get straight to it and assess the tools and features these two platforms have in common.
Heatmaps
In this section, we cover the following in our comparison of Hotjar and Smartlook heatmaps:
Types of heatmaps
Plan options
Page insights
Data collection
Tool features
Hotjar
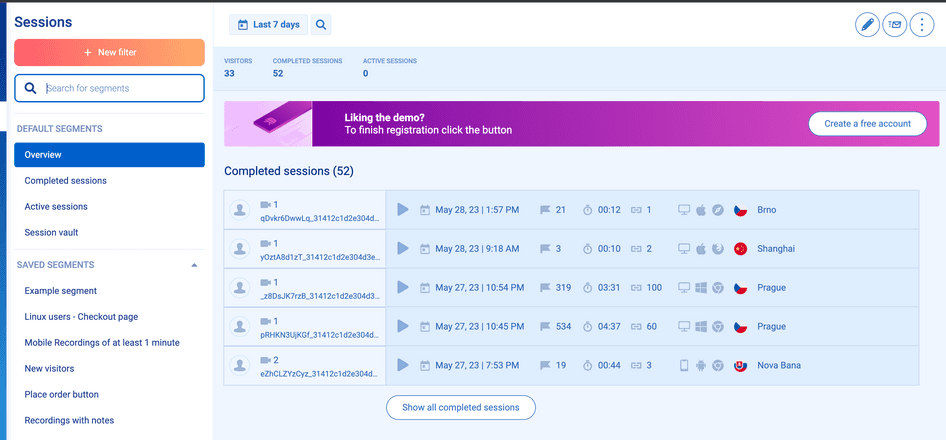
The Hotjar Heatmaps tool is available on every plan. Even the Basic plan lets you create an unlimited number of heatmaps with 12-months’ data retention. There’s no need to set them up manually—once you've installed the Hotjar tracking code on your site, heatmap data immediately starts being collected.
Hotjar heatmaps come in five formats:
Move maps show where your users’ cursors move around a page
Click maps show the elements your users click on (or don’t)
Scroll maps show how far down a page your users scroll
Engagement Zone maps show the sections of a page your users interact with the most
Rage click maps let you visualize which parts of a page are causing users the most friction
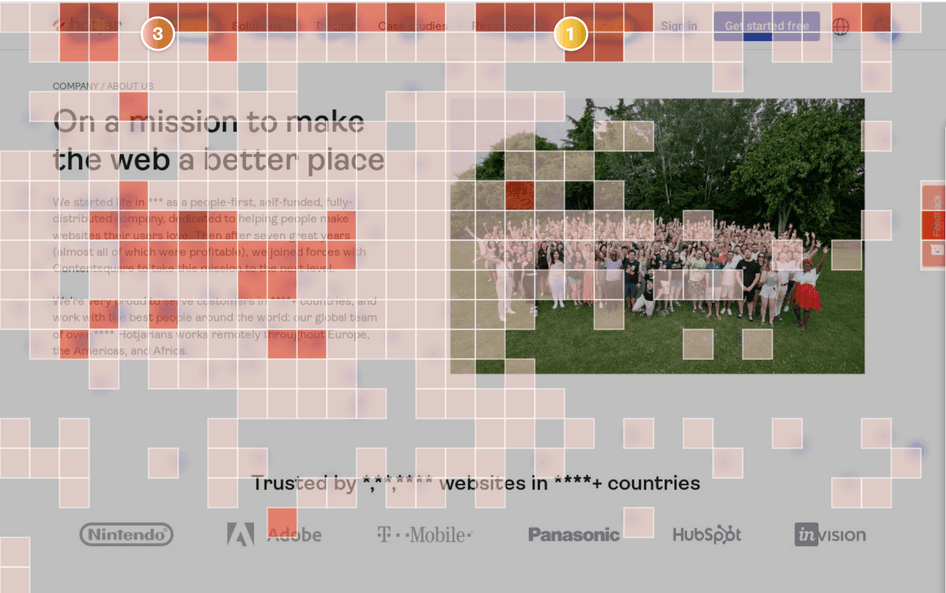
The Heatmaps tool’s intuitive insights panel makes it easy to dig deeper into your data and get to the root of your users' behavior. You can assess everything from u-turn rates and rage clicks with paid plans, or drop-off rates and average time on page with a free Basic plan. Combining tools from Hotjar Observe and Ask products, you can also review the average feedback score of a page with its corresponding heatmap. This lets you see how people engaged with a page and discover what they thought of it.
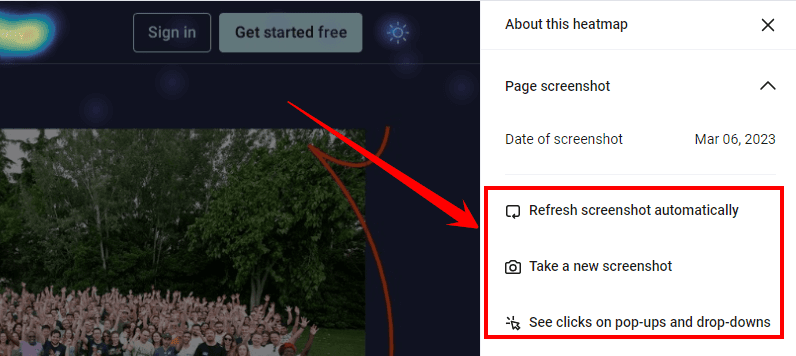
Hotjar's retake function allows you to capture even more accurate screenshots of a heatmap or user session. This option is useful if you want to capture a pop-up or content that is only visible when a user hovers or clicks on a certain area. For example, if an existing screenshot doesn’t quite match the page state that you were looking to analyze, you can retake the background screenshot.
On our paid plans, use Heatmaps to assess:
New vs. returning users
Location and technology used (such as browser and device)
Entry and exit pages
Customers who converted vs. those who didn’t
A/B testing
💡 Pro tip: Heatmaps works hand in hand with Recordings and Feedback, so explore all three tools when you’re analyzing your website’s performance to get a 360° view of the user experience.
Smartlook
Smartlook provides intuitive but basic heatmaps that record 100% of user sessions. However, with their free plan, you only get ten heatmaps a month, and there are limits to how advanced an analysis you can make.
Smartlook offers three types of heatmaps:
Click maps
Movement maps
Scroll maps
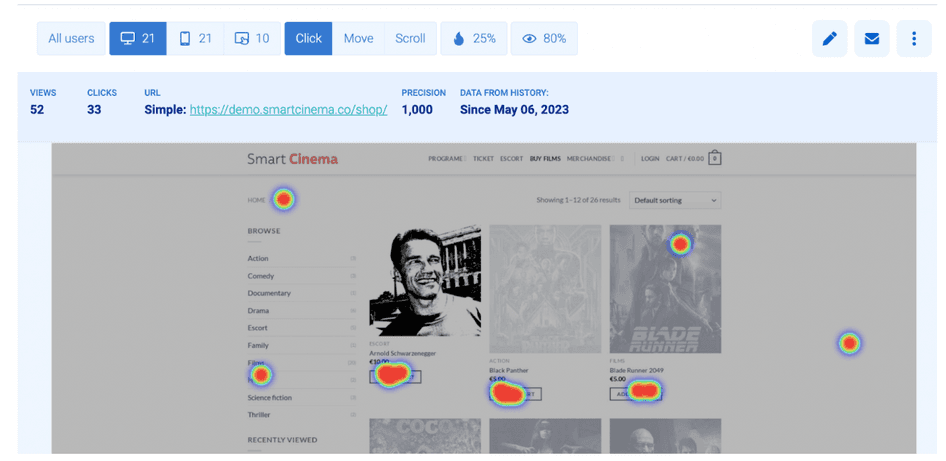
Like Hotjar, once you install the tracking code on your website, Smartlook can use historical data to generate heatmaps instantly.
However, Smartlook heatmaps only offer basic page insights, like views and clicks, so it's difficult to make an in-depth analysis, requiring more labor on the user's part to analyze what’s happening on their site. Historical comparisons are also tricky, as Smartlook offers just three months’ historical data. Finally, there’s also no screenshot retake function, so there’s a risk of missing important information or failing to capture the full scope of what your users are doing.
Why Hotjar wins: Hotjar’s free plan includes unlimited heatmaps. With Smartlook, you only get ten heatmaps for free per month.
Recordings
Smartlook and Hotjar have very similar session recordings tools, and both are available on a free plan. We compare:
Recordings player features
Categorization
Filters
Collaboration
Hotjar
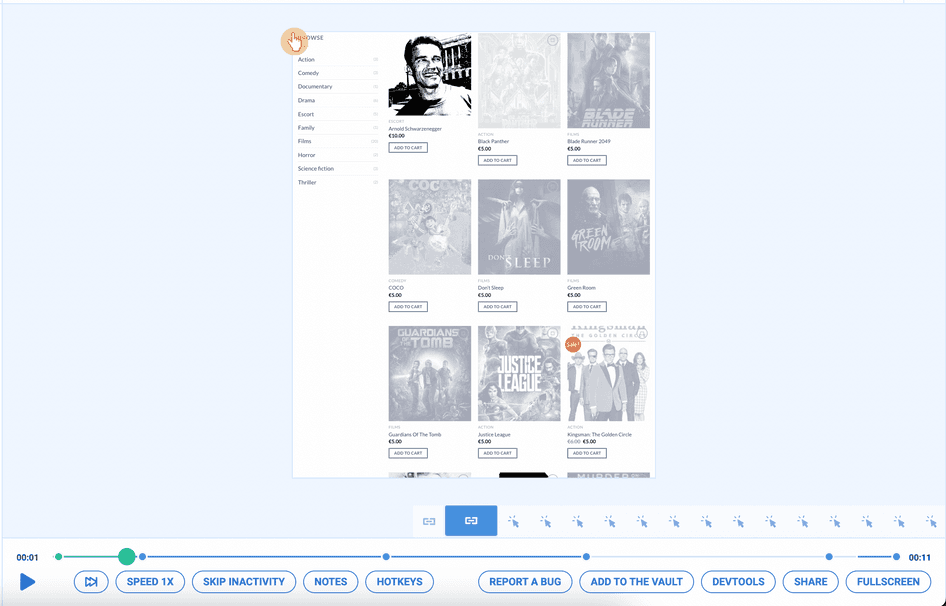
Hotjar Recordings shows sessions spanning a user’s multi-page (and multi-tab) journey on your website. Track your user’s journey from start to finish, and use their wins and pain points to inspire more customer-centric optimizations to your site.
Hotjar categorizes session recordings by relevance, frustration levels, engagement, date, and user location, so you can immediately see which sessions are most relevant to your goals and watch them first.

You can filter user sessions in Hotjar by parameters such as:
Date
User demographics and role
Device used
Specific interactions or events
You can also save configurations of your favorite filter combinations as ‘segments’ to only see the data that matters most to your business without manually applying them each time you enter the tool.
Skipping straight to the most interesting parts of a recording is also easy with Hotjar. You can find what you need with minimal effort, as each recording is highlighted with timestamps to show particular user actions—like rage clicks, u-turns, and feedback.
Instead of viewing these actions in isolation, you can see the context behind the behavior for better insight into your customers’ motivations.
You can also see events, like when users:
Visit a new page
Enter an upsell flow
Bounce
Sign up for your newsletter or subscribe to your product
Team members can also attach tags to recordings to highlight certain user actions, so if you only want to analyze incidents of rage clicks with your team, you can easily tag and share these events.
Smartlook
Smartlook’s recordings tool has much in common with Hotjar's. Recordings are saved in a list and tagged by country, session length, browser, device type, and OS.
Smartlook’s recordings player works much the same as Hotjar’s, with the capabilities to see events, jump ahead in a recording video, and see the user attributes of the visitor in the recording.
Smartlook recordings can be filtered by data subsets like
Visited URL
Country
Device used
Specific events, such as scrolls and clicks
But Smartlook recordings aren't sorted by variables such as the session length or user behavior. Smartlook recordings are sorted by date, with the most recent recording at the top.
Smartlook lets you see where certain events took place in a recording’s timeline—such as errors, notes, or clicks—and filter by those events so you only see those incidents during a session. For example, an engineer who only wants to watch the error events of a session can apply the error filter and skip any extraneous parts of a recording. You can do this in Hotjar too.
You can also add comments at specific timestamps to share information and draw attention to interesting behavior, so you can search for recordings with specific words and focus on certain behaviors or bugs.
However, since no set terminology or automated tagging is built into the player, this relies heavily on Smartlook users agreeing on naming conventions in advance.
Why Hotjar wins: recordings from Hotjar pair directly with user feedback and heatmaps, giving you a complete view of the user experience. Hotjar recordings can be sorted by UX scores (engagement or frustration) to make viewing and analysis a much more efficient process.
Dashboards
Comparing Hotjar and Smartlook’s dashboard tools, we cover:
Main features
Types of insights
Ease of use
Hotjar
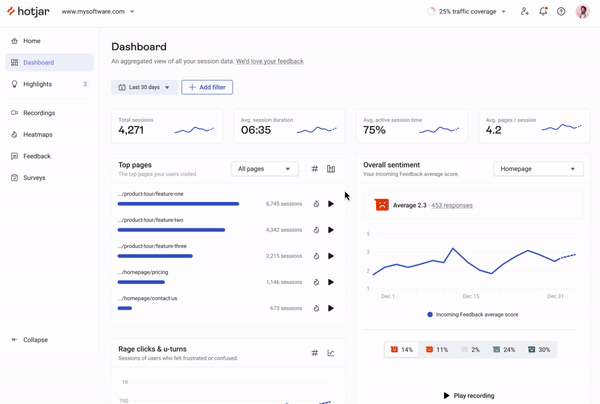
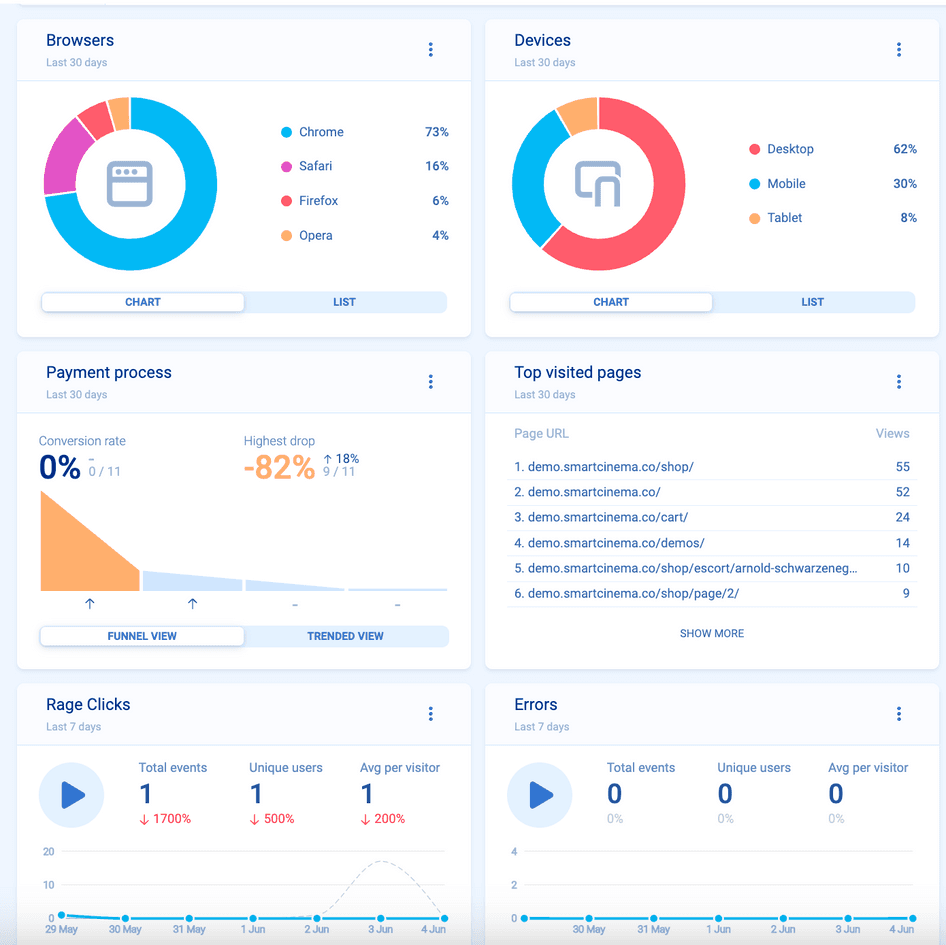
Hotjar’s dedicated Dashboards tool organizes all key metrics and data points on one page.
Dashboards give you easy access to recordings, heatmaps, and high-level charts for advanced analysis. They uniquely combine both what users do on your site, with how they feel about it. You can create unlimited dashboards on all pricing plans. And set them up in seconds with templates for common use cases. This helps you quickly identify which areas on your site need special attention without the extra effort of having to sort through individual tools to analyze your site’s performance.
Smartlook
Smartlook similarly lets you create multiple project-specific dashboards and has a main dashboard hub that gives you an overview of each tool. However, there are no templates to get started quickly, and it doesn’t offer much more than high-level impressions, requiring you to investigate further.
Why Hotjar wins: Hotjar Dashboards compile data from every area of the platform into visual, project-specific hubs, giving you a high-level view of key insights—from recordings to user feedback—and enabling you to make sense of visitor behavior.
Funnels
Looking at the Hotjar and Smartlook funnel tools, we cover:
Important features
Insights you can expect to see
Plan differences
Hotjar
Hotjar Funnels allows you to map out journeys on your site and gives you an overview of your conversion rates at every step, so you can clearly understand where and when customers convert (or don’t).
With Hotjar Funnels, you can add up to ten steps in a flow and include actions such as when users:
Visit a specific URL
Click on certain elements or fields
Enter specific searches
Trigger custom events
Like the rest of Hotjar’s tools, funnels also come with recordings. You can see what was happening on-site when users dropped out of the funnel or converted, giving you a complete overview of the user experience so you can piece entire user journeys together.
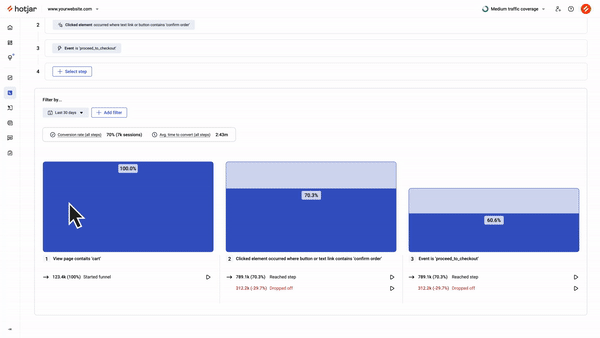
Compare funnels against each other to understand whether changes on your site—such as bug fixes or redesigns—made a difference to your conversion rates. It’s a fast, easy way to complement A/B testing, spot website issues, maximize your CRO, and analyze potential blockers or bugs.
⚠️ Hotjar Funnels is only available on the Observe Scale plans.
Smartlook
Smartlook’s conversion funnels tool is where it really excels. The funnels tool is available on free plans for both desktop and mobile.
You can add more than 15 steps to Smartlook funnels, and they come with automatic email reporting, so you don’t overlook any interesting developments.
As with Hotjar, funnels come with accompanying recordings to provide additional context behind user behavior and show the why behind any drop-offs, so you can find:
Broken elements
Hidden bugs
High-exit pages
Pages that lead to conversions
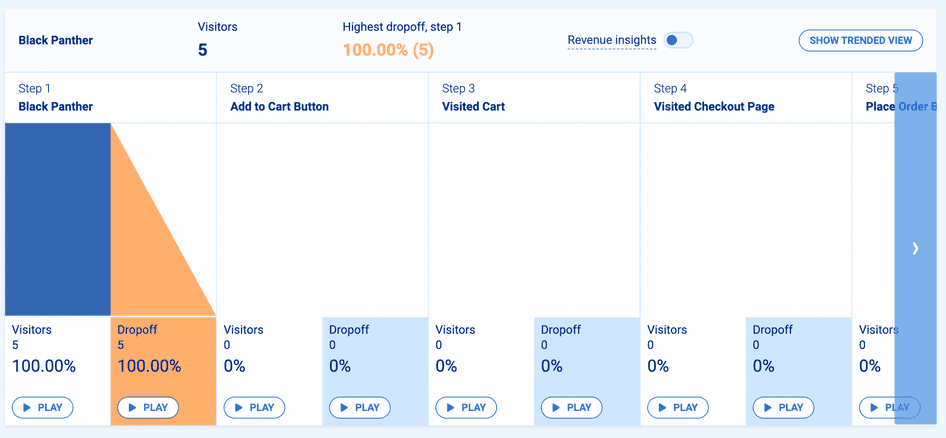
Smartlook’s funnel anomalies feature lets you create thresholds for drop-offs, which trigger alerts if they’re surpassed, so if there’s a sudden spike in drop-offs you can quickly identify and fix any issues before they cause too much damage.
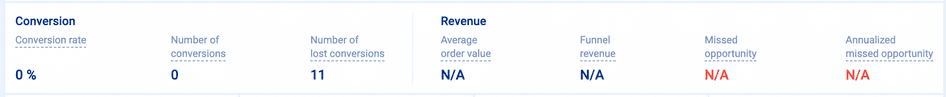
With the revenue insights feature, you can attach average values to events like ‘purchase complete’ to understand how much money drop-offs cost your company and get a sense of the overall profit and loss you incur during each step of the customer journey.
⚠️ The values shown in revenue insights aren’t based on real individual purchases but on an estimation of the average value of purchases within a specific date range.
Smartlook also allows you to preset custom variables—such as user location—to filter funnels.
One notable disadvantage to this tool is that you can’t compare Smartlook funnels for testing purposes, so you need to analyze each funnel individually. And Smartlook’s 3-month data retention limits may mean you run into challenges with historical trends.
Why Smartlook wins: Smartlook’s funnels are available on their free plan and offer revenue insights, which are particularly helpful to ecommerce businesses.
Additional capabilities of Hotjar and Smartlook
Along with Hotjar and Smartlook's tools, there are additional features and capabilities across both platforms regarding how they work and what they can reveal about user behavior.
Here we take a look at:
Error reporting
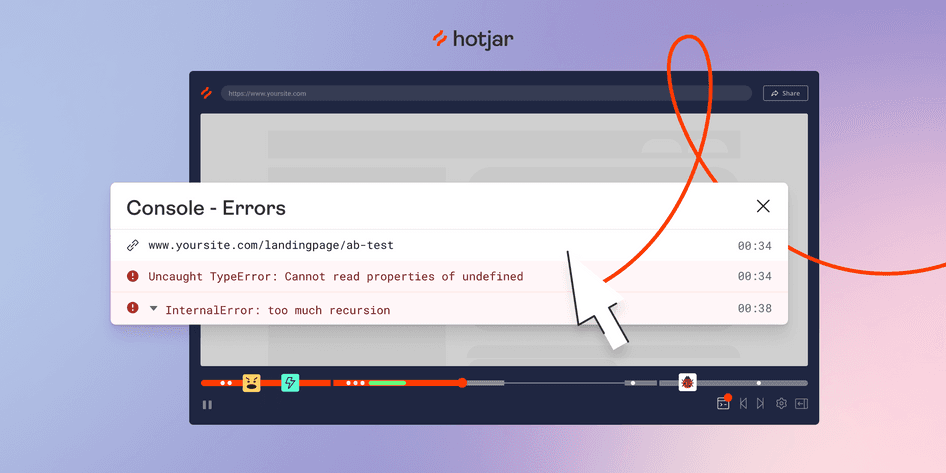
Available only on Pro and Enterprise plans (or via an add-on), Smartlook’s error reporting features are a bit more advanced than Hotjar’s. Smartlook's crash reports feature shows you recordings for additional insight into user behavior and site issues during a crash. The feature lists crash or error types, the events involved in the crash, and the number of users affected. While there’s more detail than Hotjar’s reports, Smartlook’s error reports involve more complex data and require engineering expertise to understand what actions to take.
Smartlook's crash reports feature shows you recordings for additional insight into user behavior and site issues during a crash. The feature lists crash or error types, the events involved in the crash, and the number of users affected. While there’s more detail than Hotjar’s reports, Smartlook’s error reports involve more complex data and require engineering expertise to understand what actions to take.
Smartlook’s DevTools also allow you to review technical data such as:
Network activity
Console logs
JavaScript errors
Latency issues experienced by visitors
Available only on Observe Scale plans, Hotjar’s error reporting functions provide data accessible to every team—from UX designers to product marketers—with no engineering knowledge needed. Hotjar's console tracking allows you to track on-site JavaScript errors and categorize your data with error filters.
Data storage
Both platforms allow you to store data for extended periods, however, the extent and costs differ significantly.
Hotjar offers one year of storage time with the Observe Basic plan, so your recordings, heatmaps, and crucial user session data are stored for free.
Smartlook only stores your data for a maximum of three months on their Pro plan, or you can purchase their Product Analytics add-on for 12-months data retention. Without this add-on, three months is rarely enough time to develop a thorough understanding of your users’ behavior and trends as you make changes to your site.
Integrations
Smartlook and Hotjar have similar integration capabilities compatible with Slack, Microsoft Teams, and Google Analytics.
Smartlook also offers integrations with Survicate, Make, Piwik PRO, and Sentry. Hotjar currently does not provide integrations with these tools, but does offer integrations with more task management tools like Trello and Linear.
Check out the complete list of Hotjar integrations here.
Filters
Hotjar and Smartlook also offer similar sets of filters. You can analyze your data by categories like:
User email address
User ID
Custom events
Rage clicks
Date
Hotjar also allows you to filter by u-turn so you can see exactly why a user decided to jump back to a page, which is not an option with Smartlook.
Smartlook allows you to treat custom properties and custom events as different filters. Hotjar gives you access to the same functionalities; you just have to apply a naming convention to Google Analytics events in Hotjar’s custom events filter.
Events
Hotjar and Smartlook have a lot in common when it comes to events.
For event picking, Hotjar’s ‘clicked element’ filter allows you to monitor interactions on pretty much any element on your site, like specific CTAs or links. You can also send events to Hotjar via our Events API. Smartlook lets you categorize and group events by URLs and clicked elements. You can then use the event breakdown feature to analyze these individual events in depth. You can also send events via Smartlook’s API.
One bonus for Smartlook is the ability to merge events or create composites, meaning you can use actions such as ‘visited page’ followed by ‘clicked element’ to create an event that maps out a journey or specific user type.
Smartlook lets you categorize and group events by URLs, typed text, and clicked elements. You can then use the event breakdown feature to analyze these individual events in depth.
Smartlook also lets you merge events or create composites, meaning you can use actions such as ‘visited page’ followed by ‘clicked element’ to create an event that maps out a journey or specific user type.
Privacy
Smartlook and Hotjar are vocal about their commitment to privacy, and their tools’ capabilities reflect this, with both platforms being GDPR, CCPA, and LGPD compliant.
All user information is restricted to essential details, and both platforms use element suppression to mask certain areas of a page so they’re not sent to our servers, and don’t appear in recordings. However, one notable difference is that Smartlook offers a ‘text typed’ filter, which let’s you see whatever users type while on-site. In contrast, Hotjar suppresses that information, so any sensitive data typed is seen as asterisks.
Both companies permanently delete all data from heatmaps, recordings, and team activity after 365 days.
Trends: exclusive to Hotjar Observe Scale
Trends is a unique tool in this comparison, and is exclusive to the Hotjar Observe Scale plan.
With Smartlook’s event breakdown, you can see horizontal bar charts of an event (e.g. an item being added to cart) broken down by user segments, e.g. geo or device. However, Smartlook doesn’t offer a dedicated tool to map events over time.
Hotjar Trends works by visualizing user metrics and turning them into easy-to-understand charts and graphs that reveal patterns in user behavior. Trends lets you analyze more complex trends that have many different variables.
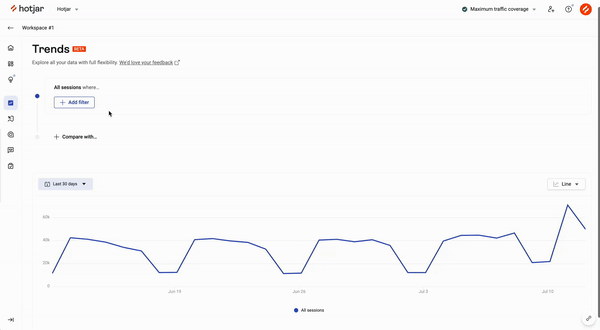
Trends allows you to compare and cross-reference charts and watch accompanying recordings for further context into user behavior so you can make sense of their interactions and experiences on your site. Rather than taking user behavior for granted, Trends makes it clear where you’re winning, where you need to improve, and how users feel about your product.
You can filter data by subsets such as:
User demographics
Date
Events
URL
The best bit is that when you’re looking at a recording or heatmap, and wonder how often a particular interaction occurs on your site, you can immediately jump to a trend chart in one click to see exactly that. This gives you a whole new perspective on user behavior.
Trends is a great next step for businesses that want to tap into even more avenues for gathering user insights and developing customer empathy.
Why choose Hotjar?
Smartlook is a solid option for smaller businesses looking to tackle the basics of their behavior analysis and website performance.
However, Hotjar’s combination of user feedback tools with heatmaps and recordings gives you an unbeatable level of insight into user behavior. Hotjar's range and depth of intuitive tools and features, competitive pricing, and collaborative capabilities make it easy to analyze your quantitative and qualitative data.
With its uniquely user-centric approach to behavior analytics, Hotjar was designed to inspire empathy and drive actionable optimizations to your website or product so you can keep making customer-centric decisions for your business.
In short, it’s the obvious choice for businesses that want their customers at the heart of their growth.
Grow your business with Hotjar
Make data-backed, customer-centric decisions about your business with our comprehensive suite of behavior analytics tools.
Related articles
Hotjar vs.
Hotjar vs. PostHog: which one should you choose?
Hotjar and PostHog are behavior analytics software designed to help you understand how people experience your website or products. But there are a ton of differences under the hood.
This guide helps you spend less time choosing software, and more time working on what matters most: delighting customers and growing your business.

Hotjar team
Hotjar vs.
Hotjar vs. Clarity: which one should you choose?
Both Hotjar and Microsoft Clarity help you understand what’s happening on your website by collecting and analyzing user behavior data for free. But that’s where the similarities end.
Hotjar team
Hotjar vs.
Hotjar vs. Crazy Egg: which one is right for you?
Behavior analytics suites like Hotjar and Crazy Egg help you fill in the gaps left by other tools like Google Analytics, reducing guesswork when you optimize your website and product experience.
But which platform’s tools are easier to set up? And which will give you a complete understanding of your users, so you can quickly make the changes they need and ease their journey to conversion?
Hotjar team