Learn / Guides / GA glossary (A-Z)
How to view unique visitors in Google Analytics
Is anybody out there? When you pour your creativity and hard work into your website, service, or marketing campaigns, it’s nice to know if people pay attention. Tracking unique visitors in Google Analytics is one way to confirm real people see and appreciate your efforts.
But knowing how many people visit your website does more than soothe your concerns about whether you’re reaching users—it also helps you communicate your impact to stakeholders and make customer-driven decisions.

This guide teaches you what the unique visitors metric in Google Analytics is, how to measure it, and when to use the metric.
What is the unique visitors metric in Google Analytics?
Unique visitors (or unique users) in Google Analytics is a count of unduplicated individuals who visit your site in a specific time frame.
For example, if Nicole visits your site three times, Tawni visits two times, and Stephanie visits four times, Google Analytics counts that as three unique visitors—even though there were nine separate sessions.
As a refresher, a session in Google Analytics is a collection of someone’s interaction with your websites, AKA their visit to your site or app.
How to find unique visitors in Google Analytics
If you use Universal Analytics (UA), ‘users’ always refers to unique visitors. Any report listing 'users', like the Audience or Acquisition categories, counts unduplicated visitors.
However, this guide focuses on Google Analytics 4 (GA4) since Google transitions to that version in July 2023, and 'unique visitors' isn't the default in GA4. Instead:
'Total users' = unique visitors or unique users ✅
'Users' = active users (NOT unique visitors) ❌
‘Users’ often appear on GA4 reports, but it’s not a direct match for a unique user count. Here are two spots that do list unique visitors in Google Analytics 4.
Engagement events report
The first place to view unique users in GA4 is through the 'Life cycle' Events report:
Open ‘Reports’
Click on ‘Engagement’ under the ‘Life cycle’ section
Select ‘Events’ from the drop-down menu
Read the ‘Total users’ column
The GA4 events report counts ‘total users,’ which they define as ‘the total number of unique users who log an event.’ Image via Google Analytics.
Engagement conversions report
The second option to view unique users in GA4 is through the 'Life cycle' Conversions report:
Open ‘Reports’
Click on ‘Engagement’ under the ‘Life cycle’ section
Select ‘Conversions’ from the drop-down menu
Read the ‘Total users’ column
GA4 tracks unique users for events, not page visits. Image via Google Analytics
When to use unique visitors in Google Analytics
Unique visitors shows you how many individual users you reach, regardless of whether they visit your website once or ten times.
Without taking your unique visitors into account, you’d have a skewed perception of how many customers completed an event, like viewing a product page—imagine if Nicole’s three sessions, Tawni’s two sessions, and Stephanie’s four sessions counted as nine users instead of the actual three.
Here are three scenarios where you’d use unique visitors in Google Analytics as a starting point to understand user behavior.
1. Measure your website’s reach
Imagine a product marketer has custom events in GA4 to measure blog visits and lead magnet landing pages. At the end of the year, they include total users (AKA the number of unique visitors) in a report for stakeholders to compare their performance against goals.
They also include the ‘event count per user’ to measure how many times unique users view content on average.
❗️ But Google Analytics can’t reveal why users return or decide to stop visiting to help the product marketer decrease bounce rate.
2. Compare website traffic before and after updates
Suppose a product designer needs to gauge if a navigation redesign makes it easier for users to find a particular page on their app, so they compare monthly total users for that event from before and after the update.
The unique users count in GA4 reveals whether they met, exceeded, or failed at their engagement goal.
❗️ But Google Analytics doesn’t show how users interact with the redesign.
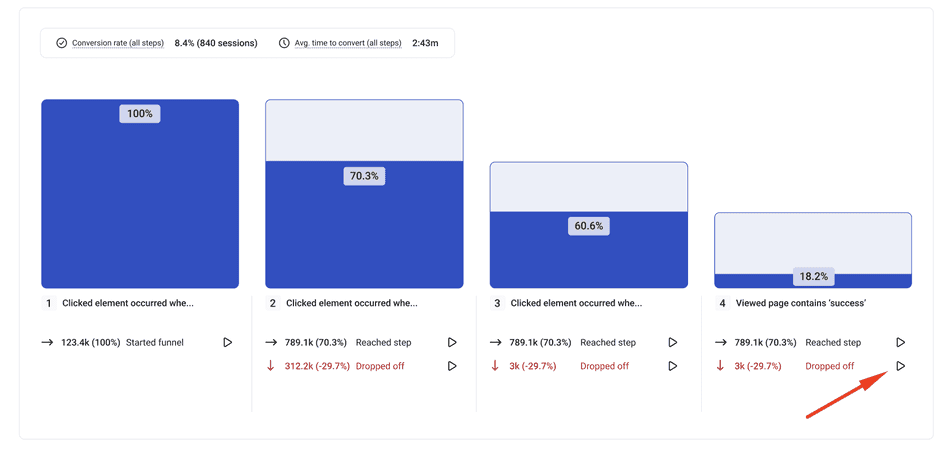
3. Determine how far users get down the sales funnel
Let’s say a product manager wants to understand how far most website visitors make it in the ecommerce checkout flow, so they compare total users for various conversion events, like viewing an item, beginning checkout, and adding payment information.
GA4 will show them a steep decline in users between beginning checkout and finalizing a purchase.
❗️ But Google Analytics won't show them the reason for the decline.
🚨 Keep in mind: total users in GA4 indicate user volume but not behavior. And if you want to make informed decisions about what to keep, change, or get rid of to create a better customer experience, you need to combine qualitative and quantitative data.
For example, if you saw that more people added item A to their cart than item B, you might assume item B lacks product-market fit. But that quantitative data alone won’t tell you that the buttons on item B’s web page are broken or that you’re promoting item B to the wrong user persona.
Combining website analytics with digital experience insights reveals how users behave and why.
How to pair unique visitors with digital experience insights
Digital experience insights let you observe and learn from users with tools like recordings, heatmaps, surveys, and interviews to build on your Google Analytics discoveries.
Simply adding an exit-intent survey to the item A vs. item B scenario above would reveal that customers want item B in a different color or that crucial details are missing from the product description.
Let’s revisit the scenarios from the previous section to understand how digital experience insights help teams dig deeper into user behavior patterns.
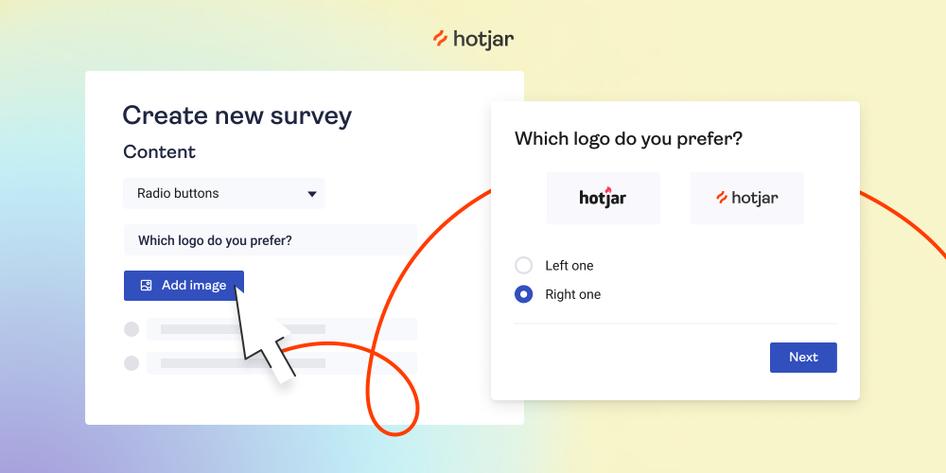
Hear about customer preferences directly from them
Think back to the marketing team measuring the reach of their blog and how often unique users came back for more. To make their future content customer-centric, they use a tool like Hotjar to:
Interview customers about what stood out to them, their likes and dislikes, goals, and what they want to learn
Concept test blog image styles to learn which designs drive engagement, so they can carry out optimizations
See how customers move through your website
The product designer from earlier uses unique visitors in GA4 to measure how well a redesign drives traffic to a particular step in the customer journey.
The next step in their investigation is to watch recordings to see exactly how users scroll, move, u-turn, and rage click on the page.
When the designer realizes the culprit is a banner that users thought they could click, they rework the page and see engagement increase.
Understand why customers convert (or leave)
Finally, recall the product manager who views total users at each milestone to analyze the sales funnel.
GA4 revealed a steep decline in users between beginning checkout and finalizing a purchase, so they analyze scroll heatmaps to see how far down each page customers usually scroll.
To narrow their focus even more, the product manager uses Hotjar Funnels to view sessions of low-engagement pages and uncover a bug that caused the drop-offs, improving the user experience (UX).
Have a plan before you dive into Google Analytics reports
Google Analytics is a powerful web analytics tool, but the different terms and charts become overwhelming if you wander too deep without a plan.
First, choose a question to answer, like, “How many people interacted with our blog this year?” or “Are there points in the sales funnel where customers drop off?” Then, use the unique visitors (total users) metric in GA4 to gauge user volume for the event.
Since GA’s quantitative data only gets you so far, you need to use a digital experience insights platform like Hotjar to make sense of your data and learn how your audience interacts with your website or app.
The more you know about the what, why, when, and how of customer experience, the quicker you’ll delight customers, increase engagement, and boost conversion rates.
Understand what unique visitors do on your website
Unique visitors in GA4 tell you how many people visited your site or app, but you need Hotjar’s tools to understand what they did and why.
