Learn / Guides / UX design
How to conduct a successful UX audit in 6 steps
For your product to succeed, it must be helpful, practical, and easy to navigate. A user experience (UX) audit—an in-depth, data-driven assessment of the experience your app or website provides to users—helps you evaluate your product methodically, so you can find new ways to improve it.

UX audits involve looking at quantitative data—e.g. bounce rates, conversions, and clicks—to see where the user experience is lacking or deteriorating, and learning more about these trends with qualitative data from watching users explore your site or product or talking to them directly.
In other words, running effective UX audits requires you to understand both what is happening with your users and why. And that means going beyond surface-level trends to understand your users’ journeys, motivations, and pain points.
This guide gives you step-by-step instructions to perform a UX audit—plus a handy checklist to track your progress.
We cover:
Look deeper into any audience segment 🔎
Hotjar’s advanced filters let you view heatmaps, recordings, survey data, and feedback data for any audience segment.

6 steps to conducting a successful UX audit
A thorough UX audit involves a range of activities, including:
Identifying trends in user behavior
Observing and speaking with users to understand their experiences
Discovering where user needs aren’t being met
Finding bugs and design or technical issues
By effectively conducting a UX audit that takes all these activities into account, you develop deeper empathy for users and discover important opportunities for improvement. Here’s how to do it.
1. Get set up for success
Decide on your goals. With a clear objective in mind, you’ll know where to start and what data to focus on.
For example, if your goal is to improve retention, you might start by identifying which user segments are prone to churn. Then, take a closer look at the journeys individuals from those segments typically make before unsubscribing.
Start gathering user data. Unless you’re auditing a completely new product, you’ll need to look at what users are doing in your app. At a bare minimum, you should have a traditional analytics tool like Google Analytics set up.
Digital experience insights platforms (like Hotjar 👋) give you a deeper look at customer journeys with tools like session recordings and heatmaps, while surveys enable you to measure attitudinal metrics like customer satisfaction scores (CSAT) at key points in user journeys. (We’ll talk more about UX audit tools later.)
Get the right people involved. For larger audits, you might need collaboration from design, development, product, and marketing departments. Bring everyone together to discuss past user research learnings and project goals.
💡Pro tip: if you bring in an external team to do the UX audit, give them the opportunity to conduct stakeholder interviews for more context on past design decisions.
Set an end point. There’s no real ‘end’ to a UX audit—it could, theoretically, go on forever!—so set a timeline for completing your analysis. Most UX audits take two to four weeks, but it’s usually helpful to plan out timelines that include key milestones.
Create user personas. To explore how well your product serves users, you need to understand your target audience’s goals, motivations, and pain points.
Start by creating user personas for each key audience. We recommend using the jobs-to-be-done framework to establish each persona’s desired outcomes.
Map out customer journeys. Creating customer journey maps gives you a clear overview of how your user personas move through an app and their goals at each stage.
🔥 If you’re using Hotjar
Set up the Hotjar Feedback widget to measure user sentiment on different parts of your website. Next, map average sentiment to key parts of the customer journey to pinpoint areas for improvement.
2. Perform a screen-by-screen evaluation
Explore your product or website. Go through each of the key user flows you outlined in the last phase and experience them from a user’s perspective.
For example, walk through the steps a new user might take when signing up for a free trial and exploring your app. Do the same for a paid user who regularly engages with core features.
It’s important to be realistic here—try to explore like a ‘typical’ user rather than an ideal one.
Complete a heuristic analysis. This means assessing your app screen-by-screen based on your knowledge of UX best practices. A heuristic analysis should help you identify any glaring issues your team previously missed.
💡Pro tip: not sure where to start? Many digital product teams consider Nielsen Norman Group’s usability heuristics to be the golden standard of UX, and use this framework to assess factors like:
User control and freedom
Quality of error messaging
Consistency in design and wording
Aesthetic and minimalist design
3. Look for hidden trends in user behavior
Analyze your conversion data. Where relevant to your goals, see how these metrics vary for different user personas, traffic sources, or products.
Micro-conversions (i.e. smaller actions leading to macro conversions)
Macro-conversions (like a user completing sign-up for a free trial)
Sales
Be on the lookout for key trends: do any audience segments or products perform worse than you expect? Did any dips coincide with past feature launches or app updates?
Examine your web and app data. Your analytics tools will give you access to a wide range of user behavior metrics, such as:
Exit rate
Add-to-cart rate
Cart abandons
Average session duration
Time spent on task
U-turns
Common paths through your site
Traffic
See how the data varies for different pages and audience segments, then look for discrepancies that could reveal important trends. For example:
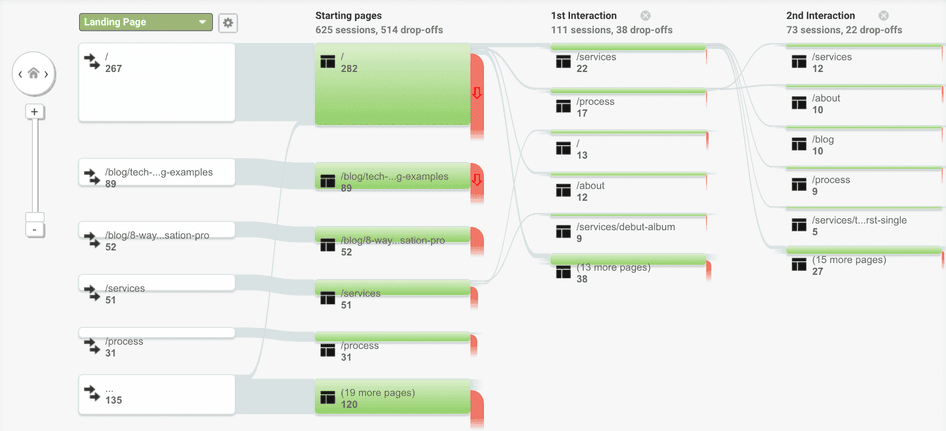
Analyze exit rates to find out where users commonly drop off. This may reveal pages where users typically get frustrated or confused.
Check average session times and see if they vary across audience segments. After identifying which segments are the least engaged, you can start investigating why.
Look at where high-value customers enter your site from. You might find that certain landing pages and site journeys correspond with users who spend more.
🔥 If you’re using Hotjar
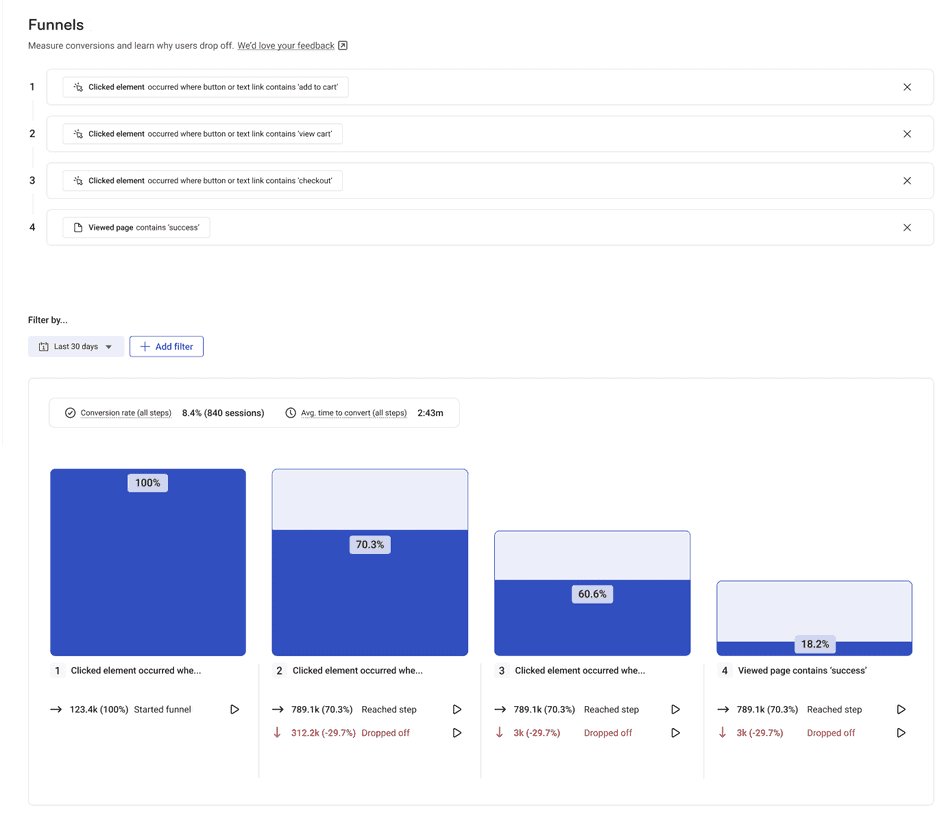
Hotjar’s Funnels tool lets you see exactly where users drop off. Next, click on the drop-off point to see session recordings of the behavior behind the figures, so you don’t need to guess.
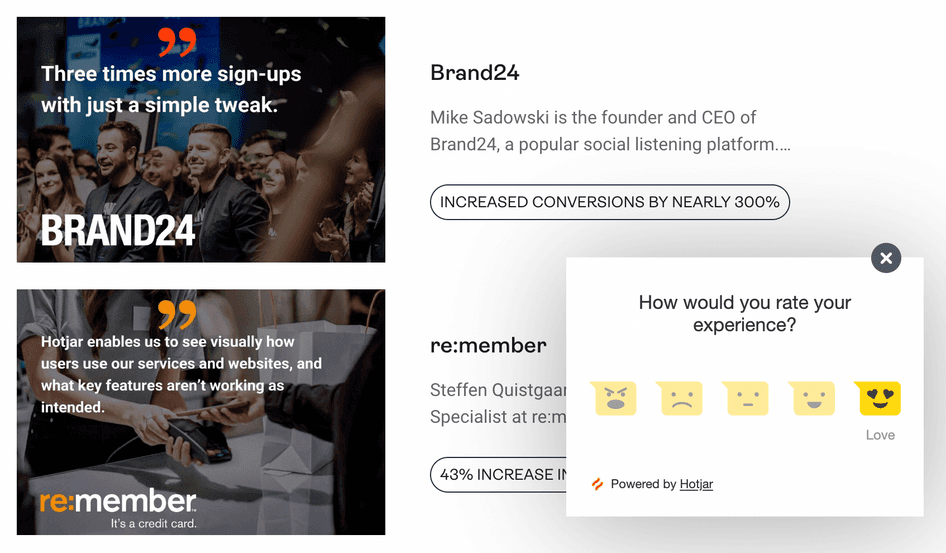
Check your attitudinal metrics. If you set up user surveys in phase one, now’s a great time to analyze them. Check how customer satisfaction scores or Net Promoter Scores® (NPS®) vary along the customer journey to identify places where users are struggling.
4. Find the why behind the trends
Perform usability tests. Usability testing is a way to assess the functionality of your product by watching users interact with it. It typically involves giving users a task in your app or website—for example, adding a product to a cart and completing a purchase.
Watching users complete the task can uncover usability issues and reveal how intuitive the UX design really is.
Interview users. Speak to real users about their likes and dislikes to expose any unmet needs or unresolved pain points users struggle with when interacting with your site or app. Consider running interviews immediately after usability tests to learn more about your participants’ experiences.
💡Pro tip: to get more out of your interviews, run them with our user research tool, Hotjar Engage. Engage hosts, records, and transcribes your interviews, and lets you easily make notes to share with colleagues.

Automate your interview process with Hotjar Engage—and our 175,000-strong participant pool
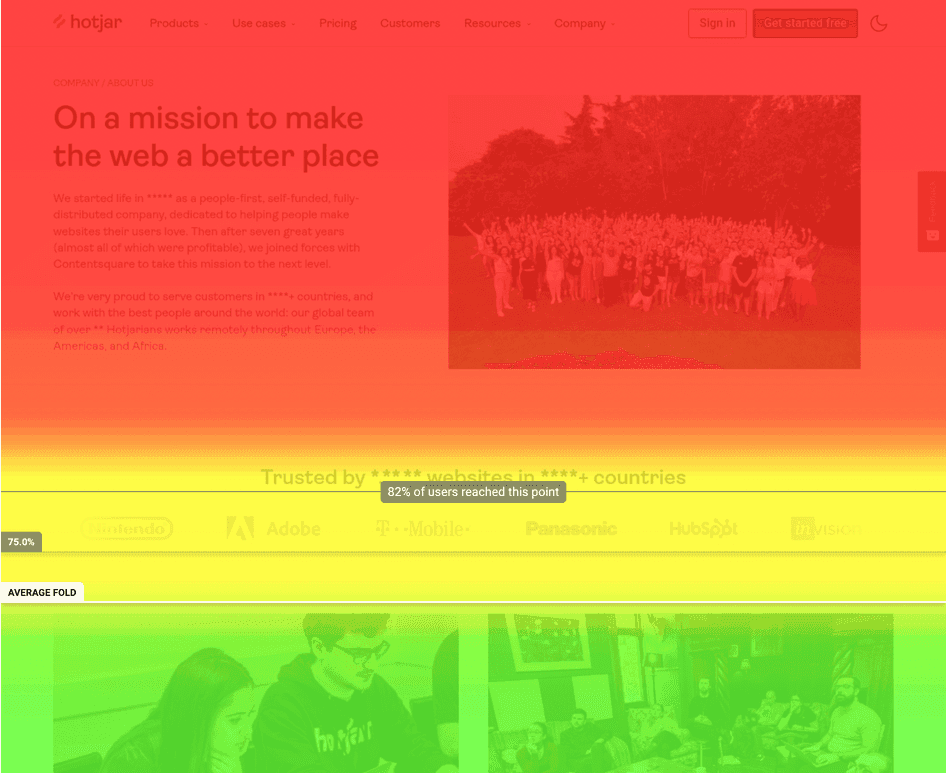
Watch recordings of key user journeys. Like traditional usability testing, watching recordings reveals where users get lost, confused, or distracted.
With an advanced session recordings tool like Hotjar Recordings, you can also view recordings of users who performed specific actions—like unsubscribing or abandoning their shopping cart—and compare journeys of users who converted or purchased against those who did not.
🔥 If you’re using Hotjar
Set up Hotjar Events to filter your recordings by specific actions, like rage-clicking or unsubscribing. Take it a step further with User Attributes in Hotjar to filter your recordings by user location, industry, role, spend amount—and pretty much anything else you can think of.
5. Analyze your data
Identify issues. Go through your data and note any problems—from glaring, urgent issues to minor ones.
Did you notice any significant (or repeated) criticisms from the people you interviewed?
Did your usability tests or recordings reveal parts of your app that confuse or frustrate users?
Do users intuitively understand how to navigate your site or product?
Did you observe any bugs or errors in your user interface (UI)?
Did your heuristic analysis reveal significant areas where you’re not meeting UX best practices?
Do users’ experience of your product match their expectations?
Rank issues by urgency. Put each issue you found into categories ranging from ‘critical’ to ‘low priority,’ according to how much they affect the user experience (and your end goal).
Create hypotheses for UX improvements. Improving UX isn’t just about solving issues—it’s also about finding new ways to meet user needs. Based on your interviews, what else do your users need?
💡Pro tip: you don’t have to wait for a UX audit to start asking users what they need. Set up Hotjar Surveys and use our ready-made templates to start gathering actionable feedback now.
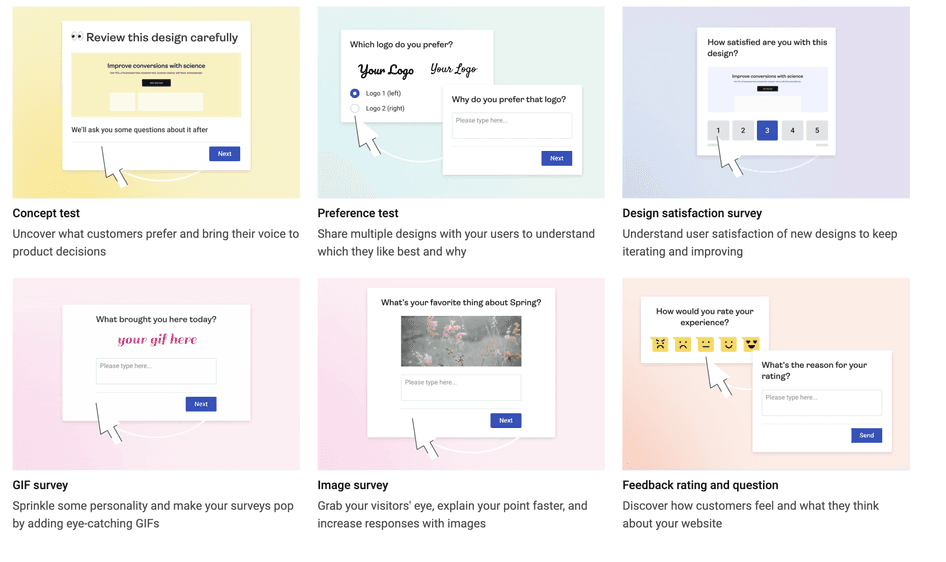
Hit the ground running with Hotjar’s survey templates
6. Share your findings
Create a UX audit report. It won’t be necessary to include every small detail of the audit—but make sure colleagues can clearly see why you make the recommendations you do.
Set the context for the report by clarifying the goals of the UX audit
Summarize the data you gathered, and any valuable findings
Share the list of ranked issues you previously created
Make actionable recommendations for improvements, fixes, and future additions
Include links to important data. Give your colleagues a chance to explore critical data themselves, where relevant (and practical). It’s much easier to get buy-in from colleagues when they see for themselves what customers are doing and saying.
What UX audit tools do I need?
There are tons of UX audit tools available today, but these are our top picks (and to make things even sweeter, they all sync together).
Traditional analytics: Google Analytics
Google Analytics is essential for gathering much of the quantitative data you need to identify trends. Use it to create reports on conversions, browsing metrics, and typical user journeys through your website.
Behavior analytics: Hotjar
Hotjar complements your analytics data by showing you the why behind user trends. With Recordings and Heatmaps, you learn more about what users do on their journeys. What’s more, Surveys and Feedback let you gather qualitative data to understand user perspectives better.
Finally, Hotjar Engage helps you recruit participants for interviews, then host, record, and transcribe your calls.
(Did you know? You can also integrate Google Analytics with Hotjar to unlock new capabilities, like filtering your Recordings data by traffic source.)
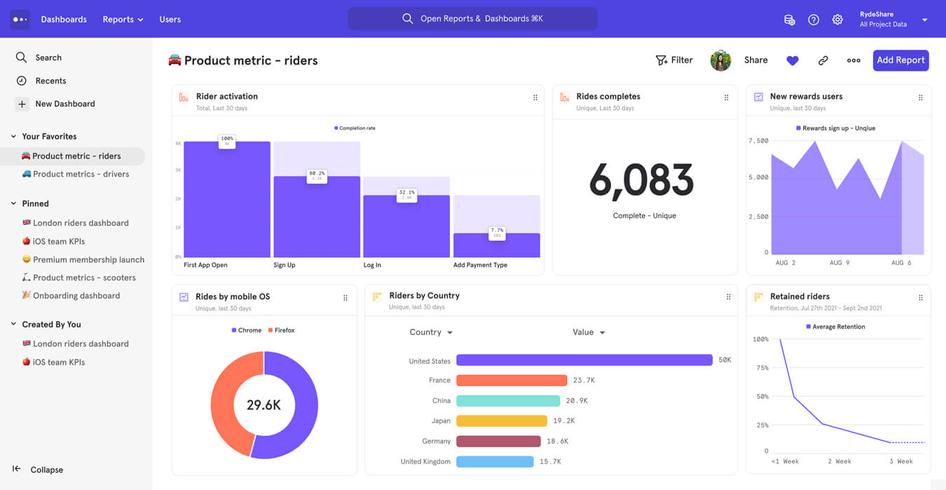
Product analytics: Mixpanel
Mixpanel is a product analytics tool for software and apps providing much of the quantitative data you need to spot trends in user behavior.
For example, Mixpanel lets you track metrics like daily active users and churn rate, with advanced segmenting options. You can also use Mixpanel to track how often users interact with specific elements, like your search bar or call-to-action (CTA) buttons.
With Hotjar’s Mixpanel integration, you can filter Hotjar Recordings, Heatmaps, Trends, Funnels, and Dashboard data by specific Mixpanel events.
UX audits in action: a case study
UK-based agency Gravytrain conducted a UX audit for its ecommerce client, Bulldog Skincare, to help them improve their checkout page and increase conversions.
🕵️♀️ Key UX audit findings:
Funnel analysis in Google Analytics showed users dropping off at key points in the client’s funnel
Session recordings revealed users scrolling and searching for further information
Customer interviews with users who had and hadn’t completed purchases revealed users needed more guidance around choosing the right product and building a grooming routine
💡 Recommendations:
Add a progress bar showing where shoppers are in the checkout process and how close they are to getting free delivery
Make website messaging more personal, using the pronouns ‘you’ and ‘your’
Implement a ‘recommended products’ carousel
💰 Results:
208% increase in total sales
8% increase in average order value
24% increase in visits to activation
78% increase in conversion rate
“Any optimization work should start with a clear understanding of your target customers’ objectives and attitudes. This is where a UX audit can be particularly helpful. By combining interviews and journey analysis, you can create a hypothesis around why paths or processes don’t align with the shopper’s ambitions. You can then use data to confirm or disprove this analysis and home in on the most appropriate solutions.”
– Raadhika Patel, On-site Experience Manager, Gravytrain
When to perform a UX audit
For most businesses, these are the key moments where UX audits are useful:
When you’re experiencing a lull in sales, conversions, or user engagement: UX audits help you pinpoint the ‘leaks’ in your most important key performance indicators (KPIs)
When you’re preparing to launch a minimum viable product (MVP): UX audits help you identify any issues ahead of time, so your launch goes off without a hitch
Anytime you need a general health check on an existing product: even when your app is performing well, UX audits can uncover user pain points and needs
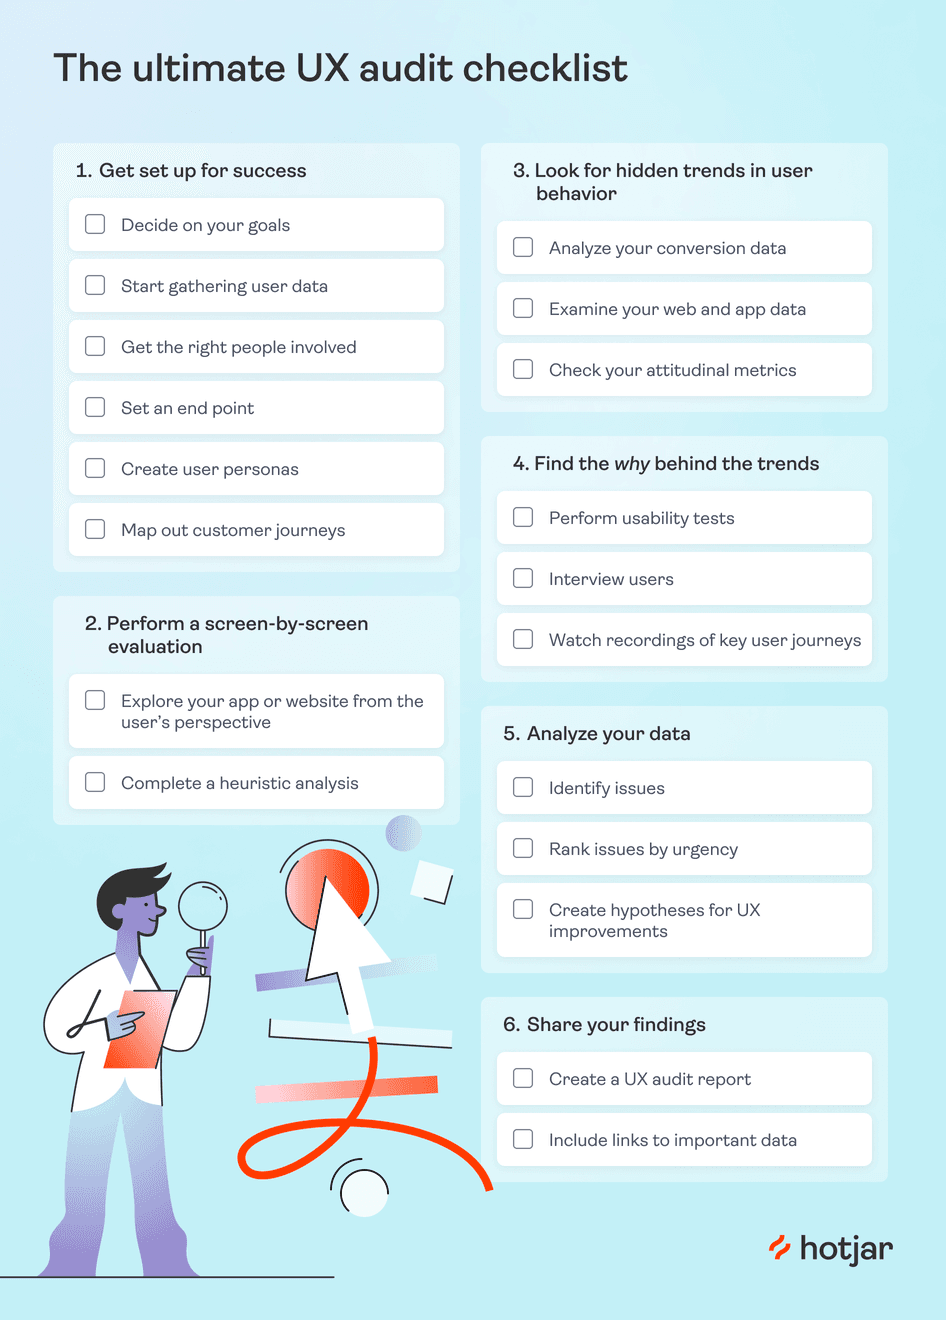
Ultimate UX audit checklist
Download our comprehensive UX audit checklist (pictured below) to start checking off your steps.
Gather the right data to get useful insights from UX audits
UX design audits are all about developing deeper empathy for your users. By seeing your app or website through their eyes, you’re able to fix issues and get a deeper understanding of what different user personas need.
But when your ultimate goal is to understand your users, you need to gather, analyze, and share the right data. Be sure to equip your team with UX audit advanced tools, like Hotjar, so you can effectively investigate user journeys. With the right data at your fingertips, you’ll answer your most pressing UX questions—and make improvements that move the needle.
Look deeper into any audience segment 🔎
Hotjar’s advanced filters let you view heatmaps, recordings, survey data, and feedback data for any audience segment.