Learn / Guides / Behavior analytics guide
5 practical ways to use behavior analytics to drive growth
The different ways people behave on your website or product—what they click, how they browse, and the feedback they leave—gives you valuable insight into what to optimize, helping you empathize with your users and improve the metrics that matter to your business.

This guide takes you through five practical ways behavior analytics enables you to make data-driven decisions that consistently increase conversions. Use these tips to unlock user-led business growth by prioritizing your most important business asset: your customers.
We cover how to use behavior analytics to:
Start collecting user behavior analytics insights today
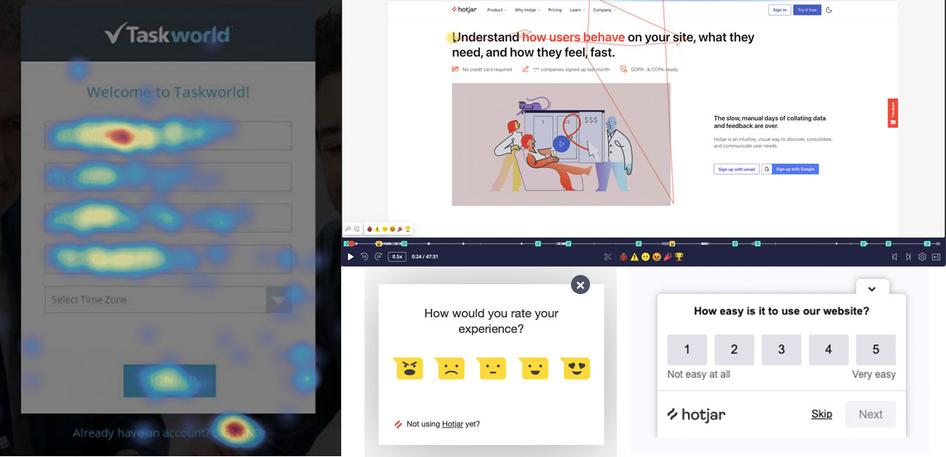
Hotjar Heatmaps, Recordings, Feedback, Surveys, and Interviews show you how (and why) customers use your product, helping you grow by putting users first.

What is behavior analytics?
Behavior analytics is the process of tracking how and why visitors interact with a product or website and using this insight to make optimizations that improve the user experience (UX).
Note: behavior analytics is sometimes confused with behavioral analytics, which focuses more on predicting customer behavior than analyzing existing customer behavior trends and patterns.
Who is behavior analytics for?
Behavior analytics can (and should!) be used by anyone who needs a deeper understanding of user activity to identify areas for improvement. Typically, these people are:
Data analysts
Conversion rate optimization (CRO) managers
5 ways to use behavior analytics for growth (+ real examples)
You need to use a combination of quantitative behavior data and qualitative behavior data to get a full picture of user activity and the motivations behind their actions.
For example:
On a specific page, track elements with the most clicks and individual feedback comments to see how customers interact with the page and hear their unfiltered opinions
Use a Net Promoter Score® (NPS®) survey to track the number of customers who'd recommend your services and view a recording of a customer’s browsing session to understand what they liked (or disliked) about their experience
There’s no wrong way to use behavior analytics, but the goal should always be understanding and empathizing with users to improve UX and reach growth goals. If you’re not sure how to get started, here are five impactful ways to put behavior analytics tools to work for your business.
1. Use behavior analytics to improve conversion rates
Whatever conversion goal you’re trying to improve—think newsletter sign-ups, ecommerce purchases, or product clicks—behavior analytics tools troubleshoot why a conversion hasn’t occurred. This way, you can fix what’s broken, optimize your design, and attract more clicks where you want them.
Use a heatmap tool like Hotjar Heatmaps on your conversion pages for a visual overview of user actions: where visitors click, move, and scroll. Analyze the heatmap data by asking:
Are visitors clicking on the primary call to action (CTA)?
Are irrelevant elements stealing attention?
Are visitors scrolling down far enough to view important information?
Here’s an example of how it looks in practice:
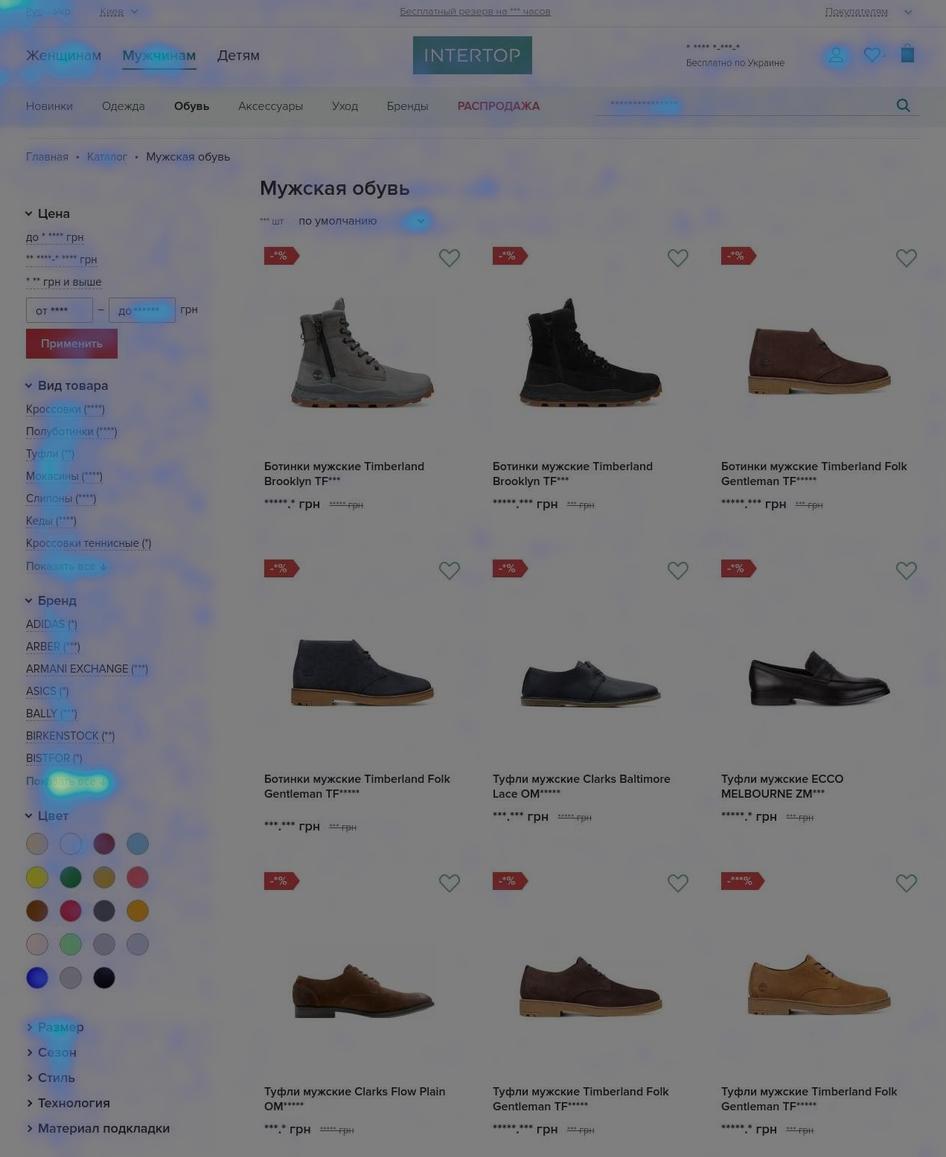
UX/UI agency Turum-burum used Hotjar Heatmaps to analyze category pages for its client, the Ukrainian fashion ecommerce store Intertop.
The team noticed move and click maps that revealed most customers were clicking ‘show all’ instead of browsing the listed products. Turum-burum then A/B tested new listing filters to help visitors find the right products faster.
The winning design led to an impressive 55% increase in their conversion rate.
💡Pro tip: if you’re unsure which pages to focus on, analyze your conversion funnel to find out where the biggest drop-offs occur. Do this using a tool like Hotjar Funnels or Google Analytics.
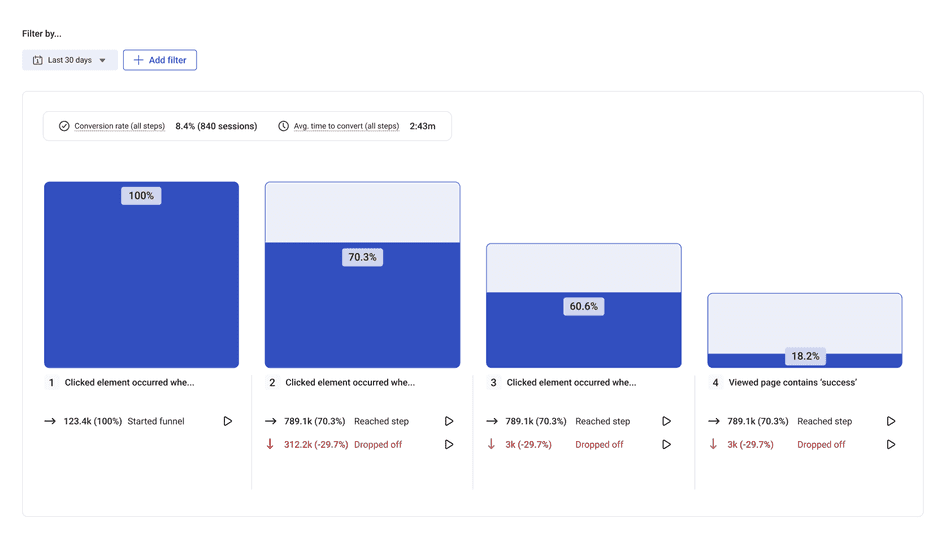
A conversion funnel in Hotjar Funnels showing percentage drop off
2. Use behavior analytics to reduce churn
High (or growing) rates of customer churn—when people stop buying your product—is any subscription business’s bane. Instead of guessing, rely on qualitative user behavior analytics tools to ask real customers exactly why they’re leaving, so you know what to do to reduce churn and increase customer retention.
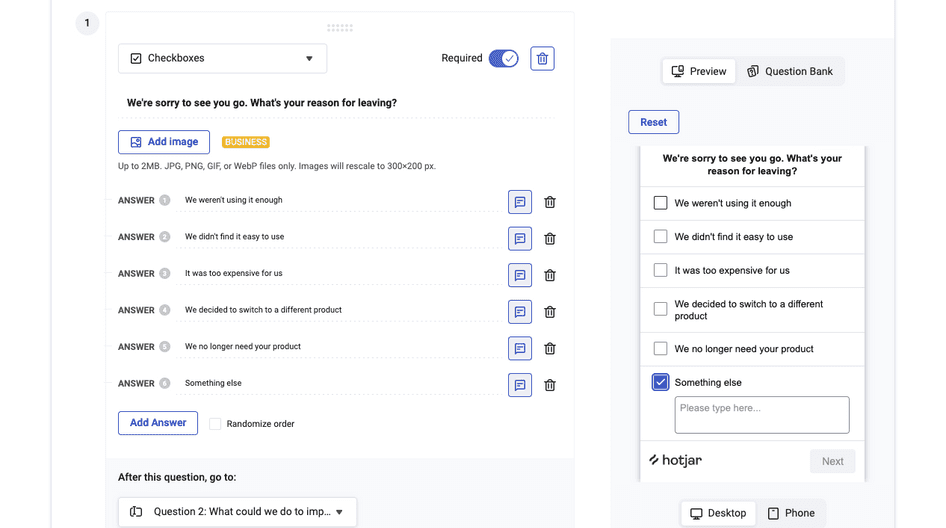
Use a survey tool like Hotjar Surveys to trigger a churn survey when users unsubscribe, and ask questions like:
We’re sorry to see you go. What’s your reason for leaving?
What could we do to improve our product for you?
How likely are you to choose us again if you have a similar need in the future?
Here’s a real company that did just that:
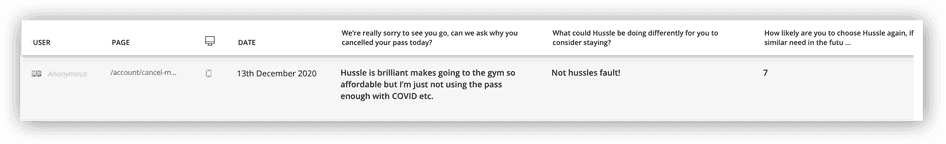
Gym-pass platform Hussle used Hotjar Surveys to ask users who canceled their subscriptions why they were leaving.
When results showed 26% of churning users were leaving to buy a membership from a local gym instead of just a MultiGym pass, the Hussle team prioritized a new product feature: letting users buy gym memberships directly through the platform.
With this new feature, the Hussle team saw reduced churn and an increase in customer retention.
💡Pro tip: if you ask churning customers open-ended questions, you can still quantify results to report to your team. Use our free open-ended question analysis template to identify common themes, categorize each response, and generate a chart of your survey results—perfect for sharing with stakeholders.
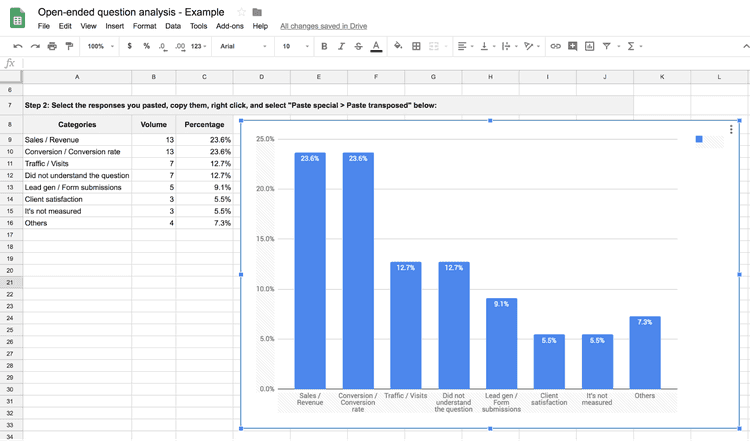
Qualitative survey results shown in a chart using Hotjar’s free Google Sheets template
3. Use behavior analytics to spot bugs
Missing links, confusing descriptions, or page features that Just. Won’t. Work: these are some of the factors causing your site visitors to get frustrated and bounce. Behavior analytics tools let you see where users get stuck so you can fix bugs and broken design elements before they result in revenue loss.
Use a session recordings tool like Hotjar Recordings to track user actions across your website or product pages. Analyze recordings by checking:
Where users rage click (repeatedly click on the same element)
Where visitors bounce and u-turn (quickly return to the previous page)
How pages load on different browsers and devices
If there are any broken elements or layouts
What leads visitors to 404 pages

A rage click captured using Hotjar Recordings on jewelry store Manly Bands by website optimizer Rich Page
Here’s an example of what bug spotting looks like in the wild:
Software company Intelliquip used Hotjar Recordings to check for bugs while switching existing users to a new portal system. When watching session replays during the launch period, the team saw many customers getting stuck in a loop. Why? They overlooked an email confirmation requirement.
Other sessions revealed users in Spanish-speaking countries were incorrectly being served English-language interfaces.
Fixing these bugs early in the migration process helped Intelliquip deliver a better user experience to over 10,000 users.

💡Pro tip: the Hotjar Dashboard’s rage clicks & u-turns widget helps you monitor bugs and issues. If you need to investigate an increase in frustrated behavior, click on the chart to view relevant recordings for a specific period.
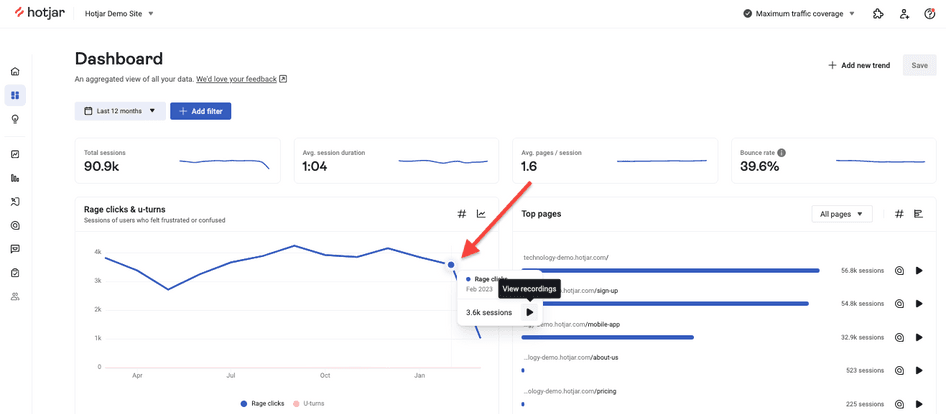
Rage click monitoring in the Hotjar Dashboard: click to skip straight to relevant recordings
You can also sort your recordings by ‘Frustration score’ (from 1 to 3), an automatic tag based on the level of u-turns, rage-clicks, and negative feedback measured during a session. Start with the most frustrated sessions if you’re hunting for bugs.
4. Use behavior analytics to increase product adoption
Product adoption—getting new users to add your product to their workflow—requires a clear understanding of your customers’ needs and essential jobs to be done (JTBD). Behavior analytics tools help you collect product feedback so you can learn what users need from your product and measure what’s currently working well (and not so well).
Using a tool like Hotjar Feedback, add a feedback button to:
Collect feedback from any user
Embed feedback requests on help documentation or key pages
Always keep the door open to feedback without interrupting the user journey
Here’s how we do it ourselves at Hotjar (yes, the platform is a big part of our daily workflows!):
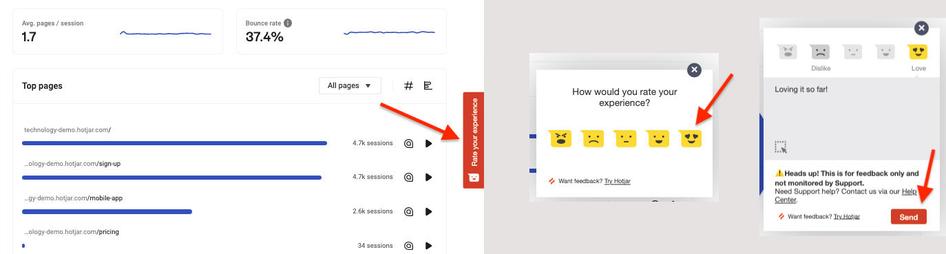
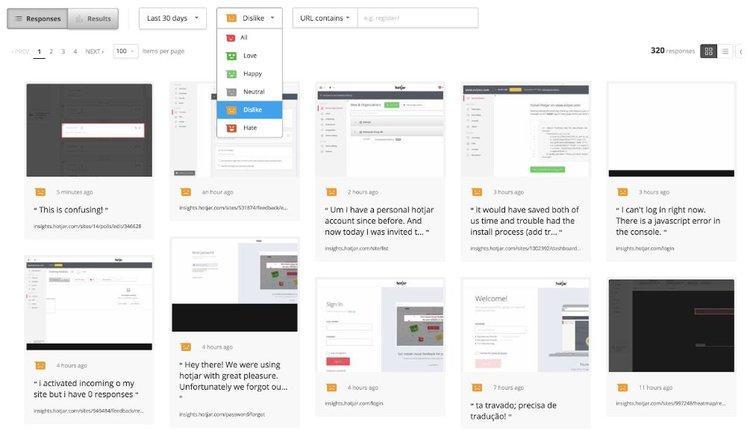
We use our Feedback widget across the product—it’s the red tab on the right—so users can rate the product, report issues, and tag page elements for context anytime they like.
The responses help us uncover bugs and monitor how new users experience the onboarding process. We use these insights to prioritize the most needle-moving optimizations—something critical for improving product adoption rates.
💡Pro tip: monitor user feedback scores on the Hotjar Dashboard so you can take action when noticing a sudden drop. If a recording has also been captured, click the play button icon on the feedback response to see how the user navigated your product before and after leaving a comment.
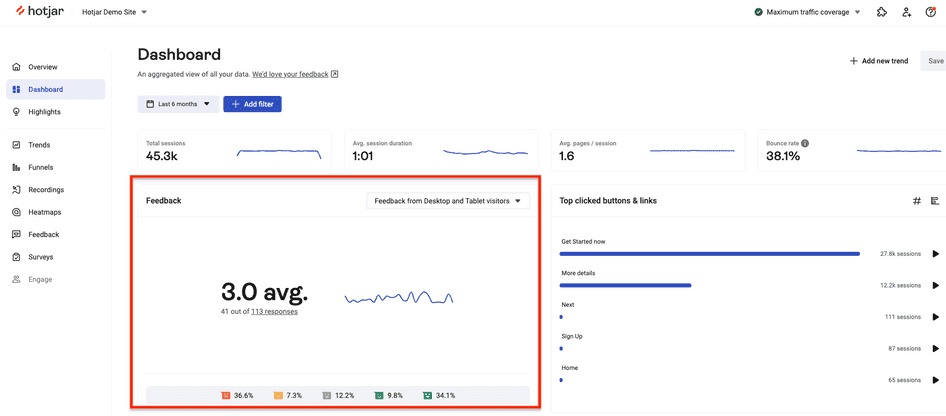
Monitor product feedback in the Hotjar Dashboard
You can also get feedback sent straight to a Slack (or Microsoft Teams) channel with Hotjar’s integration: use it to resolve critical issues quickly and keep teams in the loop.
5. Use behavior analytics to grow customer satisfaction
Customer satisfaction, a measurement of how happy users are with your product or service, has a huge impact on how much repeat business and customer loyalty you’ll win. Behavior analytics tools not only help you measure and track your customer satisfaction score (CSAT) over time but also show you ways to improve user delight by reducing friction across the experience.
Combine user behavior analytics tools, like Hotjar Surveys, Hotjar Recordings, and Hotjar Interviews, to:
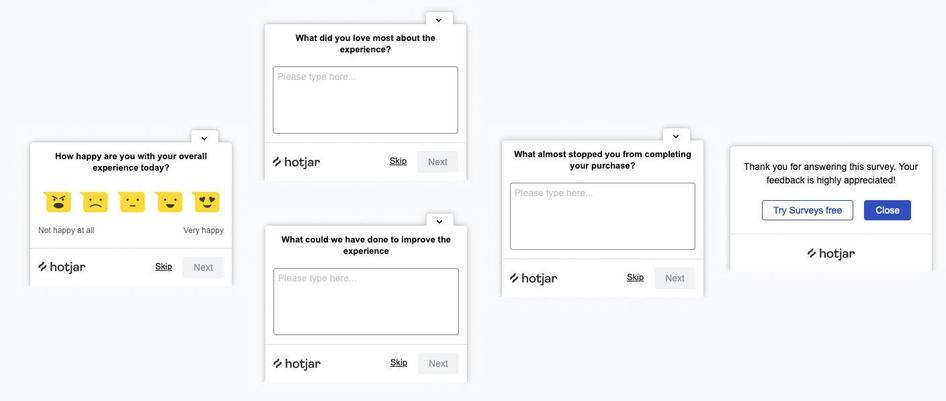
Trigger a post-purchase CSAT survey on-site or via email to find out how customers rate you, what convinced them to take action, and what you could do to improve their experience
View session recordings and look for areas of frustration (rage clicks, u-turns, broken elements) to fix and reduce friction for future customers
Conduct in-depth user interviews with real customers to get a deeper understanding of what they think of their experience (if you recruit your own network, Hotjar Engage lets you do it for free)
Here’s an example of how it looks in practice:
Marketing dashboard company DashThis watched Hotjar Recordings to find roadblocks during the product onboarding process.
After analyzing where customers got stuck, the UX team rolled out design improvements—like adding a search bar, pop-ups, and videos—to better guide people through the process.
This led to a 140% increase in customer satisfaction, as measured by an NPS survey.
Pro tip: if you’re using Hotjar Surveys, use our free CSAT and NPS survey templates to send post-purchase surveys to your customers. View results for ratings-based questions (e.g. ‘rate us on a scale from 0 to 5’) as a chart, and open-ended questions as a word cloud or list, downloadable as CSV or XLSX files.
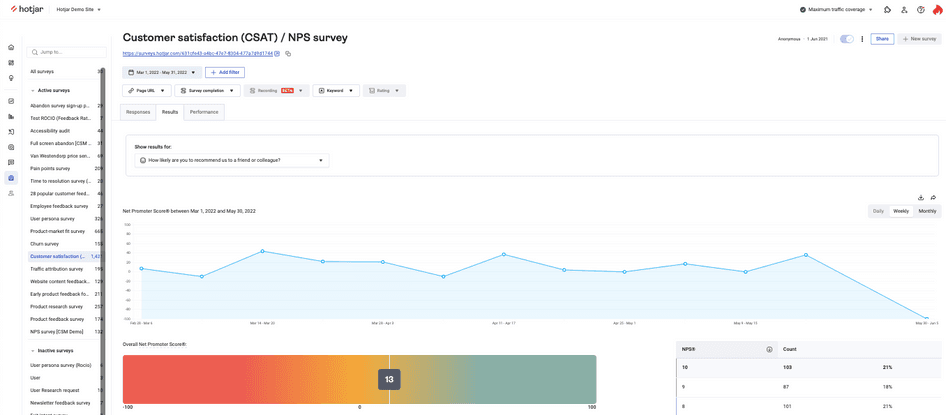
Quantitative CSAT/NPS results displayed in Hotjar Surveys
Add behavior analytics to your workflow
Whatever your growth goals are, behavior analytics helps you make an impact by focusing on visitors, users, and customers. By learning how people behave and understanding what they think, feel, and need, you grow your business on their terms—and keep them coming back.
Instead of doing the odd optimization here and there, make user behavior analytics part of your daily workflow and monitor both quantitative (what users do) and qualitative (why users do it) behavior. This way, you’ll have the insights you need to improve the user experience and grow the metrics that matter to your business.
Start collecting user behavior analytics insights today
Hotjar Heatmaps, Recordings, Feedback, Surveys, and Interviews show you how (and why) customers use your product, helping you grow by putting users first.