Learn / Guides / GA glossary (A-Z)
Google Analytics dimensions and metrics
Google Analytics metrics and dimensions help you understand your users, optimize your website for conversions, and measure the ROI of your marketing campaigns.
However, with the vast amount of data in Google Analytics 4 (GA4), deciding which metrics and dimensions to track can be overwhelming.
Summary
This guide highlights the key GA4 dimensions and metrics you need to focus on. You'll also learn how product experience insights suites—like Hotjar—complement Google Analytics, so you can improve the user experience (UX) and increase conversions.
Here’s what we’ll cover:
What are metrics in GA4: Google Analytics' quantitative metrics quantify website performance, giving you insights into your users’ behavior
GA4 metrics to track: the metrics you track will differ based on your goals. Average session duration, bounce rate, and conversions are among the most important metrics different businesses track.
What are dimensions in GA4: Google Analytics uses dimensions to segment data. Primary dimensions provide high-level insights, while secondary dimensions help you further drill down into your data.
GA4 dimensions to track: GA4 has various dimensions to analyze user behavior, traffic sources, content interaction, and demographics, so you have a complete picture of how different user segments behave on your website
Make the most of GA4 dimensions and metrics: dimensions and metrics help you understand site performance. However, quantitative data can't explain why visitors behave the way they do. Combine GA4’s data with qualitative data for in-depth behavior analysis and customer feedback.
What is a metric in Google Analytics 4?
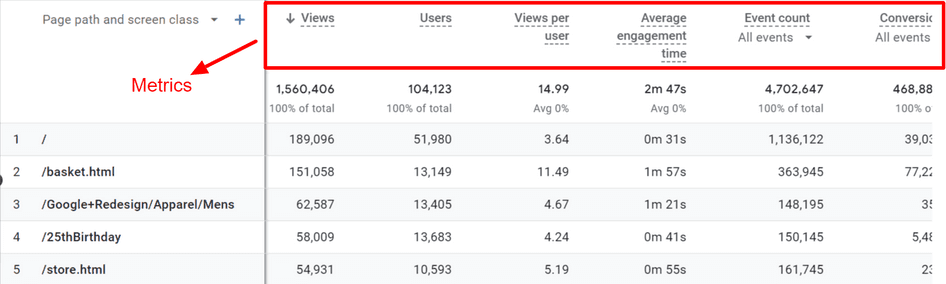
A metric is a quantitative data measurement that shows how a website or digital product performs. Metrics are expressed through numbers (number values, %, $, time) in a Google Analytics report.
Here are some popular metrics in Google Analytics:
Average session duration
Bounce rate
Conversion rate
Revenue
Access your metrics by clicking on the ‘Reports’ tab of your Google Analytics interface, where you’ll find different reports like ‘Acquisition’, ‘Engagement’, and ‘Retention’.
10+ Google Analytics metrics to track
The Google Analytics metrics you should track or customize for your website depend on your target audience, industry, business goals, and the problem you’re trying to solve.
However, there are some common GA4 metrics you can use to understand your users, optimize your digital marketing efforts, and improve conversions.
Session: a session is the period of a user's interaction with your website that can last up to 30 minutes of inactivity. GA4's Session metric reflects the number of sessions that started on your site. There’s no restriction on the maximum duration a session can continue. Tracking total sessions provides insight into your overall traffic and user interest.
Average session duration: the average time (in seconds) users spend on your website. Longer durations indicate engaging content, while shorter ones suggest room for improvement.
Engagement rate: the percentage of engaged sessions, calculated as the ratio of engaged sessions to total sessions. It helps you understand user interaction, with a higher rate indicating more value and potential for conversions. (Engaged sessions are the number of sessions that last 10 seconds or longer, had one or more conversion events, or two or more pageviews.)
Active users: this is the primary User metric in Google Analytics 4 and denotes the number of distinct users who visited your website and had an engaged session. It gives you a broad view of user engagement and overall platform activity. It’s recorded by events like ‘first_visit’ or with parameters like ‘engagement_time_msec’.
Note: the Active users metric is displayed as Users in the Google Analytics 4 dashboard.
However, you need to watch out for two other popular User metrics that may seem similar:
Total users: the number of unique users who logged an event
New users: the number of users who interacted with your site or app for the first time, tracked by the ‘first_open’ or ‘first_visit’ event
Bounce rate: the percentage of sessions where users didn't have an ‘engaged session’ (explained above) on your site. High bounce rates could mean users need help finding what they're looking for or that your site needs optimization.
Views: the number of times users accessed a web page, including repeated views of the same screen or page. Use this metric to identify popular content or features and focus on areas that need improvement or promotion.
Conversions: this represents the number of times users triggered a specific event or completed a desired action—like making a purchase, signing up for a newsletter, or filling out a contact form. Tracking conversions helps you measure the success of your website changes and optimize marketing campaigns.
💡 Pro tip: improving your conversion rate is about more than just making random site changes. It involves understanding customer needs, hesitations, and perceptions about your product and finding website bugs to uncover issues across user journeys.
Use Google Analytics to identify problematic pages, then use product experience (PX) insights tools like heatmaps and recordings to understand user behavior on those pages.
A heatmap is a visual representation of user interactions on a web page. Using a color spectrum, areas with high engagement are shown in warm colors like red and orange, while less engaged areas appear in cooler shades like blue.
A recording is a playback of a real user session that enables you to see exactly what people do on your site, so you can understand the customer journey and identify patterns that cause frustration and low conversions
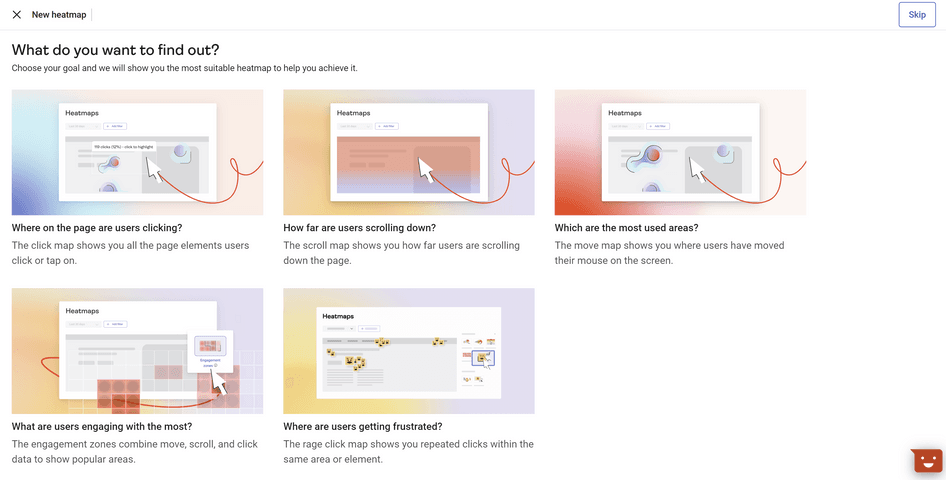
The Hotjar Heatmaps tool has five different types of heatmaps
Total revenue: your overall income from website sales, in-app purchases, subscriptions, and ads (minus refunds). Use this metric to evaluate your financial performance, make informed decisions, optimize campaigns, and ensure sustainable growth.
Entrances: the number of times a user began a session on a specific page. Identifying common starting points provides insights into effective landing pages. Optimizing these entry points helps you create a positive first impression, leading to better user engagement and retention.
Exits: the number of times a session ended on a particular page or screen. High exit rates signal user issues, like poor usability or a lack of relevant content. Fixing these can improve your user experience and lower bounce rates.
💡 Pro tip: one effective way to understand why people leave your website is to launch a well-timed survey, asking users what they were looking for and what improvements they would like to see.
Ask your visitors a combination of open- and closed-ended questions, like
Will you be making a purchase today? [Yes/No]
What's stopping you from buying today?
How can we make this page better?
Ecommerce metrics: metrics like Add to carts, Checkouts, and Gross purchase revenue give you insights into customers’ buying behavior and help you optimize the shopping experience. For example, a high number of add to carts indicates strong product appeal, while tracking gross purchase revenue helps you assess marketing and sales strategies.
Lifetime engaged sessions: shows the number of engaged sessions a user has had since their first visit to your website, so you can identify loyal user segments and tailor strategies to enhance their experience further
Lifetime value (LTV): shows the total amount of revenue you generate from each customer over the course of their relationship with your business, and includes events like purchases, subscriptions, and conversions. It's a key metric that helps you understand user profitability, so you can allocate resources effectively and tailor your marketing strategies to segments with a higher LTV.
Learn what metrics don’t tell you
Grab a free Hotjar trial to see what people do on your site—and understand the why behind your GA4 metrics.

What is a dimension in Google Analytics?
A dimension is an attribute used to describe, segment, organize, and sort data.
Popular examples of Google Analytics dimensions are
Medium
Browser
Country
Language
Campaign
Device category
Each dimension accepts different values. For example, the dimension Medium tells you through which channels you acquire new users. It accepts values like 'affiliate', 'cpc', and ‘email’. Using this dimension to identify traffic sources helps you understand the effectiveness of different marketing channels, so you can allocate resources better.
Primary and secondary dimensions
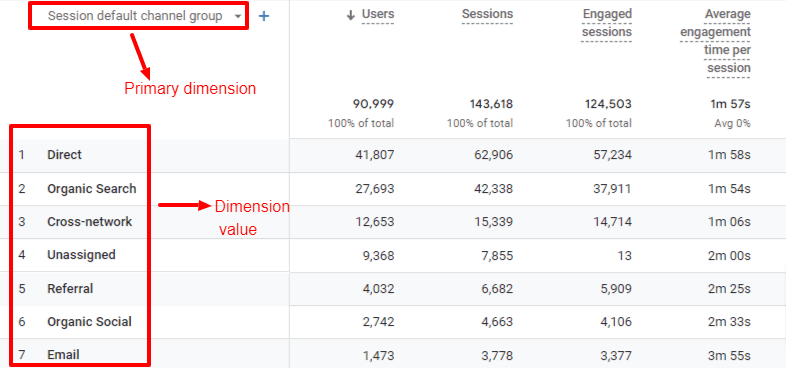
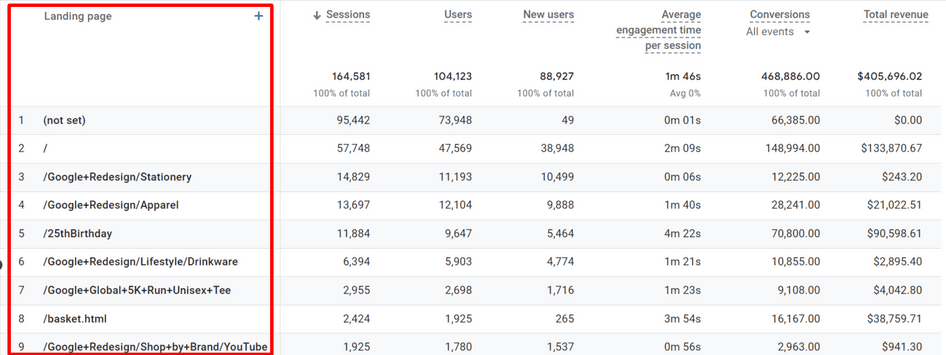
Each GA4 report comes with a pre-selected primary dimension that gives you high-level insights into how the dimension performs in relation to a set of metrics.
First, navigate to your report of choice, go to the table on the top left, and click on the ‘∇’ icon to select your primary dimension from the drop-down menu. Then, narrow down your data and select your secondary dimension by clicking on the ‘+’ sign (seen above) and scrolling through the options.
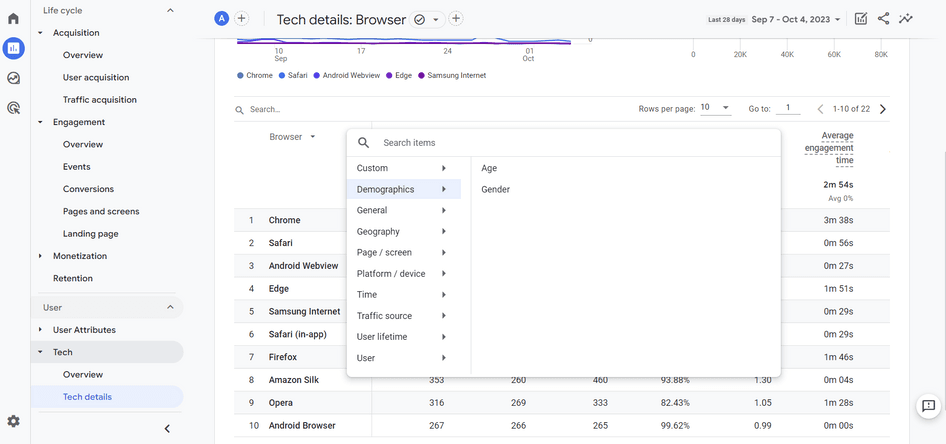
For example, if you want to see data on different browsers, head to the ‘Tech’ report. By clicking on ‘Tech details’ and using Browser as a primary dimension, you can see your data across values like Chrome, Firefox, and Safari. If you select the Demographics category and then Age as a secondary dimension from the + menu, you can now also review the browser data of users across different ages.
10+ Google Analytics dimensions to track
Google Analytics provides various dimensions that allow you to analyze user behavior, traffic sources, content interaction, and demographics, giving you a complete picture of your visitors and their website experience.
The dimensions you track will depend on your context. For ecommerce, dimensions like 'Item brand', 'Item category', and 'Item ID' will help you segment and analyze your performance by product dimensions.
But for a B2B website, important dimensions could be ‘Signed in with user ID’ to delineate current users from non-users in traffic patterns, or something as simple as the content type of the landing page dimension to determine intent.
However, online businesses use some popular GA4 dimensions with metrics to understand user behavior and improve conversions. We've grouped such dimensions below based on their categories in Google Analytics 4.
Geography: localize content and the user experience using dimensions like Country and City
Platform/device: by analyzing dimensions like Browser, Device category, Language, and Platform, you can optimize the user experience for different devices and platforms like Android and iOS
Page/screen: identifying the point where people entered your website is useful to determine which of your pages were successful in converting visitors. Do this by using the Landing page and Page location dimensions to improve key user touchpoints, reduce user frustration, and boost conversions.
Traffic source: knowing your website's traffic sources is key to refining marketing strategies. Use dimensions like First user source/medium and Session source/medium to gain insights into user acquisition and session beginnings.
Event: provides granular insights into specific user interactions using the Event name dimension, helping you understand user preferences and behaviors
Ecommerce: dimensions like Item brand, Item category, and Item ID provide insights into shopping behavior on online stores
Time: the Date + hour dimension gives you information about when an event occurred, so you can tailor content releases, promotions, or support availability by analyzing peak activity times or reducing ad spend during low engagement times
You can gain valuable insights by measuring performance by time of day. For example, analyzing metrics by time can reveal that 'Adds to cart' during the night have a low order completion rate compared to the daytime. You can investigate the report to identify the source of low-performing visitors and cut off that traffic source, if possible.
Demographics: dimensions like Age, Gender, and Interests provide insights into your broader user base, allowing for more personalized marketing efforts
Attribution: the attribution dimension Source/medium identifies where users landed on your site from, while Campaign and Campaign ID pinpoint promotional efforts that led to a conversion. Analyzing them helps you refine your marketing strategy, optimize user touchpoints, and enhance campaigns.
User lifetime: use the Last active date and Last purchase date dimensions to get insights into retention and user loyalty
Custom metrics and dimensions
GA4 users can create custom metrics and dimensions to collect and measure data the tool wouldn’t automatically track—for example, information stored in a customer relationship management (CRM) system that can be synced with GA data.
Things get quite technical at this point, and Google has an exhaustive list of prerequisites and configuration options to introduce custom metrics and dimensions into your account. You can read more about it here.
What metrics and dimensions can’t tell you (and how to find the data you need)
Dimensions and metrics are incredibly useful to understand the performance of your site as a whole and any of its individual pages. They help you
Gain insights into user interests and preferences, so you can evaluate the performance of specific pages and sections
Map out your website ecosystem, showing you where users are coming from and how they move through your site
Compare behaviors across segments to review performance across different groups (like desktop vs. mobile users and conversion rate across landing pages)
Identify priorities and quantify their impact to determine which pages have the potential to contribute to your company's growth goals—and optimize accordingly
However, while the quantitative data from Google Analytics helps you keep the ultimate log of everything that’s happening on your website, it still can’t tell you exactly why your visitors behave the way they do.
💡 Pro tip: combine the quantitative (numerical) data you get from GA with insights from a behavior analytics suite like Hotjar that gives you both quantitative and qualitative data for the full picture of your user experience.
Here are some scenarios to use both:
Website redesign: use GA metrics like Total users and Engaged sessions for pre-design analysis. Then, use tools like concept testing surveys and a feedback widget to gather users’ qualitative opinions on your new design.
Develop a holistic understanding of your customers: use GA metrics such as Entrances and Exits, along with dimensions like Landing page and Page location, with session recordings, to comprehensively understand user paths and your website visitors
Improve the customer experience: use GA to track conversion rates, and Net Promoter Score (NPS) and Customer Effort Score (CES) surveys to gather feedback about your customers’ buying experience. Then, make informed changes on your website.
Hotjar Recordings shows you exactly what users do on your site
Combine quantitative and qualitative data for a full picture of your website
Google Analytics is a great tool to gather quantitative data and keep track of everything that happens on your website. However, you also need qualitative insights to get a complete picture of
The drivers that bring people to your website
The barriers that might stop them or make them leave
The hooks that persuade them to convert
so you can improve your site and give users an experience they’ll love.
Go beyond dimensions and metrics
Grab a free Hotjar trial to see what people do on your site—and understand why.