Learn / Guides / GA glossary (A-Z)
Google Analytics landing pages
Are you using the ‘Landing page’ report in Google Analytics 4 (GA4) effectively? Relying solely on the report’s default version might result in missing two crucial factors that affect marketing success: other metrics impacting your business goals and deeper insights into user behavior.
Analyzing Google Analytics landing pages allows you to identify and optimize underperforming pages. But that's akin to hearing only half of the story—what happens on your website. Great marketers know they also need to uncover why users leave those pages, so they can fine-tune campaigns and find solutions that resonate even louder.
Let this guide help you peel back the layers of data, starting from building a custom ‘Landing page’ report in GA4 to adding context via product experience insights tools like those available in Hotjar (howdy! 🤠).
This user-centric approach has repeatedly proven to ramp up conversions and boost ROI—fast.
Summary
Defining the landing page report in GA4: Google Analytics and marketing teams have two different definitions of a ‘landing page’. In GA4, any page can be a landing page.
Viewing the report’s native version in the platform: know where to find it and employ advanced filters as needed
Discussing the five metrics included in the standard report: GA4 measures sessions, new users, average engagement time per session, conversions, and total revenue by default
Discovering the benefits of analyzing landing page data: you and your marketing team can get a clear picture of user actions, monitor the impact of your marketing campaigns, and learn how your landing pages perform
Creating a custom landing page report: try another way of reporting that’s tailored to your goals with the ‘Explorations’ component in GA4, which enables you to add your chosen dimension and metrics to your report
Understanding user behavior with Google Analytics and Hotjar: combine quantitative and qualitative data to gain a complete picture of user behavior
What is the landing page report in GA4, and where can you find it?
The landing page report in Google Analytics 4 tells you which pages visitors see first when they land on your site—and whether those visits turn into clicks and conversions. Marketers use this data to determine which pages perform well and which don’t.
🤔 But wait, does that mean any page can be a landing page in GA4? Yes, as long as it’s the first page of a session.
A tale of two landing pages
Since Google Analytics and marketing teams define a landing page differently, let’s spare a few seconds to clarify in which areas they differ:
Page type
Goal/Purpose
Traffic source
GA4
Any web page, including a product page, a blog post, a sign-up page, or a help page
Encourages further exploration of your website
Paid and organic traffic sources, including a social media ad, online search result, or direct source (say, a visitor typing your URL directly into their browser)
Marketing teams
A standalone web page
Designed with the goal to convert and featuring a call to action (CTA), e.g. ‘Sign up for free’ or ‘Buy now’ (lead generation or sales)
Traffic comes from any channel employed in a marketing or advertising campaign, such as email and Google ads
Access the default ‘Landing page’ report in GA4
Here’s how to find the default ‘Landing page’ report, also known as native or standard landing page report:
Go to the ‘Reports’ tab in the left-hand navigation panel. Click ‘Engagement’ and then ‘Landing page’.
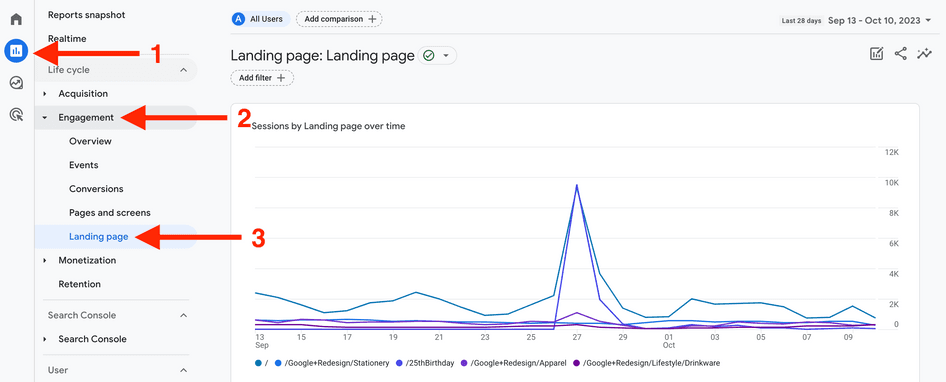
If you’re having trouble finding the Landing page report, try using the search bar at the top of the GA4 homepage.
❓ Did you know: it’s easier than ever to connect your numeric and visual data via the Google Analytics and Hotjar integration. Instantly get the context you need to analyze user behavior accurately.
Filter recordings and heatmaps using Google Analytics events, fire up a survey when a user exits a landing page, and ask for feedback on how you can enhance the user experience.
Filter data at the page level
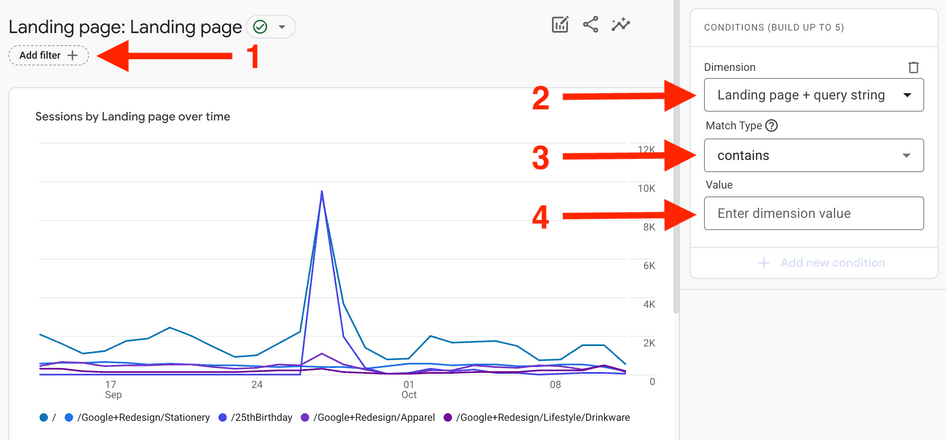
Add filters in GA4 to see how specific page types perform as landing pages. Filters let you search for dimension values (i.e. 'Landing page + query string') with exact matches, partial match phrases, or regular expressions (regex).
For instance, you can filter the product or category pages that visitors first see when they land on your site—try entering 'apparel' or 'blog' to display all relevant landing pages.
On your landing page report screen, click 'Add filter'. Then, type your search criteria.
⚡ Fast-track your knowledge: jump here to learn how to customize your ‘Landing page’ report in Google Analytics.
5 metrics to view in the ‘Landing page’ report
The ‘Landing page’ report shows how users interact with key pages on your site. Here are the metrics to look out for when viewing the default version:
Sessions: the number of sessions starting from a specific landing page
New users: the number of landing page visitors who have never interacted with your website before
Average engagement time per session: how long users, on average, actively used your site (i.e. your website was in focus on their screen, instead of being open in a tab but not displayed)
Conversions: the number of times your users triggered a conversion event
Total revenue: the sum of your earnings from purchases, in-app purchases, subscriptions, and ad revenue
Why should you track landing page data?
Tracking and analyzing your landing pages in GA4 comes with many benefits. Here are the top three to consider:
1. Get a clearer picture of user actions
Identify the pages that successfully introduce people to your website. Figure out what works and replicate it on other potential landing pages.
Do you have a blog post with a CTA button that has driven visitors to sign up for your free trial? Couple GA4's landing pages data with product experience insights from tools like Hotjar Heatmaps and Recordings. See which elements of your landing pages successfully engage visitors (more on this later) to boost your landing page conversions.
Get the full story with Hotjar
Enrich your GA4 analysis with digital experience insights.
Understand what users experience when they land on your site.

2. Monitor the impact of your marketing campaigns
Arriving on a landing page signals the beginning of a user's journey across your site. But consider this: the user (let's say their age falls between 26 and 30) may very well be in the middle of their buying journey. They've followed your Instagram page for months before clicking on an Instagram ad, and now they're on your site to make purchases.
Add a second dimension, like traffic source or demographics, to your ‘Landing page’ report so you can
Understand how new visitors, like the one above, found your website
Know what type of users engage with different elements of your landing pages
You can use this information for targeted advertisement strategies and search engine optimization (SEO). In our example, confidently adjust your marketing strategy to invest more in targeting the 'ages 26–30' demographic through paid channels.
3. Learn how your landing pages perform
Determine which pages nudge people to stick around—and convert!—and which ones need more work.
For example, you go to GA4 and notice that some landing pages log higher bounce rates than others. You see a pattern among the low performers: that is, they’re not optimized for mobile devices.
Before you launch a landing page optimization effort, watch relevant session recordings in Hotjar to validate your assumption. At the same time, find out how different elements of your landing pages cause frustration.
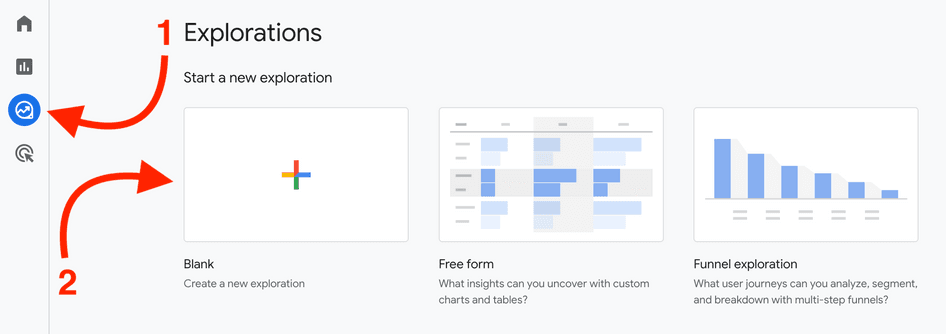
How to build an exploration ‘Landing page’ report
The ‘Explorations’ component in GA4 enables you to add the dimension and metrics you want to your report. We've talked about metrics, referring to the numerical values you see across the platform. Dimensions, however, are the attributes or non-numerical labels that help sort your data.
Start a new exploration with a blank report.
Give it a unique name so you can find it easier when needed.
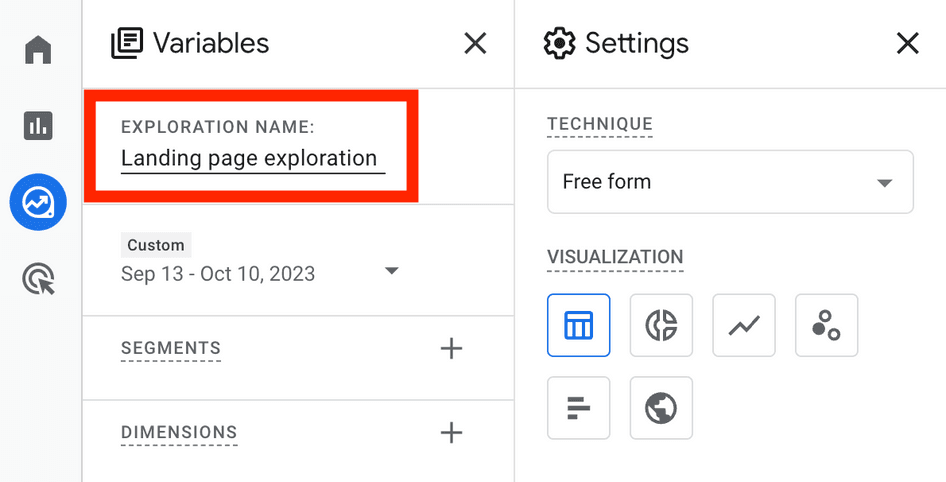
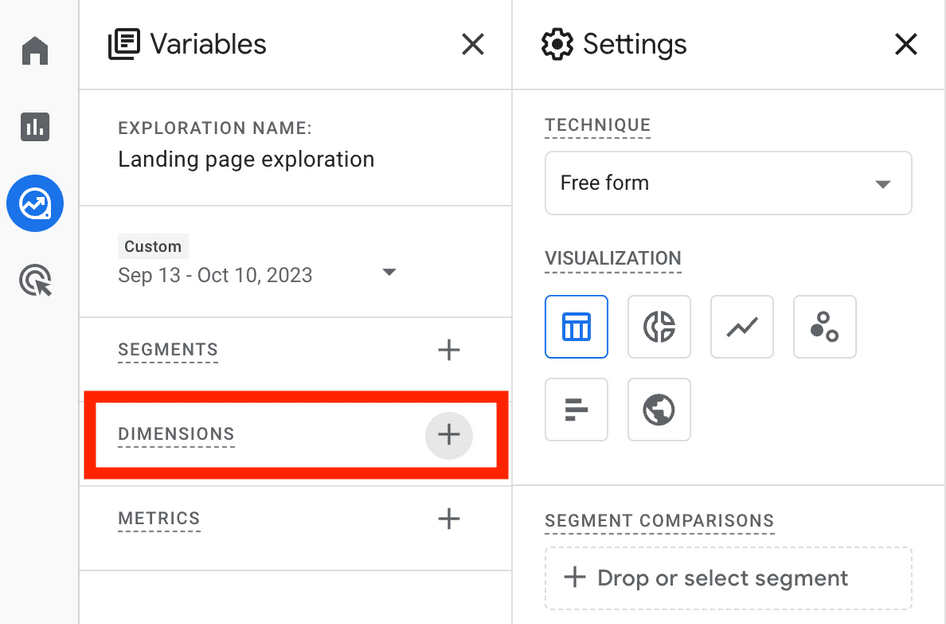
Click the ‘+’ button in the ‘Dimensions’ box.
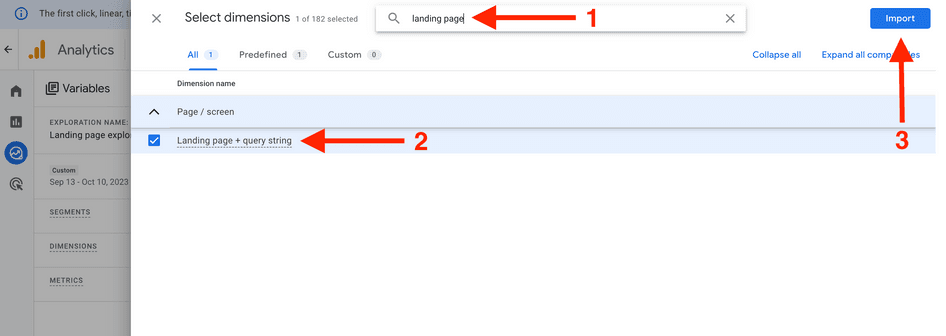
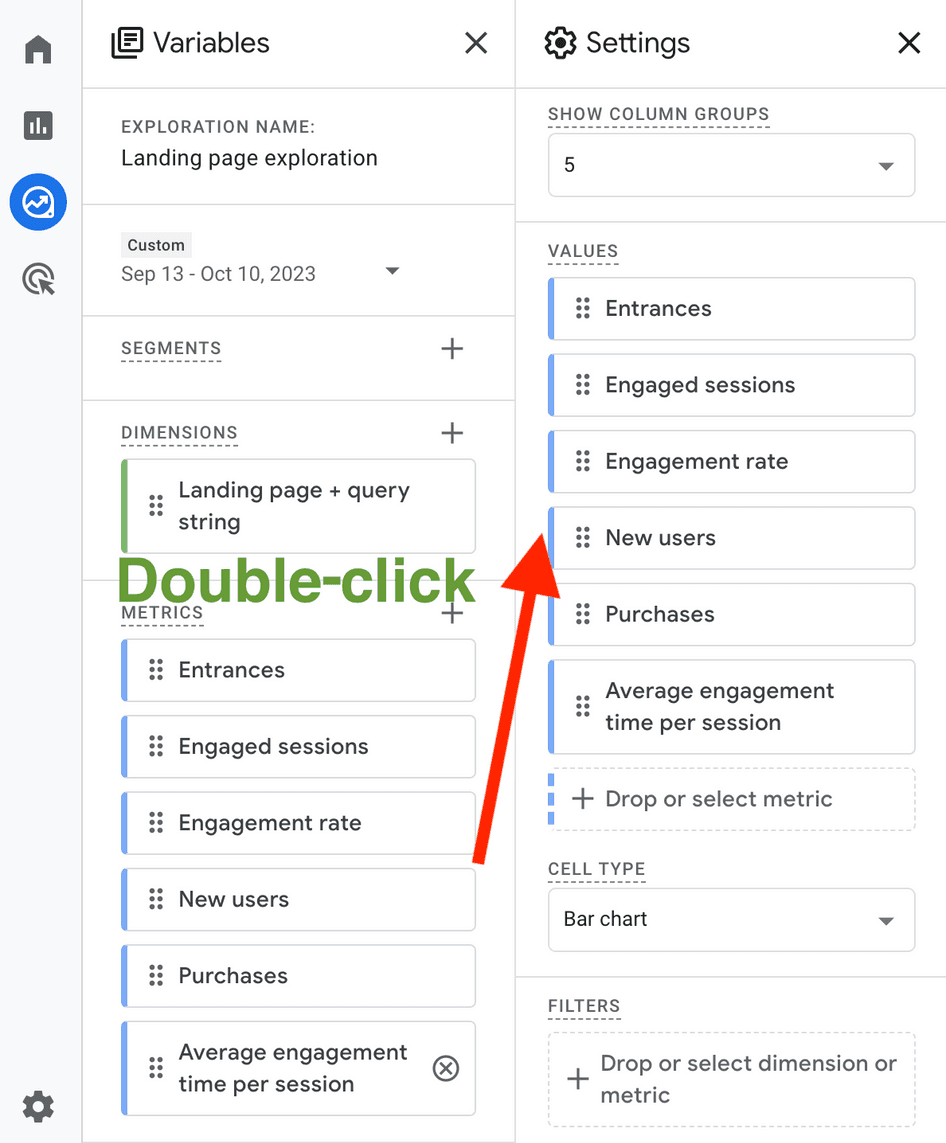
Type your preferred dimension (‘Landing page + query string’ in this case) in the search box or go to ‘Page / screen → Landing page + query string’ in the drop-down menu. Choose and import the correct dimension.
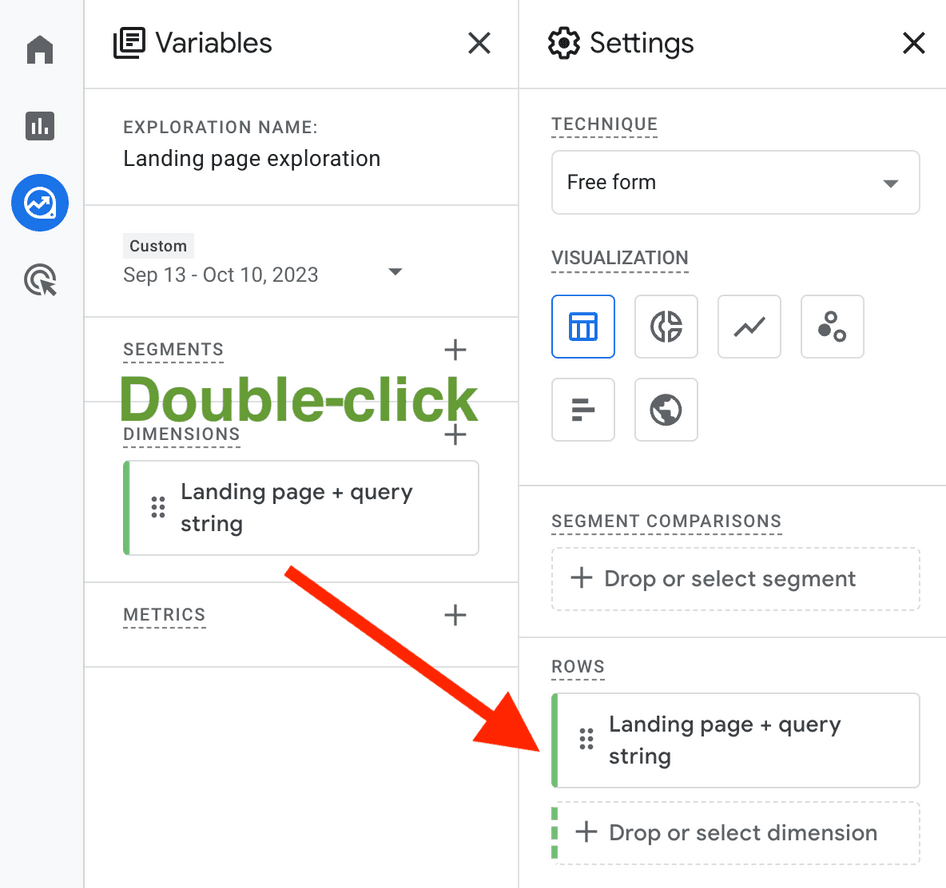
Double-click the dimension to populate the rows in your report.
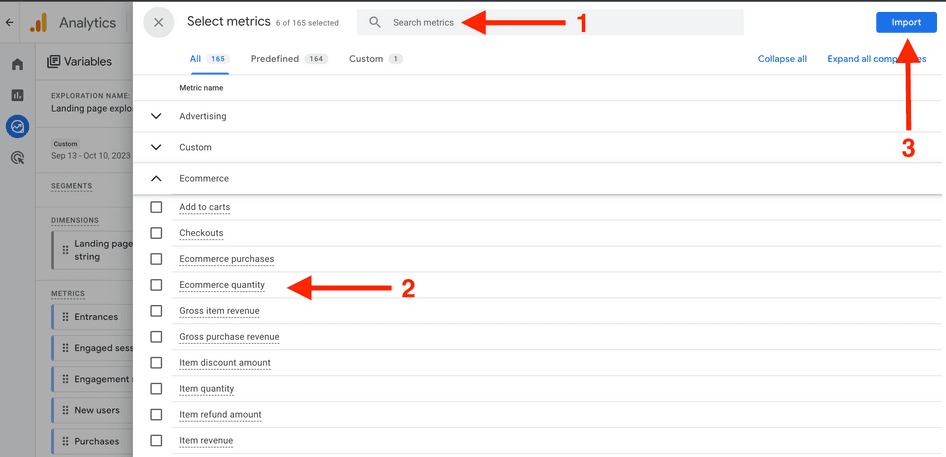
Next, add metrics in the same way you did dimensions.
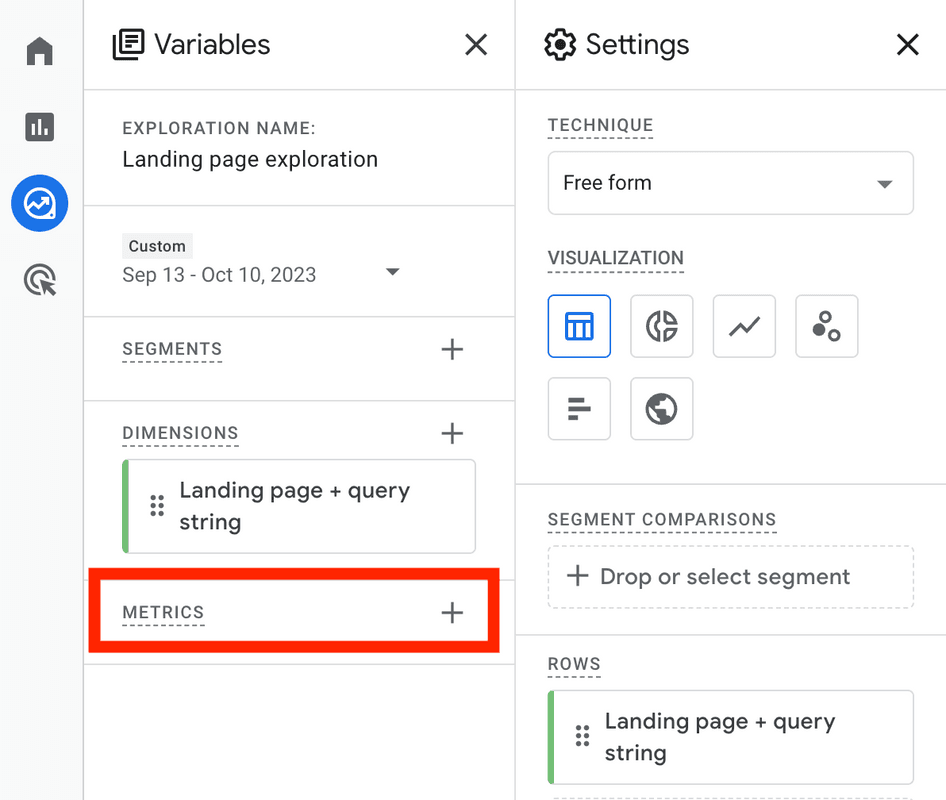
Search, choose, and import all relevant metrics.
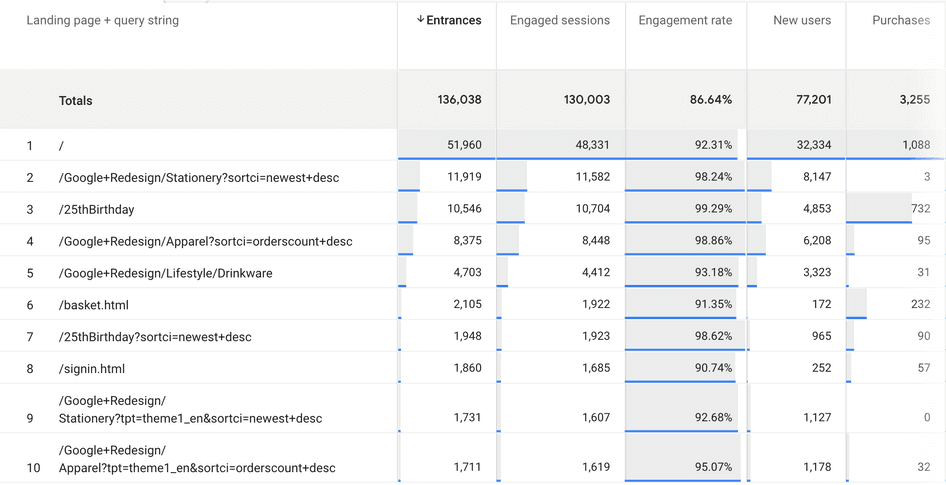
Customize how you view your data using the ‘Visualization’ feature. This is the table format. You can also choose a bar, line, pie chart, or scatterplot.
👋 Still here? Great! Don’t forget to check out any sections you may have missed. They’re like pieces of a puzzle, and each one matters in forming a clear understanding of the ‘Landing page’ report.
3 ways to enrich your insights from the Google Analytics ‘Landing page’ report
You've learned how marketing teams benefit from the ‘Landing page’ report Google Analytics provides. It delivers the numbers, helping you measure key trends in your website traffic.
But if you want a better landing page and conversion performance, it's time to combine quantitative and qualitative data. That's the difference between seeing what users do on your website and understanding why they do it.
When you interpret Google's stats with a contextual view of how visitors experience your site, your traffic and user behavior data start to make sense. You can connect the what with the why to make data-backed improvements to your site.
Ready to get started? Here’s how. 👇
Empathize with users through session recordings
Watch how users behave on your website through session recordings or session replays. Understand what they go through—how they interact with various elements, where they hesitate, and where they get stuck.
These could be the reasons behind each bounce or lost conversion. But you'll only be sure if you analyze relevant recordings in Hotjar after identifying your low-performing pages in Google Analytics.
Generate a visual view of your quant data using Heatmaps
Heatmaps use color to show which elements of your website are hot (red) or not (blue). This visual representation of popular clicks, scrolls, and mouse movements helps answer questions like
Which parts of the website attract users’ attention?
What are they ignoring?
Has user behavior changed after we released an update?

With evidence of what works and what doesn’t, you can confidently propose changes to the UX. It’s also easier to get buy-in from your bosses and alignment with team members, especially if your proposal involves multiple landing pages.
💡 Pro tip: notice some interesting activity in your heatmaps? Go from a quant to qual in a second by clicking the ‘View recordings’ button to see the individual behaviors behind your heatmaps data.
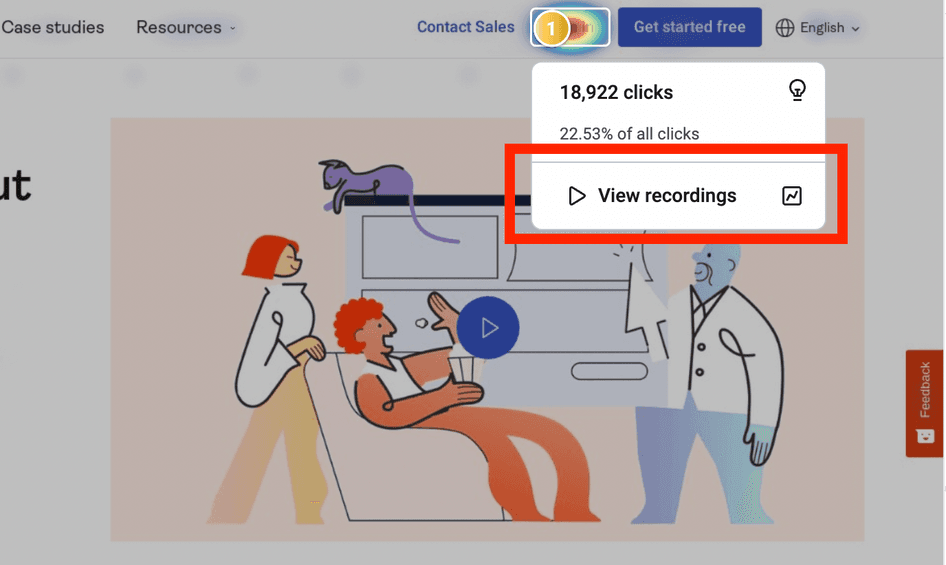
Part of a click map on the Hotjar homepage—click ‘View recordings’ to see the behavior behind the numbers
Hear directly from users with Surveys and Feedback
Surveys are the best way to get detailed insight into how your customers feel about your landing pages—in their own words. This is crucial when you’re trying to discover why users exit or churn, or evaluate the strengths and weaknesses of your user interface (UI) and UX.
Also, thanks to AI-powered surveys, it’s now easier to generate forms that ask respondents questions based on your goals.
Meanwhile, Feedback widgets help you gather and measure instant impressions from users as they navigate your site. Reading feedback allows you to put yourself in their shoes and contextualize their behavioral trends.
Use these customer experience insights to illuminate GA4 data and make more informed improvements to your landing pages.
💡 Pro tip: integrate Hotjar with Slack or Microsoft Teams to get feedback sent to a dedicated channel in real time. Then, in a single click, go from Slack or Teams directly into Hotjar to see the details of the feedback response. From there, click to view a recording of the user who left the feedback to understand what they experienced first-hand.
When numbers can’t tell you everything
We've walked you through the data-rich world of GA4's ‘Landing page’ report. And if there's one thing we hope will serve as your key takeaway, it's this:
Google Analytics is a great tool that answers the what—but the best marketers strive to understand why. By marrying raw numbers with human insights, you can go beyond analyzing data to interpreting actions and behaviors.
This helps increase empathy with your users, a good starting point for generating truly impactful changes. So, let go of that old 'qualitative vs. quantitative' mindset, and use the GA4 ‘Landing page’ report along with your favorite product experience insights tools for truly customer-centric insights.
Get the full story with Hotjar
Enrich your GA4 analysis with digital experience insights.
Understand what users experience when they land on your site.