Learn / Blog / Article
8 product analytics tools every product team should know about (and why)
If you want to create a product that gives customers exactly what they need, relying on gut feel and guesswork isn’t enough. Successful product teams need to understand their users, empathize with them, and use data-driven insights to build—and optimize—their products.


That’s where product analytics tools come in, helping you understand and analyze how people interact with your product so you can capture, understand, and act on valuable user behavior data.
Below, we’ve curated our list of the top product analytics tools every product team needs to know about. Keep reading to see which ones made the cut and why. Plus, we share our best practices for building your ultimate product analytics tech stack and creating more customer-centric product experiences at every stage of the user journey.
The 8 best product analytics tools to know
These eight product analytics software solutions offer the full spectrum of features. Choose the tools that will help your product team get the insights they need—and build products your customers love.
1. Hotjar | by Contentsquare
Hotjar, part of the Contentsquare group, is a digital experience insights platform providing behavior analytics and feedback data to help you empathize with and understand your customers.
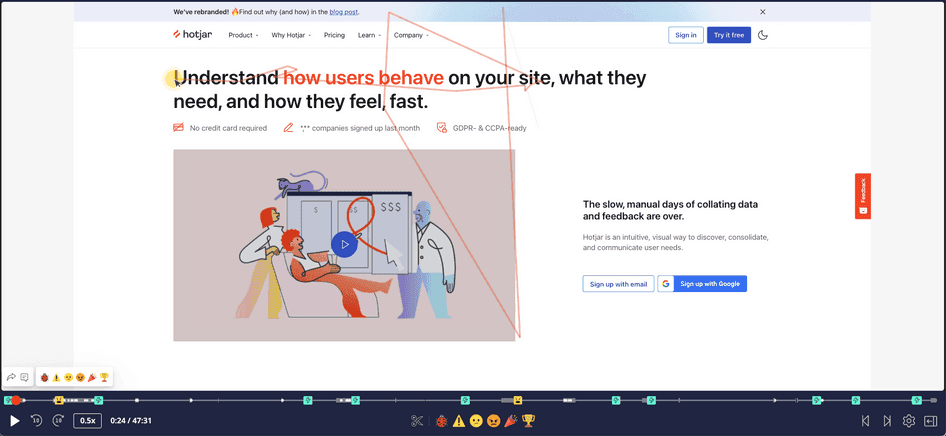
Key tools and features: Heatmaps, Recordings, Feedback, Surveys, Interviews, Funnels, Dashboard, Highlights, Trends
How it helps product teams: Hotjar gives teams comprehensive insights into how users behave and what matters to them. By visualizing how users navigate and engage with your product using Heatmaps and Recordings, you can see which parts are causing friction and quickly identify bugs.
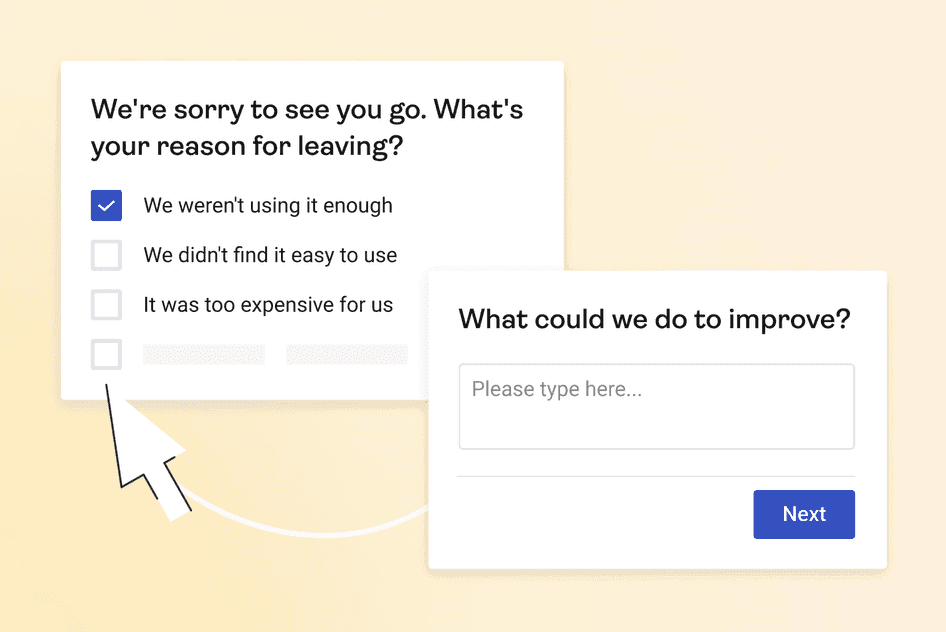
Hotjar also enables qualitative feedback collection with in-context, real-time suggestion boxes (the Hotjar Feedback widget—see that red tag on the right of the page? 👉) that let users tell you how they feel about specific parts of your product. As if that’s not enough data to keep your team going, Hotjar makes it easy to run targeted surveys and user interviews for even more in-depth information.
With this knowledge, your team is well-equipped to make optimizations that improve the customer experience, strategically prioritize your product roadmap, and use customer data to get buy-in from stakeholders.
Integrations: easily integrate Hotjar with thousands of popular apps—including Slack, Microsoft Teams, Google Analytics, and Zapier—to create an automated, connected, and powerful product analytics tech stack.
Add Hotjar to your product analytics tech stack
Start using Hotjar for free to get quantitative and qualitative data that helps you build better products—all within minutes.

2. Google Analytics
Google Analytics is a platform that collects data from your website and mobile apps to help you understand your customers across multiple touchpoints in their journey.
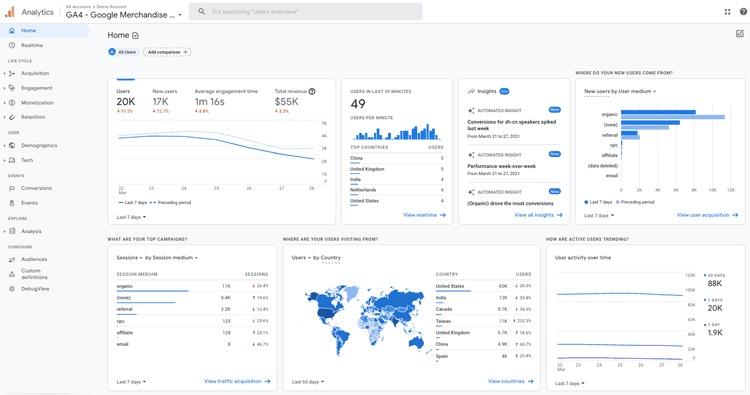
Key features: real-time data tracking, automation and machine learning, reporting, attribution, audience behavior analysis, conversion tracking
How it helps product teams: Google Analytics is a robust data platform that tracks, measures, and synthesizes crucial user data, such as:
Where users come from
How long they spend on key pages
Where they go next
Whether they convert
Google’s machine learning enhances your data with predictive insights so you can save time, and customizable reports make it easy to visualize and share your data across the business.
Hotjar integration: ✅ Hotjar and Google Analytics are a match made in heaven, allowing you to contextualize your quantitative data with additional information and customer-centric qualitative data.
The problem is that Google Analytics on its own isn’t enough. It tells me that 100 people have visited a page, whereas Hotjar shows how one specific person engages on a specific part of the page—that’s invaluable!
3. Heap | by Contentsquare
Heap, part of the Contentsquare group, is a digital insights platform that provides you with a holistic understanding of your customers' complex digital journeys, from browsing to onboarding and purchasing.
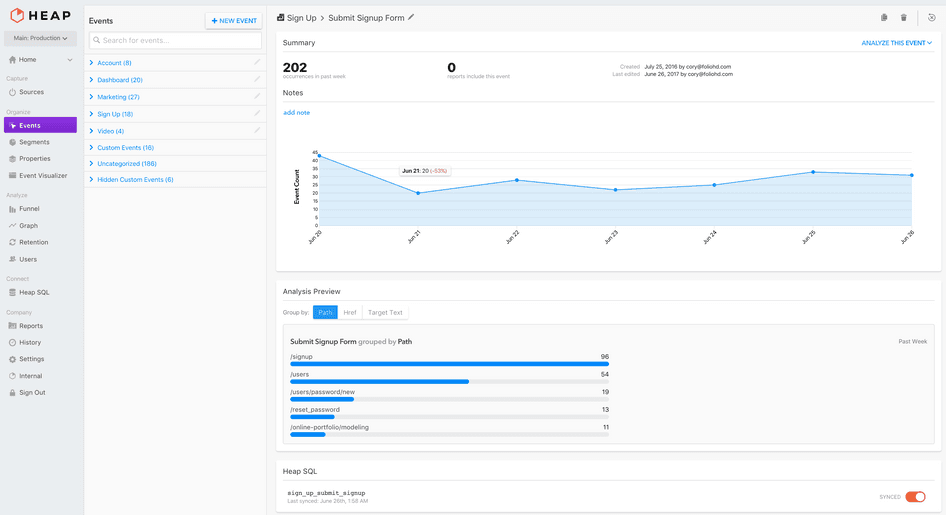
Key features: native user session replay, data capture, automated data science, data enrichment, segmentation, data visualization
How it helps product teams: Heap automatically captures qualitative and quantitative data across all your platforms to give you a comprehensive behavioral dataset. Its product analytics capabilities focus on providing you with deep insight into multi-session user journeys across devices and over time.
Heap Illuminate, a suite of advanced data science capabilities, automatically uncovers insights, highlights opportunities and areas of friction in your product, and makes suggestions for improvements. Their cross-channel user segmentation features enable you to optimize user engagement and maximize customer lifetime value.
Heap’s suggestions help product teams quickly identify and act on improvements that will have the biggest business impact.
Hotjar integration: ✅ Heap recently joined the Contentsquare group, which also includes Hotjar. Contentsquare’s product analytics features are now powered by both Heap and Hotjar to bring you an enhanced analytics experience.
4. Mixpanel
Mixpanel is a product analytics tool that enables businesses to capture and analyze key user interaction data.
Key features: interactive reports, team boards and alerts, segmentation, group data analytics, data management
How it helps product teams: Mixpanel is an excellent tool for event tracking and conversion funnel analysis. Events are specific user actions—anything from watching a video to signing up—that unveil larger trends in user engagement.
With Mixpanel’s funnel analysis features, product managers and marketing teams can track users’ progression and spot where users drop off.
Mixpanel also highlights your power users and reveals behaviors linked to long-term customer retention. These cohort analysis insights can help you reduce churn and encourage more users to take a desired action.
Hotjar integration: ✅ the Hotjar and Mixpanel integration lets you connect Mixpanel events with Hotjar data so you can understand the context behind what’s actually driving conversion rates (such as a broken button that’s causing prospects to drop off).
🔥 If you’re using Hotjar and Mixpanel
Trigger Hotjar surveys based on Mixpanel events and understand how your users feel at key moments.
When users take critical steps, such as canceling their subscription, it triggers a Mixpanel event. Then, send a Hotjar survey to users who complete this specific event to gather qualitative feedback and understand your users’ motivations.
For example, you could trigger a churn survey to ask what causes people to cancel so you can address any issues and create better experiences.
5. Contentsquare
Contentsquare is an all-in-one user experience platform that helps product teams improve customer success, conversion, and retention.

Key features: user journey tracking, session replays, retention analysis, user segmentation, zone-based heatmaps
How it helps product teams: Contentsquare is made for teams that are focused on alignment—both externally (across channels and segments) and internally (across teams). Their platform streamlines multiple product analytics datasets into one ‘single source of truth’ so you can avoid tool-toggling and ensure team alignment.
Giving you an end-to-end view of the customer experience (CX), Contentsquare is optimized for businesses looking to grow. You can measure CX impacts across campaigns, web content, and device features to optimize your product for long-term growth.
Contentsquare’s user segmentation also allows you to personalize experiences and foster loyalty among certain customer groups (e.g. new leads, active users, casual buyers). Another neat feature called Form Analysis helps you reduce web form abandonment by revealing where users fail to complete a part of your form.
Check out Contentsquare’s 2024 Digital Experience Benchmark Report to research current KPI trends and obtain actionable insights that will help you maximize visitor value all while improving the customer journey.
Hotjar integration: ✅ though Hotjar already integrates with Contentsquare, both companies (together with Heap!) have joined forces to bring you a 360° user experience and product analytics solution that integrates seamlessly across sessions and devices. Some Contentsquare features, like Session Replay, are powered by Hotjar technology to offer an enhanced analytics experience.
Add Hotjar to your product analytics tech stack
Start using Hotjar for free to get quantitative and qualitative data that helps you build better products—all within minutes.
6. Pendo
Pendo is a product experience platform that combines insights with action, helping product teams understand how people use their product and triggering in-app messages based on these findings to drive adoption.
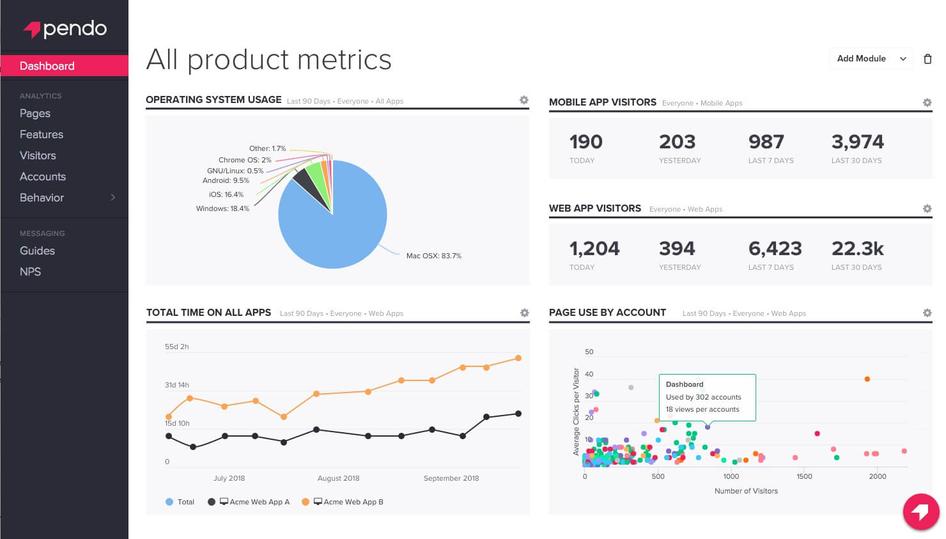
Key features: analytics, in-app guides and communication, feedback, roadmaps, portfolio insights
How it helps product teams: like many other tools on this list, Pendo gives teams the data they need to deliver better product experiences. What sets Pendo apart is the ability to use this data to trigger in-app guides and messages.
This functionality enables teams to send tailored, personalized communications that guide users to the most impactful use case features, improving product adoption.
Hotjar integration: not currently.
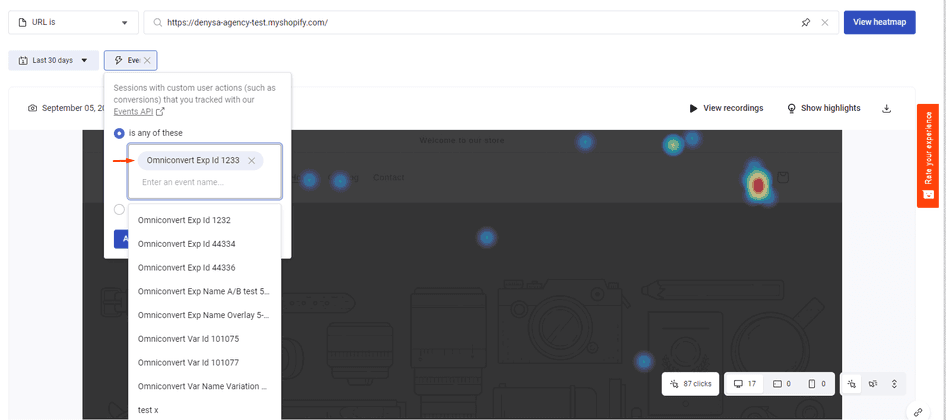
7. Omniconvert
Omniconvert is a conversion rate optimization (CRO) platform for running advanced experiments.
Key features: A/B testing, segmentation, event tracking, advanced reporting, on-site surveys, personalized overlays
How it helps product teams: Omniconvert’s Explore tool unlocks advanced user segmentation to run tailored A/B tests on any type of device.
Once you know what works best, Omniconvert lets you build on these results with stacked tests (i.e. making the winning version the control in your next A/B test) for even faster optimization.
Hotjar integration: ✅ our Omniconvert integration allows you to connect your A/B tests to your Hotjar account and filter heatmaps and recordings based on your experiments.
Alternatives: if you’re looking to run A/B and multivariate tests, Optimizely is another great choice—it also integrates with Hotjar.
8. Amplitude
Amplitude is an event-based analytics tool that tracks and analyzes user behavior.
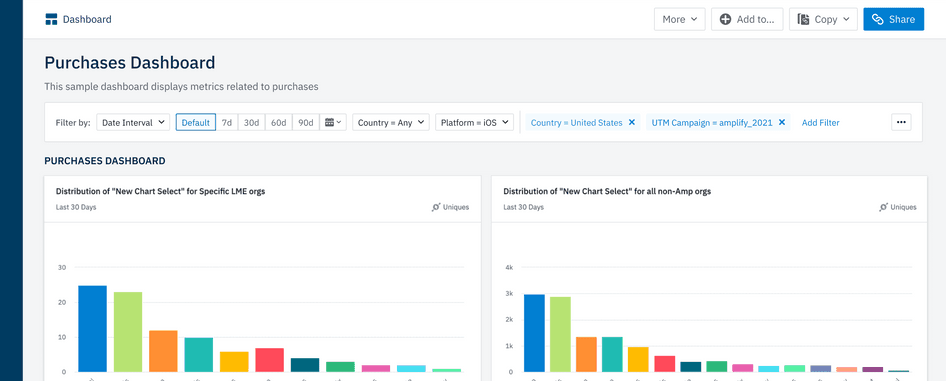
Key products: analytics, customer data platform, experimentation, data management
How it helps product teams: The Amplitude Analytics product helps teams analyze product usage, personalize the user experience, and use data to inform product development roadmaps. Another product, Amplitude Experiment, lets you use this data to plan, deliver, and analyze product experiments.
Hotjar integration: not currently.
Alternatives: Glassbox is a digital experience analytics platform that’s especially popular with enterprise users.
Top features of product analytics tools
As you'll have noticed from the list above, analytics tools draw on a range of features, including:
Heatmaps: get aggregated visual representations of where users click, move, and scroll in your product, and see which parts get overlooked
Recordings: watch playbacks of individual users interacting with your site to see how they navigate and where they get confused or frustrated
Feedback and surveys: ask users specific questions and get responses to both quantitative questions (such as “How would you rate your experience today from 1-10?”) and qualitative ones (“What would improve your experience?”)
User interviews: run interview sessions with target users for deep insights about their needs and pain points
A/B testing: test different variations of elements to see which version is more effective
Segmentation: collect and analyze data based on user attributes—like location, plan type, or industry—so you can understand how different user cohorts behave
Data visualization: represent data in intuitive ways, such as dashboards, to quickly see and share important insights
Customer journey tracking: discover how customers engage with your product across the entire customer journey, from beginning to end
Reporting: understand and share the key findings from your research to make data-driven decisions and get stakeholder buy-in
When choosing your tools, remember that qualitative and quantitative data both have a role to play: complementing your quantitative research with qualitative research, such as Surveys and Feedback, gives necessary context to your data, providing a rich portrait of what your users want and need, enabling your product team to engage in informed decision-making.
How to build your product analytics tech stack
With so many tools to choose from, how do you know which ones are right for you? Here are four factors to consider as you build your product analytics tech stack.
🛠 What does it do?
Consider the job to be done (JTBD) and which features will help you do it. For example, if the JTBD is to understand why users aren’t fully engaging with a new feature, you could use session recordings to see it through their eyes and pinpoint any issues. Complementing this with a survey or one-on-one user research helps you further understand what’s missing, so you can make improvements and increase adoption.
💰 How much does it cost?
Getting a wealth of insights shouldn’t break the bank, but some product analytics platforms are Pricey with a capital P. It’s important to find a product analytics tool that gives you the data you need but still fits within your budget. Even better, look for one that can scale with you as you grow, especially if you’re a startup. This means you only pay for what you need now, but can add new capabilities as required—so you’re not spending money on advanced filtering or events that will just go to waste.
🤝 Does it integrate with the other tools in your tech stack?
Siloed, disconnected data can be worse than no data at all. For your research to be effective, you need to connect your tools to ensure you’re getting the full picture of user and customer behavior. By connecting your product analytics tools with the other software used across your company, you can save time with efficient workflows, ensure your data stays clean, and get even deeper insights.
💆♀️ How easy is it to use?
The right tool should make digging into your product data effortless, empowering everyone in your organization to become more data-informed and share their findings. But some tools are more cumbersome than others, requiring comprehensive training or even additional engineering resources to get up and running. Look for an intuitive product analytics tool that’s easy to install, maintain, and use, so your product team can self-serve and move quickly.
Track, understand, and communicate the product metrics that matter
An excellent product that meets users’ needs doesn’t come out of thin air. Staying on top of relevant data ensures you’re putting your users at the center of your product optimizations.
With a product analytics tool in your tech stack helping you to capture, analyze, act on, and share valuable product insights, you’ll make more strategic product decisions, improve your product performance, and boost retention.
Your product analytics tech stack needs Hotjar
Start using Hotjar for free in minutes and get quantitative and qualitative data that helps you build better products.
Product analytics tools FAQs
Related articles

PX insights
8 ways to improve feature adoption in mid-market companies (with strategies and metrics for success)
Each new feature has an overarching goal: to enhance the value that customers get from your product. However, if you can’t show them the benefits and get them to adopt a feature, that value goes to waste.

Shadz Loresco
PX insights
8 ways to improve feature adoption (with strategies and metrics for success)
Each new feature has an overarching goal: to enhance the value that customers get from your product. However, if you can’t show them the benefits and get them to adopt a feature, that value goes to waste.
Shadz Loresco

PX insights
8 best session recording tools to understand user behavior on your site
Session recording tools lets you understand how users move through and experience your site.
But with so many tools that suit different purposes, how do you pick the right one for your business and customer needs?