Learn / Guides / GA glossary (A-Z)
How to track and optimize Google Analytics conversions
Tracking conversion events—e.g. purchases, adds-to-cart, and sign-ups—in Google Analytics helps you measure the ROI of marketing campaigns, identify your best- and worst-performing pages, and find your most valuable user segments.
This beginner-friendly tutorial takes you through how conversion tracking works in GA4, setting up conversion reports in Google Analytics, and how to improve your conversion rates by combining GA data with user behavior tools.
Summary
What are Google Analytics conversions?
Conversions are key actions website users take that convert them into customers, leads, or subscribers.
In GA4, all actions are tracked as ‘events’. You can select up to 30 events to track as ‘conversion events’.
4 steps to set up and track Google Analytics conversions
4 easy ways to improve your Google Analytics conversion rate
Conversions in Google Analytics
What are Google Analytics conversions?
Conversions in Google Analytics are key actions website (or app) users take that convert them into customers, leads, or subscribers.
Analyzing conversions helps you understand if visitors engage with your marketing channels and successfully move through the different steps in the sales funnel.
You can (and should) track both micro- and macro-conversions in GA:
Macro-conversions are primary business goals that directly lead to a growth in sales or customers, like a free trial sign-up, a product purchase, or a quote request
Micro-conversions are actions that are likely to lead to a macro-conversion later on, such as signing up for a newsletter, adding items to a cart, or viewing a product video
Why you need to track conversions in Google Analytics
Once you’ve set up conversion rate tracking in GA (see below for a step-by-step guide 👇), you’ll be able to view how your website, campaigns, and different audience segments perform. Use these insights to
Identify the GA dimensions and metrics that drive the most conversions
Measure the ROI of Google ads and digital marketing campaigns
Find your most profitable audience segments
Spot opportunities for conversion rate optimization (CRO)
Tracking conversion rates also helps you establish quantitative benchmarks to measure future progress against.
Optimize for conversions with Hotjar
Use Hotjar’s tools to find conversion funnel leaks and see exactly what needs fixing to increase conversion rates.

Conversions in GA4
If you used Universal Analytics (UA—the main Google Analytics version from 2012 to 2023), you might remember setting up ‘goals’ to track website actions. In UA, desired visitor actions, like making a purchase, adding a product to cart, or signing up for a newsletter, were measured as goal conversions (aka goal completions).
In GA4, there are no goals—everything is measured as ‘events’, which means
If you automatically migrated from UA to GA4, your old goals will have been turned into GA4 conversion events for you
Additional information for events is tracked as ‘event parameters’, for example, a product name, ad ID, page title, or form name. This helps you track very specific conversion events.
You can segment conversion event data by ‘user properties’, including device, location, and demographic data, to find profitable audiences
Conversion rate in GA4
In UA, goal conversion rate was calculated as the number of goal conversions divided by the number of sessions, times 100. You could use this to calculate the conversion rate of any goal, including ecommerce conversion rate.
In GA4, there are now two ways to measure conversion rate:
Session conversion rate: the number of sessions with a conversion event divided by the total number of sessions, times 100
User conversion rate: the number of users who triggered a conversion event divided by the total number of users, times 100
4 steps to set up and track Google Analytics conversions
Log in to your Google Analytics account and follow the four steps below to start measuring conversions and conversion rate in GA.
1. Set up GA4 events
Google Analytics events measure user interactions with your website, like visiting a page, clicking a button, or making a purchase.
There are three types of event in GA4:
Automatically collected events: like page_view, form_submit, and video_complete—these are already set up for you in GA4
Recommended events: like purchase, sign_up, and generate_lead—these are suggestions from GA for important ecommerce events you’ll need to set up manually
Custom events: any other event you wish to set up yourself
You must track events that are specific to your macro- and micro-conversion goals. For example, if you want to measure visits to an order confirmation page, the standard page_view event is too generic (it will trigger every time any page is viewed). Instead, you will need to create a custom event (such as thank_you_page) to track the conversion accurately.
There are two ways to add recommended and custom events in GA4:
Here’s how to add a new event in GA4: go to Admin, select your Property, then navigate to ‘Events’, click ‘Create event’, then ‘Create’. Give your new event a descriptive name (it must start with a letter, and you can only use letters, numbers, and underscores), for example, thank_you_page.
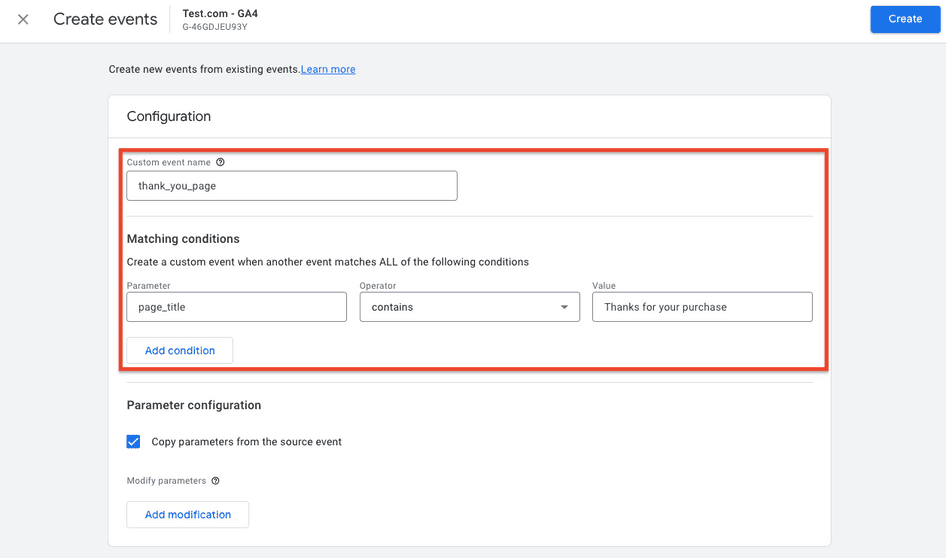
Next, configure the ‘Matching conditions’ for when you want this event to be triggered by defining a parameter to describe characteristics of an event, like a page_title, page_location, item_category, or success.
For example, you could define the thank_you_page event to trigger when a page_title parameter contains the words “Thanks for your purchase.”
GA4 collects common parameters automatically, but you can also set up custom event parameters if you need more.
2. Mark events as conversions
Now that you have your events set up, you need to tell GA which ones to treat as ‘conversion events’.
You can have up to 30 conversion events, and GA4 automatically marks a few events as conversions for you:
purchase (web and app)
first_open (app only)
in_app_purchase (app only)
app_store_subscription_convert (app only)
app_store_subscription_renew (app only)
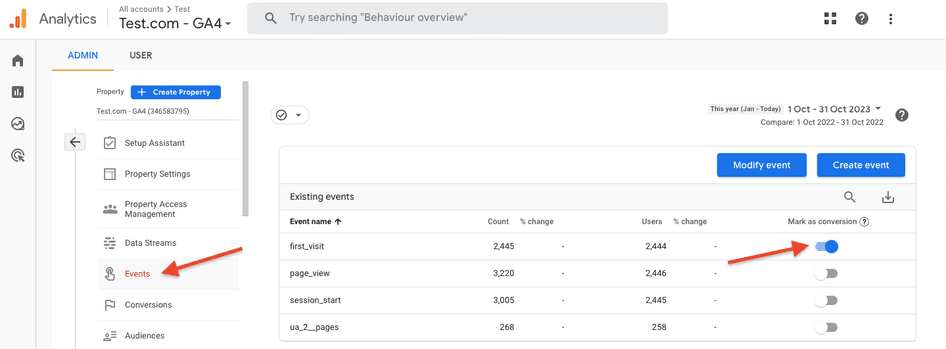
To add new conversion events in GA4, navigate to the Admin panel in the bottom left. Under your property, click ‘Events’ to view a list of existing events. Under the ‘Mark as conversion’ column, click the toggle to turn any event into a conversion event.
💡 Pro tip: conversion event tracking in GA4 is not retroactive, so set your conversion events up as soon as possible to avoid missing data.
3. View conversion reports
Once GA has collected some conversion events for you, you can generate conversion reports.
Navigate to Reports > Life cycle > Engagement > Conversions to view the conversion event overview report.
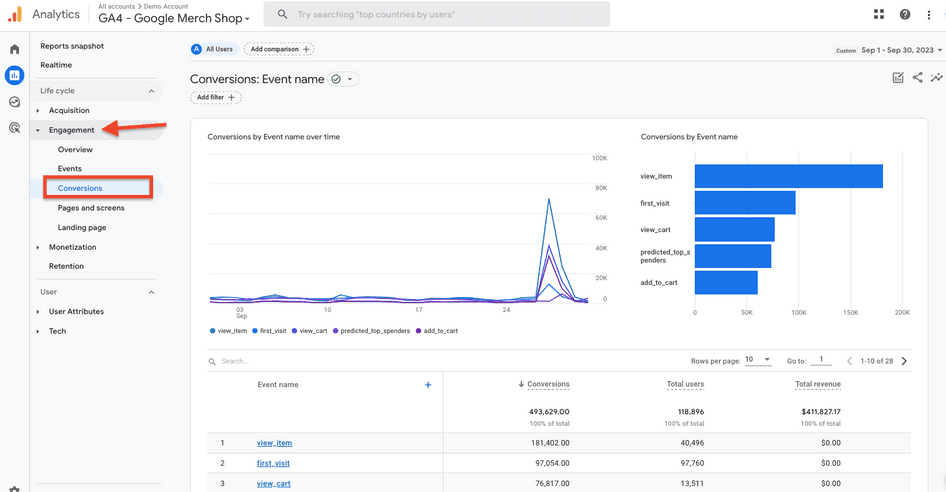
Select a timeframe, and you’ll see the number of conversions generated for each conversion event you’ve set up. Click any conversion event in the ‘Event name’ column to view a breakdown of that event’s conversions by channel group, source, medium, or campaign.
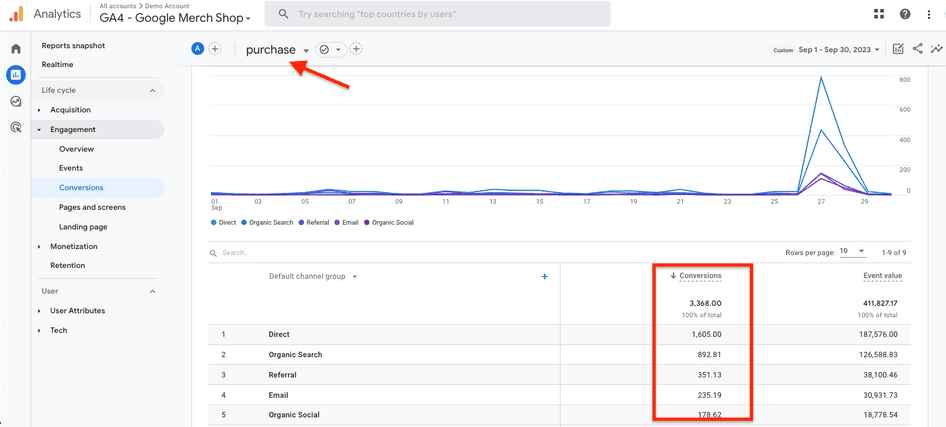
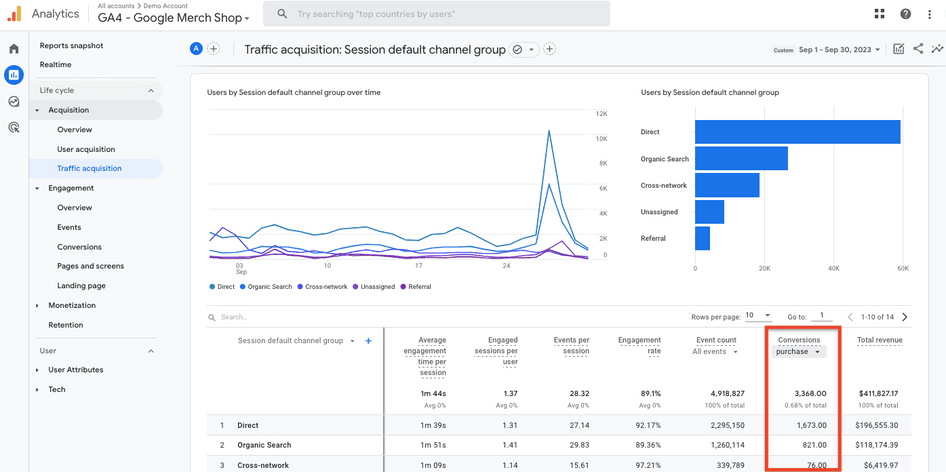
You’ll also find conversions in other GA4 reports. By default, the conversion column will show all events—click the dropdown to select a specific one.
4. Add conversion rate to reports
By default, GA4 shows the total number of conversions in reports, but not conversion rate.
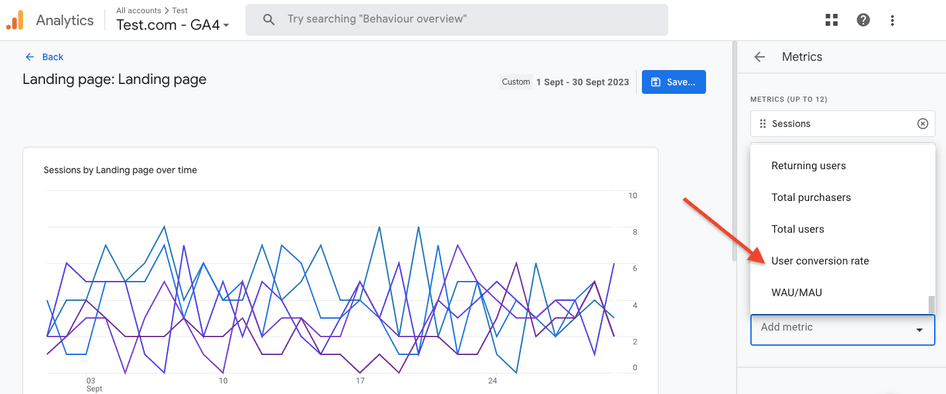
To add conversion rate to any GA4 report, click the ‘Customize report’ pencil icon, then go to Metrics > Add metric and select either of the following:
Session conversion rate: the number of sessions with conversions divided by the total number of sessions, times 100
User conversion rate: the number of users who converted divided by the total number of users, times 100
Click ‘Apply’, then save the report.
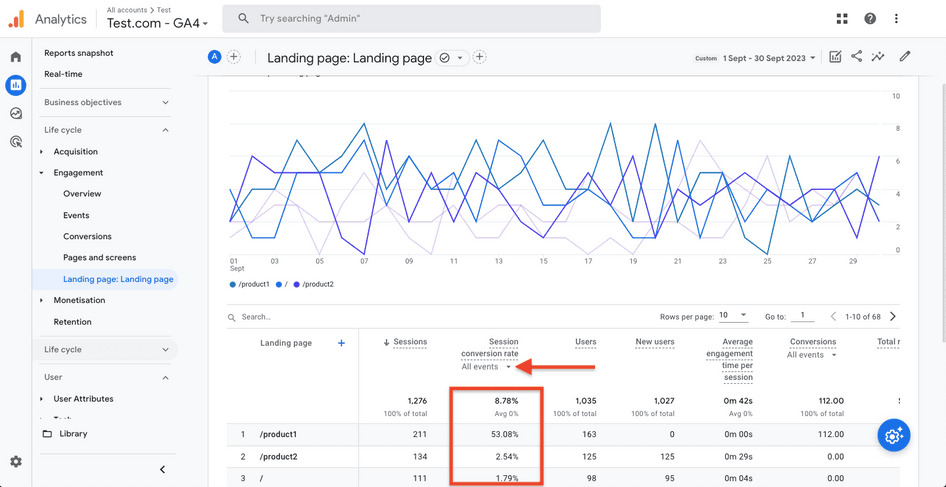
As before, the default view will show a conversion rate for all conversions combined—click the ‘All events’ dropdown to view the conversion rate of a specific event.
If you want a replacement for UA’s ecommerce conversion rate metric for ecommerce tracking, add GA4’s session conversion rate metric to your reports and click the ‘All events’ dropdown to select the purchase conversion event.
4 easy ways to improve your Google Analytics conversion rate
GA4 will show you which pages convert well and which underperform, but it can’t explain why users convert or bounce.
Here are four easy ways to combine your GA conversion data with user behavior insights and improve your conversion rate.
1. Use funnels to visualize conversion drop-offs
Visualizing conversion funnels helps you identify which steps in the customer journey get the most drop-offs—and, therefore, which ones you need to optimize to increase conversions.
You can create a funnel in GA4 using the funnel exploration feature (Explore > Funnel exploration). Better yet, use a tool like Hotjar Funnels to view and compare conversion funnels for different segments (e.g. desktop vs. mobile performance), and click straight through to session recordings of real visitor cohorts.
2. Use heatmaps to see where visitors pay attention
Heatmaps are visual representations of aggregated user clicks, scrolls, and mouse movements on your website. There are five main types:
Click maps: where users click or tap
Scroll maps: how far down the page users scroll (and the average fold)
Move maps: where users move and hover their mouse
Engagement Zones maps: combined clicks, scrolls, and mouse movement to measure overall engagement
Rage click maps: where users repeatedly click (likely in frustration)

If you use Hotjar Heatmaps, you can filter heatmaps by any conversion event to instantly see what’s drawing clicks away from your main CTA and lowering click-through rate.
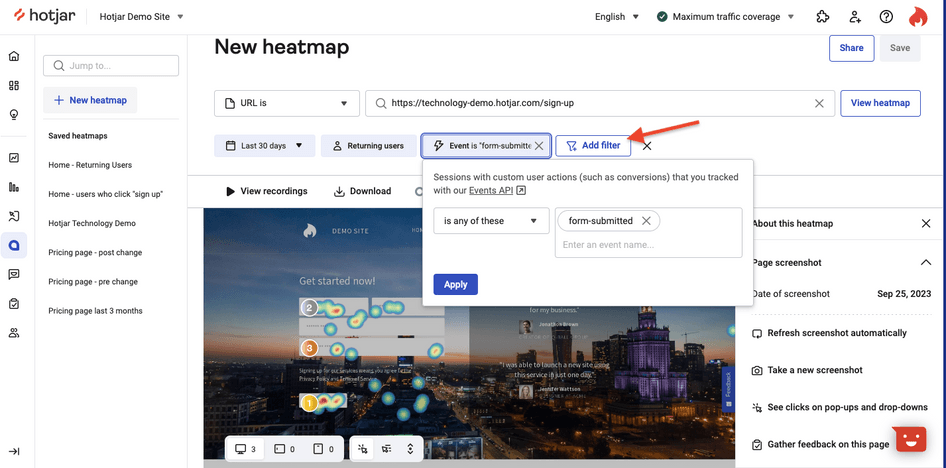
🔥 If you’re using Hotjar
Tracking events in Hotjar is very similar to Google Analytics—we use Events to track user actions so you can filter your Hotjar data by your macro- and micro-conversion events like form submissions, button clicks, and purchases.
3. Use session recordings to spot bugs
Session recordings are video-like recreations of real user browsing sessions across multiple pages on your website. They let you view what visitors do before (and after) they convert or bounce.
Use a tool like Hotjar Recordings to watch session recordings of visitors who don’t convert. Filter by issues like rage clicks or errors to find easy-to-fix bugs stopping people from making a purchase.
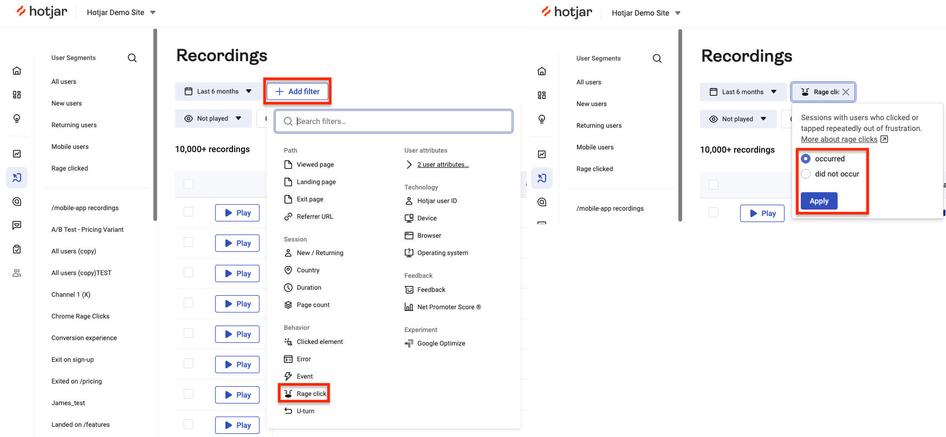
For example, when agency Ecommerce Warriors used Hotjar Recordings on fashion ecommerce brand Red Dress Boutique, they saw users repeatedly rage-clicking 'Add to bag' on certain products because they didn’t realize a size needed to be selected to continue.
The team A/B tested changes to the size selector element and paired it with UX copy that made selecting a size clearer. User experience and conversions quickly improved!
💡 Pro tip: set up Hotjar’s GA integration to combine your Google Analytics and Hotjar data. Use it to filter Hotjar sessions by specific GA conversion events and trigger surveys when GA event conditions are met.
4. Use surveys to learn what drives users to convert
Quantitative metrics like conversion rate can help you measure business growth, but they will never help you deeply understand your most valuable asset: your customers.
Sending users a few questions via email or triggering an on-site survey can help you learn both what’s causing visitors to bounce without making a purchase and what drives loyal customers to return.
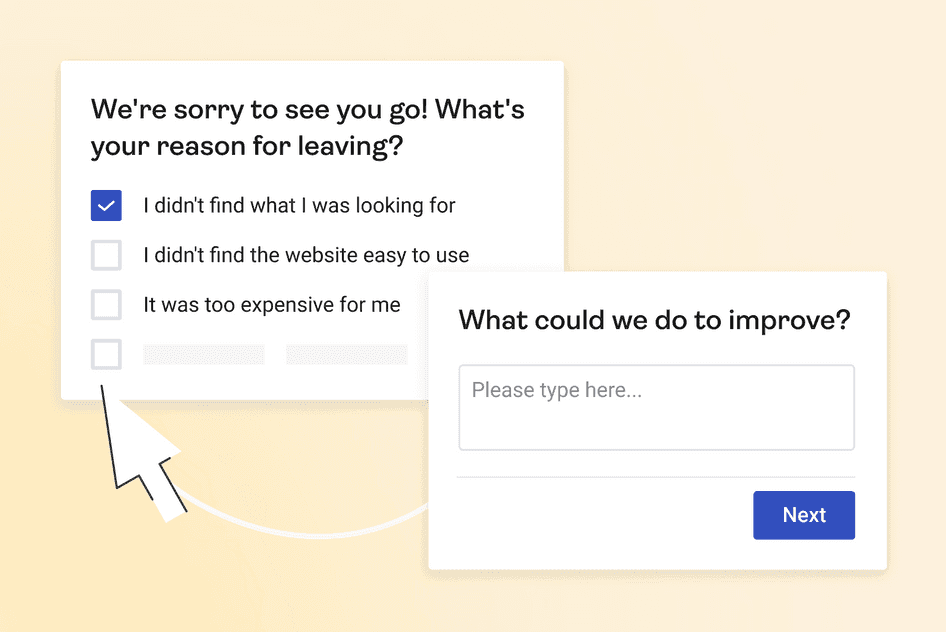
Questions from our free exit intent survey template—use it to reduce cart abandonment
Try these two simple ways to collect valuable conversion insights:
Use a tool like Hotjar Surveys to trigger an exit survey when visitors leave without making a purchase—ask them what they were looking for and what they needed. Use the insight to fix issues and improve messaging for future visitors.
Trigger a post-purchase survey when customers convert and ask them: “What almost stopped you buying from us today?”—this will reveal issues like bugs or unclear information that might make less determined visitors bounce
Power-up your GA4 conversion data
As we’ve shown, measuring conversions in Google Analytics has a wealth of benefits—but it can’t help you visualize what engages or frustrates your visitors, or understand what’s going through their minds when they click away.
Instead of guessing what pushes visitors to convert or bounce, use insights from Hotjar’s suite of behavior analytics tools to make data-backed optimizations that improve your conversion rate. You’ll be in good company:
Materials Market tripled conversions in one month using Hotjar Recordings
The Good increased luggage retailer Swiss Gear’s ecommerce conversion rate by 14% using Hotjar Heatmaps
Turum-burum increased shoe retailer Intertop’s conversion rate by 55% using Hotjar Surveys, Heatmaps, and Recordings
Optimize for conversions with Hotjar
Use Hotjar’s tools to find conversion funnel leaks and see exactly what needs fixing to increase conversion rates.