Learn / Guides / GA glossary (A-Z)
How to use secondary dimensions in GA4 to uncover website and customer insights
Imagine your local librarian asks what you’re looking for today, and you respond with, “A book.” While they can certainly help you find one of those, a little more detail goes a long way in seeking out the most satisfying experience.
Similarly, extra context and details—secondary dimensions—help you leverage Google Analytics 4 (GA4) to answer questions, identify problems, and improve your customer experience (CX).
Summary
Secondary dimensions in GA4 help you unlock comprehensive user insights that enhance your marketing and product development campaigns, particularly when used alongside behavior analytics tools. This article explains:
What is a secondary dimension in Google Analytics 4? Secondary dimensions in GA4 are additional criteria you can add to your Google Analytics reports to give you more granular insights about your data.
How to set up secondary dimensions in Google Analytics in four easy steps
Benefits of using secondary dimensions include quickly identifying (and fixing) website issues that impact your customer experience; better allocating resources to your most profitable channels or segments; and analyzing your conversion funnels to find blockers in your marketing flows
Why do you need to complement GA data with insights from user behavior analysis tools? GA4 gives you quantitative data about what users do—but it doesn’t reveal why they do it. Understanding the motivations behind user behavior is crucial to empathizing and connecting with your customers.
To get this additional layer of information, you need to combine GA4’s quantitative data with insights from behavior analytics tools like
What is a secondary dimension in Google Analytics 4?
A secondary dimension in Google Analytics is an additional parameter you add to your data analysis to get more detailed information about your visitors’ activity on your product or website.
Secondary dimensions narrow down the data from your primary dimensions to create subsets that enable you to find nuances. For example, using a combination of primary and secondary dimensions, you might learn that new users in South America interact with your website differently than new users in Asia.
In addition to the predefined GA4 dimensions, you can also create custom dimensions. These include
User-scoped custom dimensions, which help you capture and understand more information about your users
Event-scoped custom dimensions, which help you understand user behavior based on actions they take
Item-scoped custom dimensions, which help you understand item-specific data on your ecommerce site, like product color
Using these custom parameters as primary or secondary dimensions when reviewing your analytics data gives you even deeper, business-specific insights about user activity, helping you tailor your digital marketing, site content, and customer experience for different user personas.
Dimensions vs. metrics: understanding the difference
A dimension in Google Analytics is an attribute used to describe, segment, organize, and sort data, such as your website page or a visitor’s language. Every Google Analytics report has a primary dimension, and you don’t have to add a secondary dimension.
A metric is a quantitative measurement that applies to the dimension—like a bounce rate percentage.
How to set up secondary dimensions in Google Analytics in 4 steps
Ready to analyze your website data? Here’s a step-by-step guide on how to set up secondary dimensions in Google Analytics.
1. Choose your Google Analytics report
Access the detail reports panel by clicking the Reports icon (📊) on the left side of your GA4 dashboard. Choose the report you want to view, like ‘User acquisition’ or ‘Demographic details’. Be sure to set the date range on the top right side of the dashboard.
2. Click the ‘+ ’ next to the dropdown on the far left of the table
Each report has a default dimension you can change by clicking the drop-down arrow. When you want to add a secondary dimension, click the plus sign to the right of the primary dimension.
3. Browse secondary dimensions to find what you need
Browse the secondary dimensions’ drop-down menu by category (like Demographics, Geography, and Custom dimensions), or use the search bar.
4. Select the secondary dimension you want to add
Select the dimension name. The report automatically updates when you choose a secondary dimension. Each dimension accepts different values that give you more information about the specific data you’re capturing, appearing under the dimension in your report. For example, in the screenshot below, the dimension ‘Device category’ has the dimension values ‘mobile’ and ‘desktop’.
Enrich your GA4 data with user behavior insights from Hotjar
Add an extra dimension to your data analytics with rich quantitative and qualitative data from Hotjar.

How secondary dimensions help online businesses improve CX
Narrowing your product analytics focus reveals nuances in your data you might miss if you only review GA4 reports with primary dimensions. GA4’s secondary dimension feature also helps you compare data sets to understand user behavior across audience sub-segments, helping you refine your marketing efforts for different cohorts.
Here’s how secondary dimensions give teams additional context to make data-informed decisions.
Spot how different devices affect the customer experience
The goal: understand how user engagement varies based on device.
What to do:
Open the Engagement > Events detail report, which has the primary dimension ‘Event name’
Add the secondary dimension ‘Device category’
Compare how the metrics for key engagement events, like adding items to cart or viewing items, vary between devices
If there’s a huge gap between the numbers for desktop and mobile devices, it could be a sign that your mobile site is difficult to use. In this situation, prioritize optimizing your mobile UX design and monitor how the changes impact engagement.
Identify and target your ideal customers
The goal: learn more about your most engaged user segment and understand impactful ways to reach this audience.
What to do:
Open the User > User attributes > Audiences detail report, which has the primary dimension ‘Audience name’
Add the secondary dimension ‘Age’ or ‘Country’
Learn which demographic groupings your engaged users fall under, e.g. age 25–34 or located in the United States
Use this information to guide your targeting when you launch new campaigns or Google Ads
Understand which channels drive the highest revenue
The goal: find correlations between traffic sources and your revenue-generating items customers purchase.
What to do:
Open the Monetization > Ecommerce purchases detail report
Set the primary dimension to ‘Item name’
Add the secondary dimension ‘Session source / medium’
Review the ‘Item revenue’ metric to see which items brought in the most money, then use your secondary dimension to discover how users found that item
Invest more resources into your successful channels (for example, if you spot that an email newsletter led to a major boost in sales, consider experimenting more with email marketing or growing your newsletter subscribers)
4 ways to combine GA4 data with behavior analytics to make faster, more customer-centric decisions
Primary and secondary dimensions offer a quantitative look at outcomes—like how long someone spent on your mobile site or how often new users in Canada completed a transaction.
But you need qualitative information to understand causes—like discovering that new users in Canada want to learn about shipping costs before they start a purchase or they’ll abandon the checkout process.
Actionable insights and user behavior patterns reveal themselves when you combine qualitative and quantitative data.
User behavior insights, or behavior analytics, teach you exactly how customers interact with your website, web app, or service, so you can expand on what you find through your Google Analytics account, make customer-centric decisions about your next marketing campaign or product launch, and optimize your conversion rate.
Here are some ways to get more from your GA4 data using behavior analytics tools (like the Hotjar suite—that’s us! 👋).
1. Visualize your user journey to find and fix website issues
Numbers only tell you what happened—not why or how it happened. For that, you need to use visual tools like recordings and heatmaps.
Hotjar Recordings are video-like playbacks of real (anonymized) users as they navigate your site, showing you exactly what they interact with, what they ignore, and where they get stuck
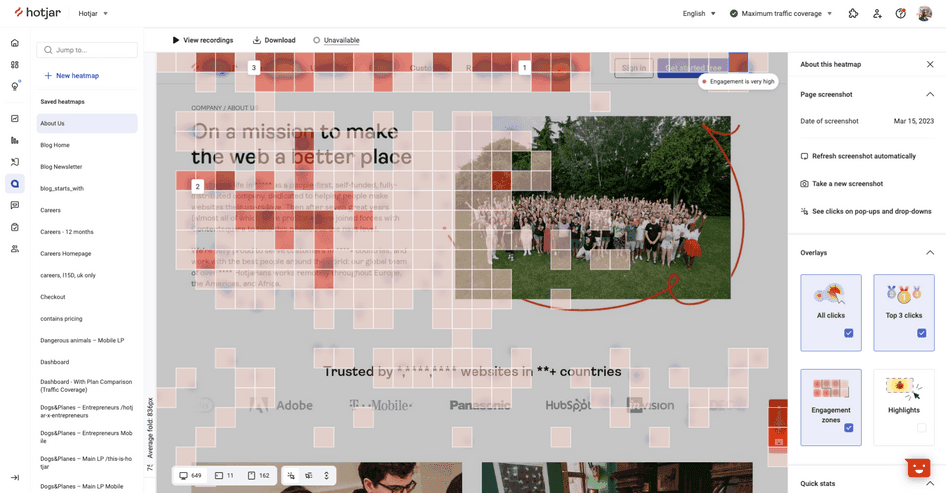
Hotjar Heatmaps are color-coded representations of where users scroll, click, and move on your site. They reveal which areas capture customer attention, as well as which elements—like CTA buttons—get overlooked.
Use these tools to contextualize the numbers from Google Analytics and see exactly what your users see, so you can empathize with their experience.
For example, use GA4 to identify landing pages with the highest and lowest conversion rate, then use Engagement Zone heatmaps in Hotjar to discover why certain elements work and others don’t. Jump straight from your heatmap into relevant recordings to watch what makes users rage click or u-turn in frustration, or spot what caught their interest and compelled them to convert.
🔥 If you’re using Hotjar: enable the Hotjar and Google Analytics integration to get a deeper understanding of what happens on your site and why. Filter heatmaps or recordings in Hotjar by Google Analytics events to see your users’ behavior behind the numbers, and quickly find opportunities to improve the customer experience.
2. Connect with customers directly to understand what matters to them
The people who use your site are more than static dimension data or a number in a user acquisition report. To get a full picture of your customers—who they are, what they’re looking for, and what drives them—you need to talk to them directly using tools like Hotjar Surveys, Feedback, and Engage.
Surveys are questionnaires you can trigger for targeted user groups or embed anywhere on the page, allowing you to get responses to predefined questions like, “How did you hear about us?” or “Would you recommend our company to a friend?”
Feedback is an on-site widget that empowers users to leave comments at any time, at any stage of their journey, and about any element of your website or experience
Engage is a user interview tool that makes it easy to have discussions with customers or participants who meet your research criteria, enabling you to get in-depth insights about key topics
Capture contextualized customer feedback in the moment with an always-on feedback widget
For example, use the events set up in Google Analytics to trigger a survey when users perform a certain action, like making a purchase. If your surveys unlock a particularly juicy insight, or you find something in a GA4 report that warrants further exploration (like a sudden spike in abandoned checkouts), run user interviews to learn more.
You can also use the data from your surveys, feedback, and interviews to build psychographic customer profiles, understand your target audience’s pain points, and tailor your product and marketing roadmaps to user needs.
🔥 If you’re using Hotjar: create surveys in seconds with Hotjar AI. Just enter your research goal and sit back as it generates relevant questions based on what you want to learn.
Use Hotjar AI for Surveys to take the hassle out of creating questions and analyzing responses
3. Analyze marketing flows to discover what prevents people from converting
If GA4 reveals a sudden drop in numbers for your conversion funnel, it can be panic-inducing: you know that people didn’t move to the next stage, but if all you have are numbers, you have no idea why not.
Enter: a funnel analysis tool that actually shows you. Hotjar Funnels visualizes the customer journey as a series of steps and lets you zoom in and out to get the insights you need.
For example, get an immediate overview of your funnel and quickly spot where users drop off. Then, zoom in and watch what actually happened at each stage with recordings. Use filters and segments to get even more granular, so you can understand which marketing channels, locations, and user types have the best results and which ones need improvement.
Once you identify what prevents people from progressing through your funnel, you can address it—reducing customer effort and getting your website conversions back on track.
4. Get at-a-glance user insights to make meaningful decisions
It can be difficult to cut through all the noise in Google Analytics. Stay on top of the metrics that matter to you by creating custom dashboards and tracking trends, giving you visual overviews of key user behavior data in one place.
Hotjar Dashboards brings all the information you need together, making it your one-stop shop for key session data and user insights that inform empathetic decision-making—reducing the need to switch between GA4 and other tools to get the information you need.
Hotjar Trends lets you visualize your data over time, allowing you to quickly spot (and address) spikes or dips in key metrics. Then, jump from trend charts in your dashboard into the real user behavior behind those spikes and dips.
What we love about Trends is watching the recordings behind the numbers to explore why a metric is up or down.
Make user empathy part of your analysis with behavior insights
Secondary dimensions in Google Analytics are an opportunity to look at website analytics from new angles, but they’re just one tool you can use to create a positive customer experience.
Enrich your GA4 data with insights from behavior analytics tools to go beyond the numbers and truly empathize with your customers. Identifying the motivations and needs that drive user behavior lets you tailor your product, marketing campaigns, and customer experience to real users—so you can make long-lasting connections.
Go beyond basic analytics
Pair data from secondary dimensions in Google Analytics with Hotjar’s tools to create more engaging marketing campaigns and customer experiences—and boost conversions.