Learn / Guides / Heatmaps guide
Scroll maps: 5 ways to optimize UX and increase conversions
Scroll maps—heatmaps that track scrolling behavior on a website or app—are a powerful visual analytics tool that help you understand how users interact with your web pages and page elements so you can make sure your site cultivates conversions and delivers an outstanding user experience.

Scroll heatmaps gather valuable information about user behavior, helping you measure visitor engagement and determine where you’re losing people’s attention on your website. Scroll maps quickly collect data on how visitors scroll through your website, so you can spot opportunities for user experience (UX) improvements, make changes, and, ultimately, increase conversions.
By the end of this article, you’ll know everything you need to know about scroll maps: what they are, how to set one up, and how to use them to find actionable insights that will supercharge your user experience.
Set up a scroll map today 🔥
Start collecting free scroll map data with Hotjar and discover how users experience your most important web pages so you can improve UX and increase conversions.

What is a scroll map?
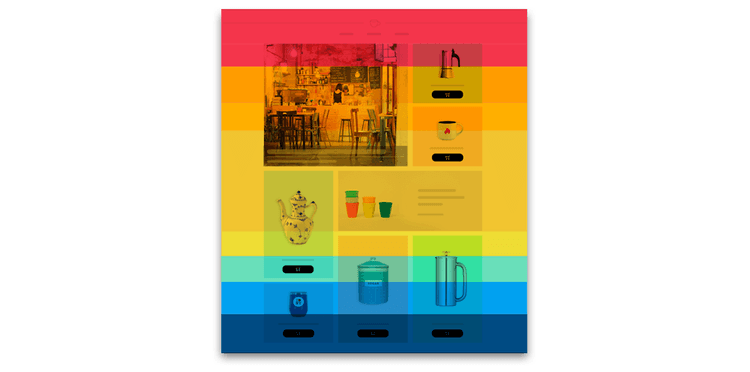
A scroll map is a type of website heatmap that visually shows how far users scroll down a page on a desktop, tablet, or mobile device. Scroll maps use a color gradient to represent the most- and least-viewed parts of a page, from hot (popular) to cold (unpopular). Red indicates the elements of your page users see the most, while blue represents low or no customer interaction.
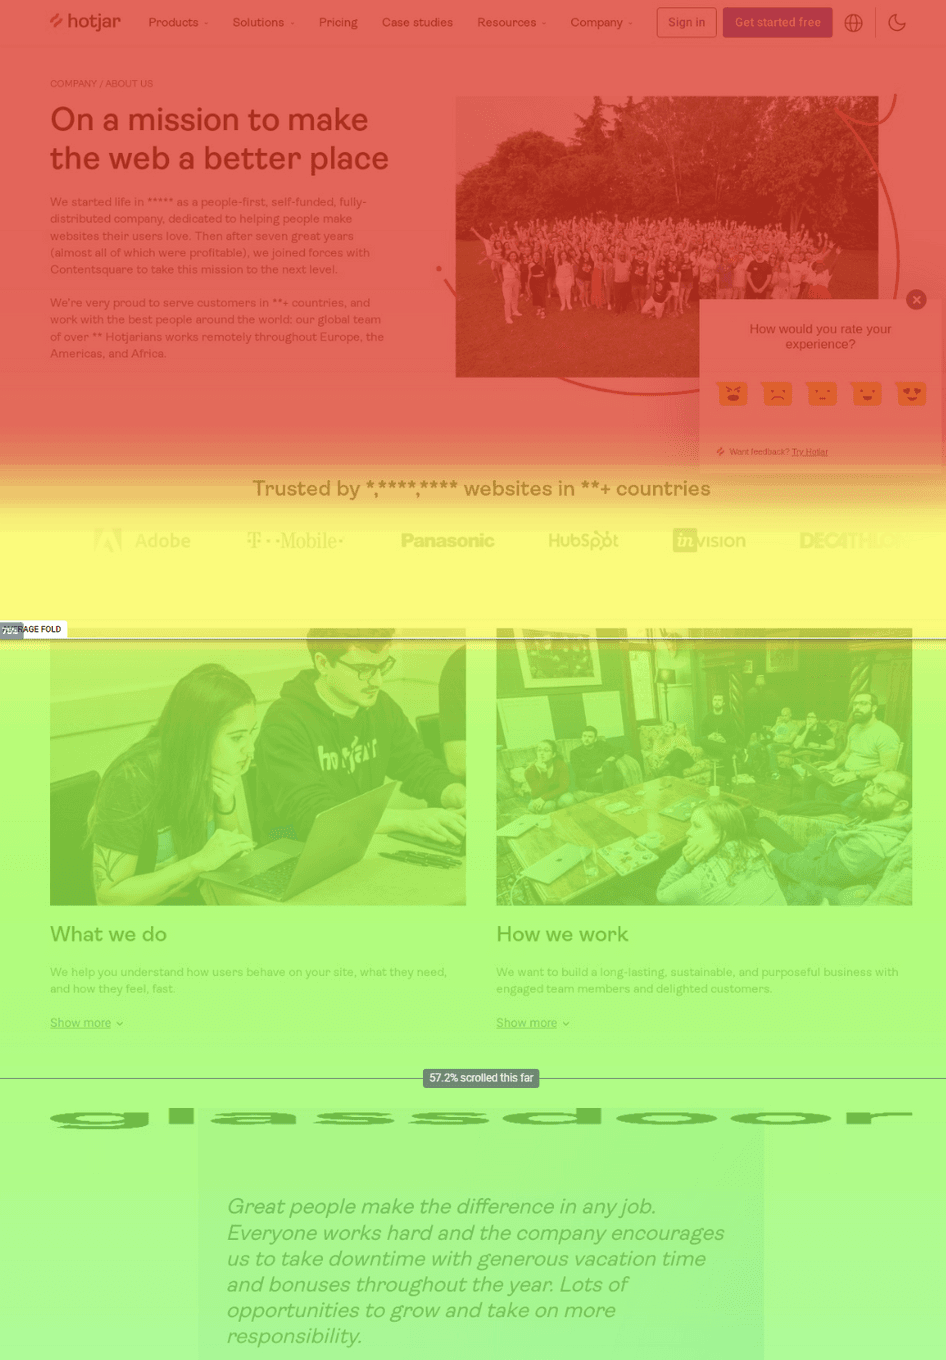
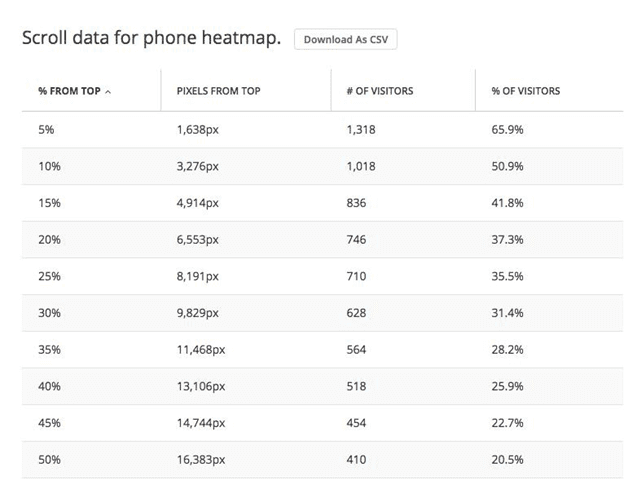
Scroll maps aren’t just about color: they also let you know what percentage of users ventured further down the page. An average fold score is displayed as well, so you can easily visualize the part of the page most visitors see before they start scrolling.
Scroll maps vs. heatmaps
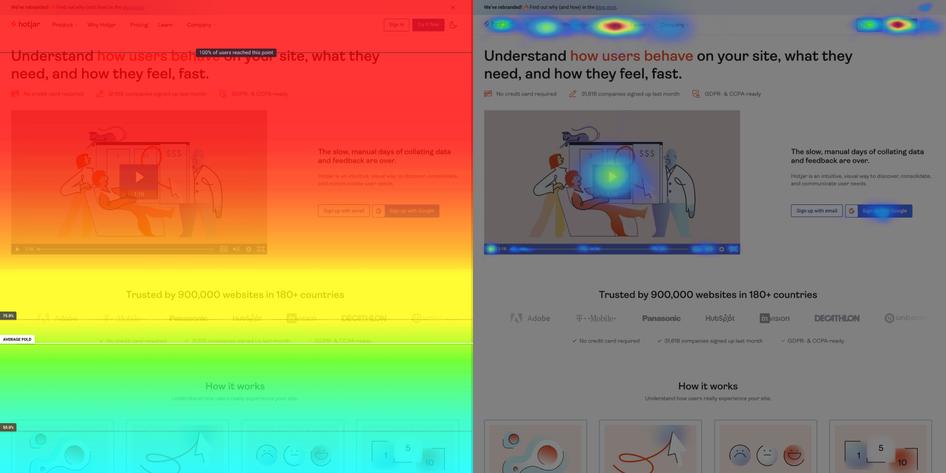
'Heatmap' (or 'heat map') is a broad term for different types of visual web analytics data. Scroll maps are one type of heatmap where the ‘hottest’ colors show the most viewed sections of the page, rather than the most clicked (or tapped) elements of it (this data is, not surprisingly, captured with a click map).
In other words, scroll maps generate heat zones of your website, app, or product pages from top to bottom, so they look more like a vertical rainbow instead of depicting the ‘confetti’ patterns typical of other types of heatmaps like click or move maps.
Check out these heatmap examples in action to see how scroll maps compare to the other types.
💡Pro tip: when you set up a heatmap in Hotjar, the Heatmaps tool automatically collects data for all heatmap types—scroll, click, rage click, and move.
You can even combine all heatmap data in one single view with the Engagement Zones map. This visualization helps you quickly identify what page elements users interact with the most, so you can validate that page’s UX and make sure it’s optimized for engagement.
5 ways to use scroll maps
You can be as creative as you like when it comes to spotting data patterns and UX optimization opportunities. To help you out, here are five of the most common ways to use scroll maps.
1. Find out where you’re losing people's attention
Scroll maps show you how far down the page users get ( percentage data will help you understand this, too): colder colors (blues) mean fewer people have seen that section of your page.
If your goal is to increase and hold user attention so people scroll further down the page—for example, if you have a long landing page and want to make sure they see all of the information on it—scroll map data will help you think practically about how you can tweak the UX design or copy to reduce drop-offs and increase conversion rates.
💡Pro tip: combine scroll maps with individual user session recordings (aka session replays) to watch how people actually interact with the page.
With Hotjar, you can easily zoom out from a single recording to observe wider trends with heatmaps, or zoom in from a heatmap to view recordings of people interacting with a page, so you can better understand both the individual and big picture user experience.
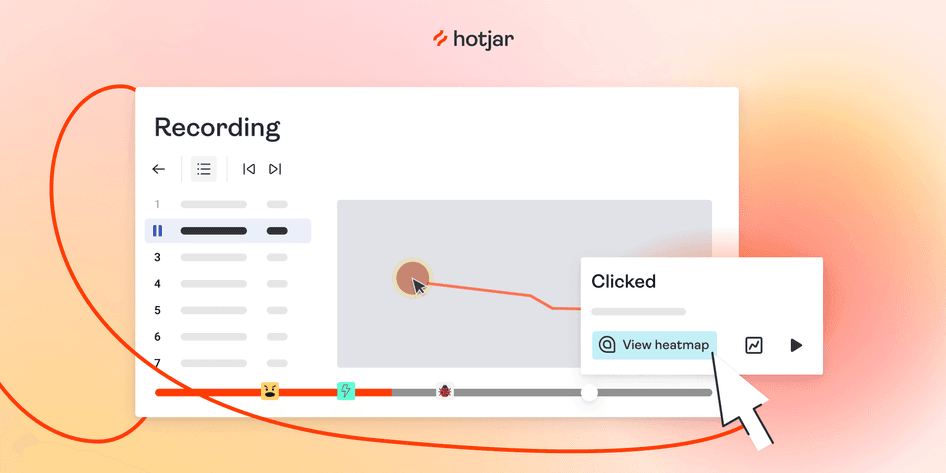
Hotjar lets you zoom out from session recordings to heatmaps to spot larger UX trends
2. Spot false bottoms
Sometimes, your visitors don’t realize there’s more content lower down the page. This is known as a ‘false bottom’, and it could be caused by white space, line breaks, or blocks that confuse and frustrate users. Using scroll map percentages, you can ‘depth test’ your pages to check for false bottoms and see how many people scroll past a certain element.
💡Pro tip: Hotjar’s rage click map tracks when a user clicks on an element repeatedly, expecting an interaction that never happens, ultimately resulting in frustration and a quick exit from your site. These heatmaps are great for identifying potential website bugs and other areas of frustration that might be leading to a page’s high bounce rate.

Hotjar rage click maps expose points of user frustration
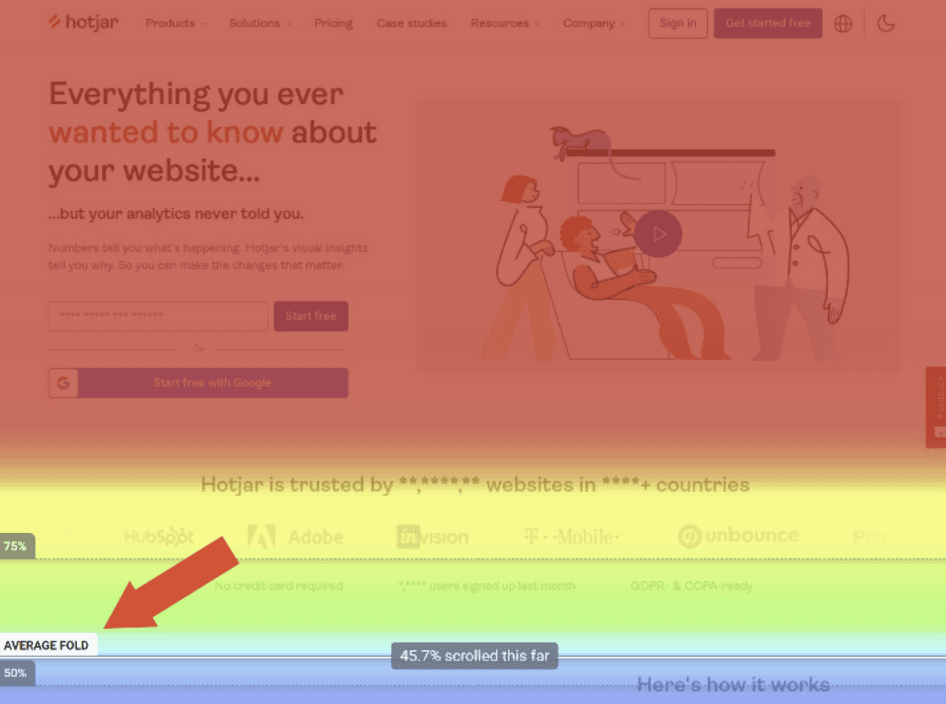
3. Discover if users see content above the average fold
The part of a web page known as ‘above the fold’ is the area that the majority of people will see upon landing—the ‘fold’ is simply the cut-off point at the bottom of a user’s screen before they need to scroll.
A scroll map automatically calculates the average fold on your page for both desktop and mobile users. By looking at scroll map average fold data, you can place important elements (like calls-to-action) above the fold in a way that works across multiple devices, to promote user engagement as soon as visitors land on the page.
Set up a scroll map today 🔥
Start collecting free scroll map data with Hotjar and discover how users experience your most important web pages so you can improve UX and increase conversions.
4. Figure out if users can find what they need
You’d be forgiven for assuming that the goal of optimizing a page using a scroll map is to get as many people as possible to scroll all the way to the bottom. But you’d be wrong. In some cases, users scroll because they can’t navigate your site to find the useful content they need.
UK-based digital agency Epiphany improved their client’s ecommerce site by adding filters to category pages after scroll map data showed users had to scroll too much to find what they needed (here’s the full heatmap case study).
Sometimes, with design, less really is more.
💡Pro tip: to get even more information about user behavior, set up an on-page survey with the Hotjar Surveys tool and ask questions like “Did you find what you were looking for today?” This qualitative data will give you an extra layer of context when reviewing quantitative heatmaps data.
5. Learn if your page offers a good cross-device experience
Users might not behave the same way on desktop and mobile. If you’re optimizing a responsive website (one that re-sizes the same page to each device), a scroll heatmap will show you where users stop scrolling on mobile and desktop, so you can design a multi-device experience that works for all your users.
Scroll data is there to help you design pixel-perfect user experiences; you can refer to the heatmap data to find exactly where you need to place a CTA to capture users’ attention on desktop and mobile.
💡Pro tip: in general, mobile-optimized pages tend to be shorter, but don’t blindly follow best practices. Collect your own scroll map data and find out how your users behave on mobile devices so you can determine the most appropriate page length and design for your audience.
How to set up scroll maps with Hotjar
Setting up a new scroll map is easy; if you’re not already a Hotjar customer, grab yourself a free trial now to get started with our Heatmaps tool.
When you create a new heatmap in Hotjar, it will automatically generate all heatmap types (click, rage click, move, scroll, and Engagement Zones), so there’s no need to do anything special to implement a scroll map.
Step 1: add the Hotjar tracking code to your website

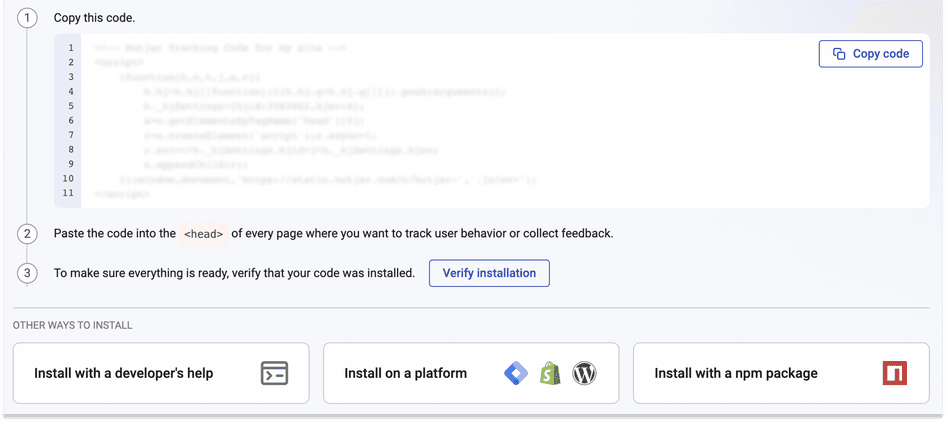
You can install the Hotjar tracking code in several ways, including via Google Tag Manager and the WordPress plugin.
Step 2: enable 'session capture'
Continuous heatmaps are generated from sessions. When 'session capture' is enabled, heatmaps are available automatically and they start collecting user behavior data. So, you first need to verify that 'session capture' is enabled by clicking on the traffic coverage widget in the top-right corner of the page.
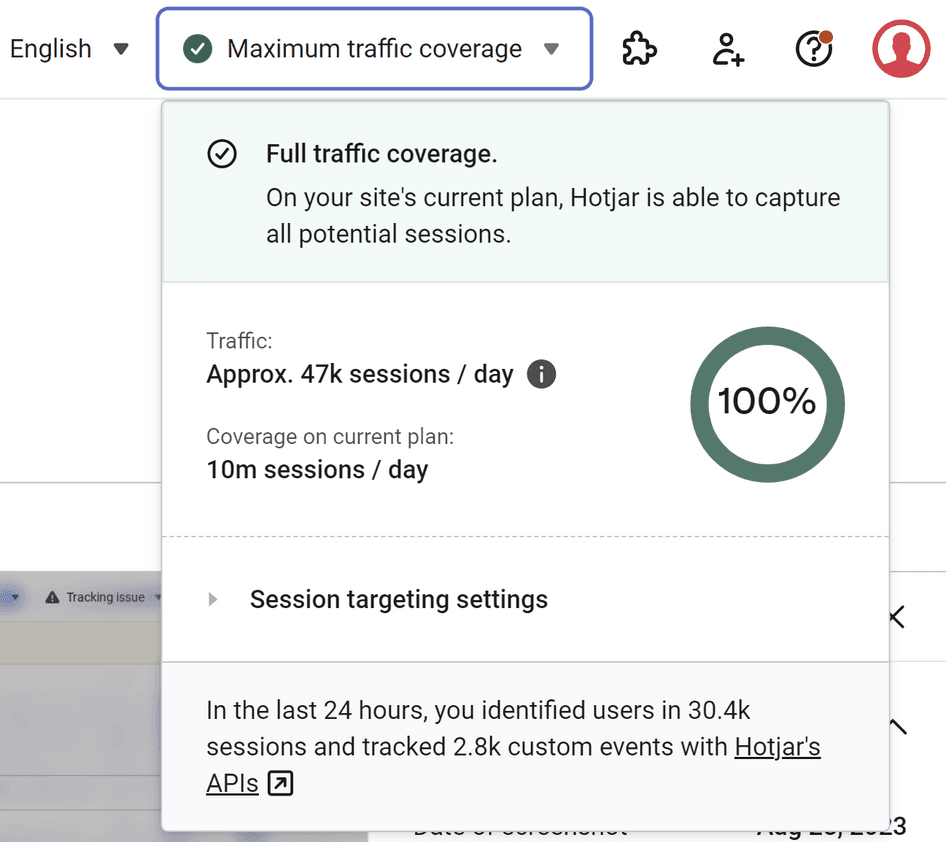
If session capture is not enabled, you will see an orange 'Session Capture Disabled' button at the top of the page, which takes you to the session capture configuration page.
Step 3: get started with continuous heatmaps and select your ‘data grouping’
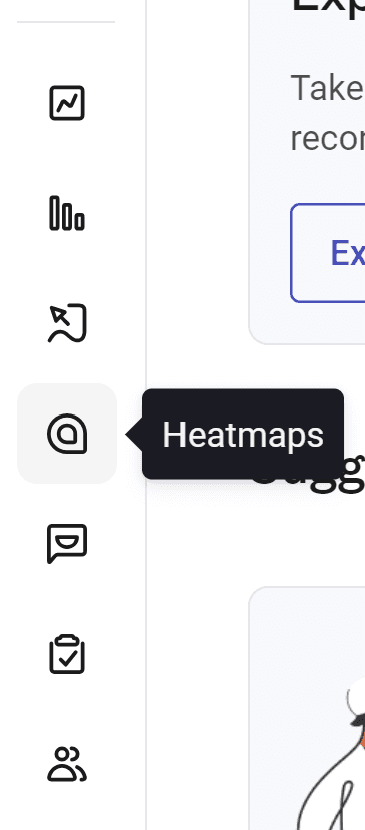
Click on Heatmaps in the left-hand navigation menu.
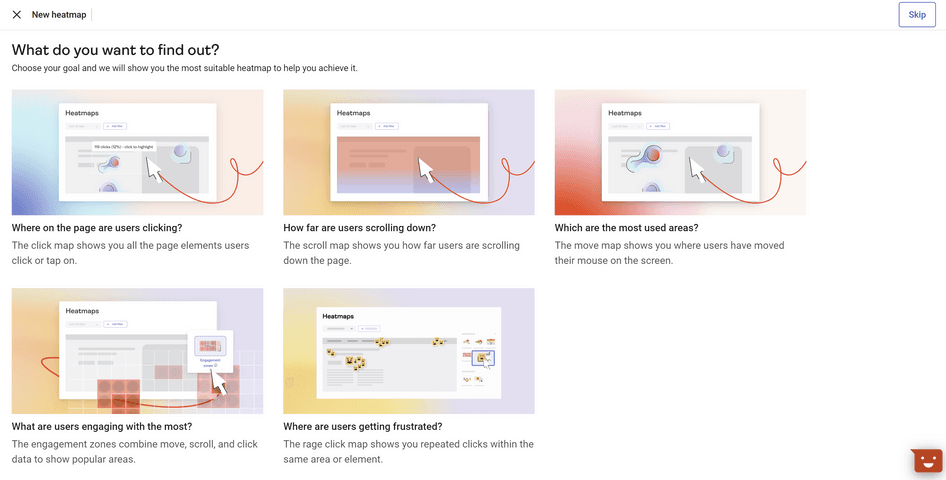
Then, click the ‘New heatmap’ button to get started.
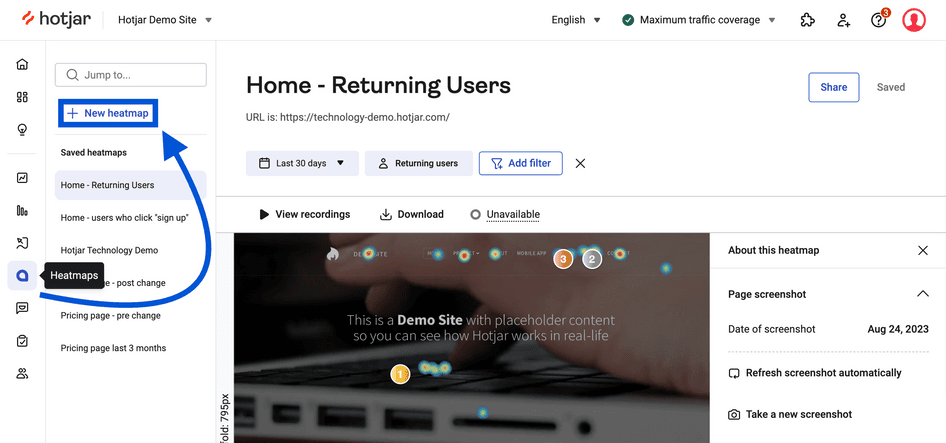
Heatmaps can show data from a single, specific URL or from a group of URLs that match your targeting criteria. When showing data from a group of URLs, you’ll only see one screenshot for your heatmap, but the metrics that appear over the screenshot will be aggregated from all the URLs matching your targeting criteria.
Step 4: enter a URL from your site and select a heatmap type
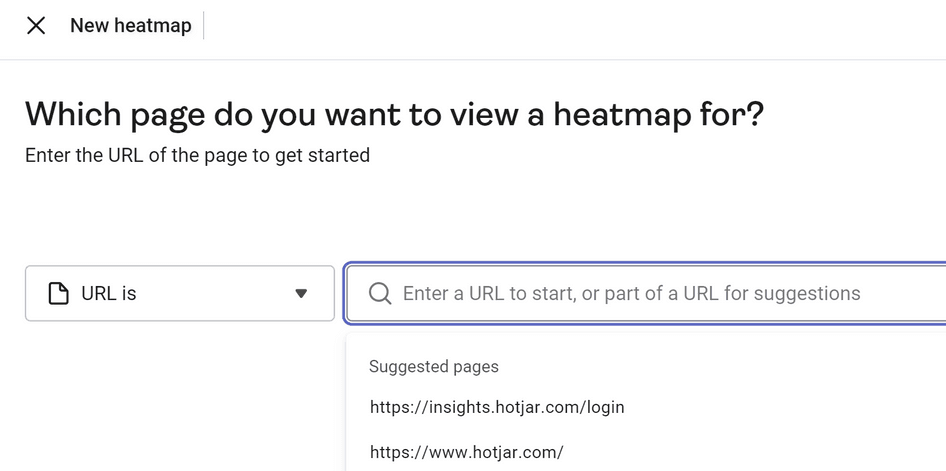
Enter the URL of the page you want to track, then select the type of heatmap you want to set up (remember, Hotjar will collect data for all heatmap types, so you can toggle to another type after creating one).
Your selection will take you back to the Hotjar dashboard where you can edit the heatmap and filter the collected data. To get more information about setting up a heatmap in Hotjar, click here.
Step 5: select filters according to your heatmap criteria
Update the date range and add any heatmap filters to display only those sessions that match your criteria, such as session duration, behavior, and user attributes—this could be their job title, country, and even language.
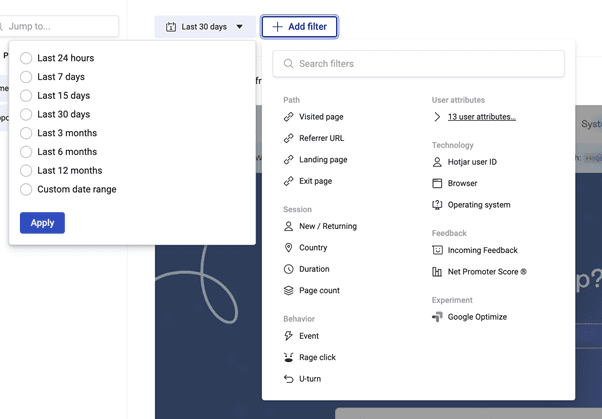
For more detail on all of Hotjar’s heatmap filters and example use cases, read this article: Use Cases for Filtering Heatmaps.
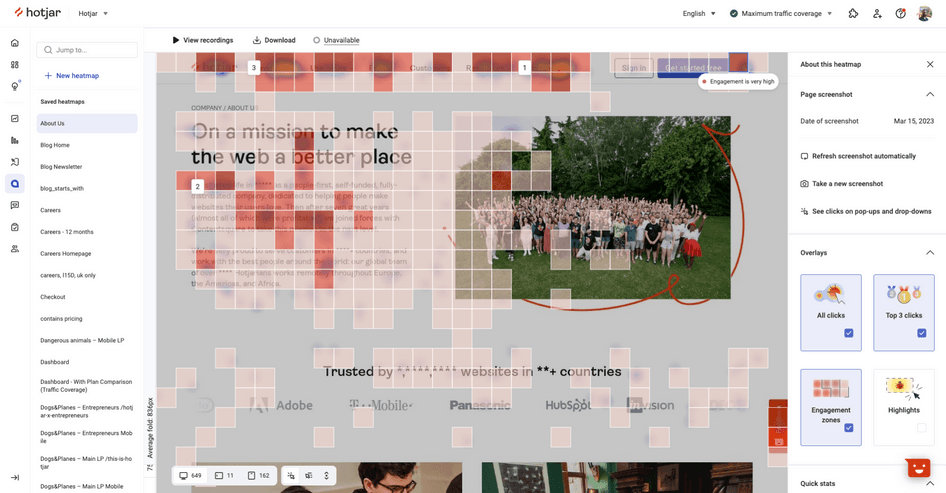
That’s it, your first scroll map is live! Here’s how it’ll look from inside the Hotjar dashboard:
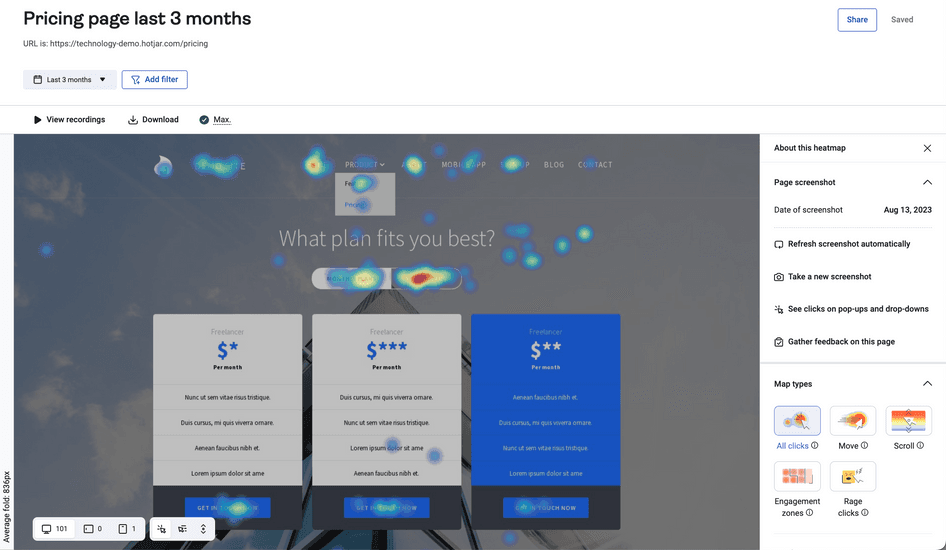
You can toggle your heatmap to show desktop, tablet, or mobile sessions. To view the scroll map data, simply click ‘Scroll’ in the heatmap type options. You can also view and download/export all the raw data. Have fun!
Set up a scroll map today 🔥
Start collecting free scroll map data with Hotjar and discover how users experience your most important web pages so you can improve UX and increase conversions.